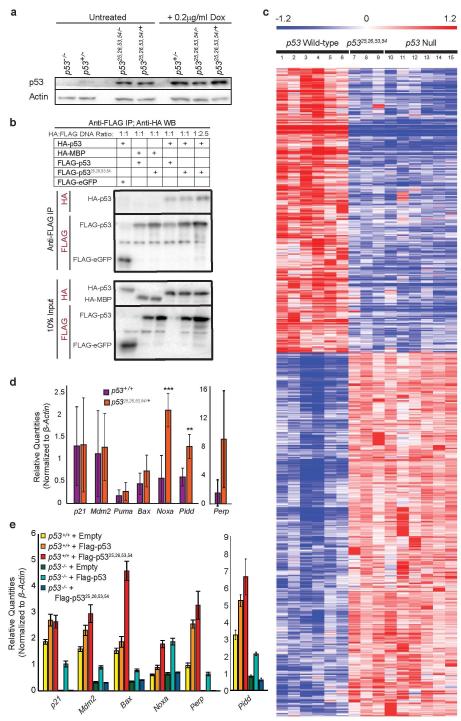
Extended Data Figure 7. p5325,26,53,54 is Transactivation-Dead but Augments Wild-Type p53 Activity.
(a) Western blot analysis of p53 protein levels in untreated or doxorubicin-treated (0.2 μg/ml Dox) p53−/−, p53+/−, p5325,26,53,54/−, and p5325,26,53,54/+ MEFs. Actin serves as a loading control. (b) Western blot analysis of anti-FLAG immunoprecipitation from p53−/− MEFs transiently overexpressing HA-p53 and FLAG-p53 or FLAG-p5325,26,53,54. HA-MBP and FLAG-eGFP were used as negative controls. Immunoprecipitated protein and 10% input were probed with either anti-HA or anti-FLAG. (μg ratio of HA-p53 to FLAG-p53 or FLAG-p5325,26,53,54 plasmid DNA: 1:1 or 1:2.5). (Supplement to Fig. 3b) (c) Heat map examining the transactivation capacity of p5325,26,53,54 on p53-dependent genes identified by microarray analysis through comparison of six HrasV12;p53 wild-type mouse embryo fibroblast (MEF) lines to six HrasV12;p53−null MEF lines, as previously described3. Three independent HrasV12;p5325,26,53,54/25,26,53,54 MEFs lines were analyzed, and showed that the gene expression profiles were indistinguishable from HrasV12;p53 null cells. Numbered columns indicate independent MEF lines. Blue – repressed genes; Red – induced genes. (d) qRT-PCR analysis of p53 target gene expression in untreated MEFs derived from p53+/+ and p5325,26,53,54/+ E13.5 embryos. Graphs indicate averages from four independent MEF lines, +/−SD, after normalization to β-actin. **,*** denote p-values of <0.01, and <0.005, respectively, by Student’s t-test analysis. (e) qRT-PCR analysis of p53 target gene expression in p53+/+ and p53−/− MEFs stably transduced with empty vector, FLAG-p53, or FLAG-p5325,26,53,54. Representative gene expression from one experiment. +/−SD of technical triplicates after normalization to β-actin.

