

Abstract
Introduction
Early detection of pancreatic cancer could save many thousands of lives. Non-invasive diagnostic imaging, including PET with [18F]FDG, have inadequate resolution for detection of small (2–3 mm) pancreatic tumors. We demonstrated the efficacy of PET imaging with an 18F-labeled lactose derivative, [18F]FEDL, that targets HIP/PAP, a biomarker that is overexpressed in the peritumoral pancreas. We developed another analogue, 1-[18F]fluoroethyl lactose ([18F]FEL), which is simpler to synthesize, for the same application. We conducted a preliminary evaluation of the new probe and its efficacy in detecting orthotopic pancreatic carcinoma xenografts in mice.
Methods
Xenografts were developed in nude mice by injecting L3.6pl/GL+ pancreatic carcinoma cells into the pancreas of each mouse. Tumor growth was monitored by bioluminescence imaging (BLI); accuracy of BLI tumor size estimates was verified by MRI in two representative mice. When the tumor size reached approximately 2–3 mm, the animals were injected with [18F]FEL (3.7 MBq) and underwent static PET/CT scans. Blood samples were collected at 2, 5, 10, 20 and 60 min after [18F]FEL injection to track blood clearance. Following imaging, animals were sacrificed and their organs and tumors/pancreatic tissue were collected and counted on a gamma counter. Pancreas, including tumor, was frozen, sliced and used for autoradiography and immunohistochemical analysis of HIP/PAP expression.
Results
Tumor growth was rapid, as observed by BLI and MRI. Blood clearance of [18F]FEL was bi-exponential, with half-lives of approximately 3.5 min and 40 min. Mean accumulation of [18F]FEL in the peritumoral pancreatic tissue was 1.29±0.295 %ID/g, and that in the normal pancreas of control animals was 0.090±0.101 %ID/g. [18F]FEL was cleared predominantly by the kidneys. Comparative analysis of autoradiographic images and immunostaining results demonstrated a correlation between [18F]FEL binding and HIP/PAP expression.
Conclusion
[18F]FEL may be useful for non-invasive imaging of early-stage pancreatic tumors by PET. The results warrant further studies.
Keywords: Pancreatic cancer, [18F]lactose, PET, HIP/PAP, tumor imaging
Introduction
Since the authorisation of the U.S. “war on cancer” in 1971, a significant number of national resources have been allocated to improve diagnosis and management of the disease. Collectively, the various initiatives have led to an increase in the number of survivors from all cancers in the U.S. (1 in 69 in 1971 to 1 in 23 in 2013) [1, 2]. While this statistic is very positive, examination of the data reveals that some cancers have shown little or no change in survival. One of these is pancreatic cancer, particularly cancers arising from the exocrine portion of the pancreas. In the U.S., pancreatic adenocarcinoma is the 10th most diagnosed cancer in men and the 9th most common in women and ranks 4th as a cause of cancer-related deaths [2].
Surgical resection is the most viable option for a cure, but the majority of patients who undergo surgery die of metastatic disease [3]. Even regimens combining surgery with chemotherapy or with both radiation and chemotherapy do not improve survival rates significantly. Early detection and treatment do, however, have a positive impact on 5-year survival rates [4, 5]. A good prognosis for patients with pancreatic cancer is predicted by a small tumor (<2 cm), the absence of a tumor after treatment, and a clear surgical resection margin [4]. Pancreatic cancer is usually asymptomatic in the early stages and becomes symptomatic only in the advanced stages. By the time these advanced cases are detected, therapeutic options are limited or no longer available. Even if the presence of cancer is suspected at an early stage, current imaging modalities such as CT, MRI or even [18F]FDG PET/CT lack the necessary sensitivity and specificity to detect small lesions that may be curable [6]. Assay methods that are highly sensitive and specific for pancreatic tumor biomarkers are clearly needed to increase opportunities for earlier diagnosis and therapeutic intervention. Currently, no diagnostic test is sufficiently reliable for accurate detection of early-stage pancreatic cancer.
A number of biomarkers, including hepatocarcinoma-intestine-pancreas/pancreatitis-associated protein (HIP/PAP), lactotransferrin (LTF); human cartilage glycoprotein-39 (HC-gp39), pancreatic stone protein (PSP), Reg1L, actinin alpha 1, and others, that are overexpressed in pancreatic carcinomas have been reported in the literature [7–10], but they have not been exploited in the clinic. We have focused our research efforts on development of PET imaging agents that target HIP/PAP. HIP/PAP is a member of the Regenerating (Reg) gene family and is classified in group VII of the calcium-dependent (C-type) lectin gene and encodes proteins with single carbohydrate-binding domain linked to a single peptide [11–15]. The HIP/PAP carbohydrate-binding domain has a binding affinity for D-lactose that is 60–100 times greater than that for galactose and other sugars [11]. HIP/PAP is overexpressed in the peritumoral region of pancreatic tumors by a factor of 130 times more than in normal tissue and nine times more than in pancreas affected by chronic pancreatitis [7, 13].
Because of its overexpression during pancreatic carcinogenesis, HIP/PAP is a promising target for PET imaging. We and others have pursued targeting the carbohydrate-binding domain of HIP/PAP by developing derivatives of the D-lactose molecule as PET imaging agents. The early work by Bormans and Verbruggen reported on the biodistribution properties of one such 18F-labeled lactose derivative, β-O-D-galactopyranosyl-(1,4′)-2′-2′-deoxy-2′-[18F]fluoro-D-glucopyranose ([18F]FDL), in mice [16]. This compound was synthesized by enzymatic reaction and resulted in a low radiochemical yield. [18F]FDL did not accumulate in any of the major organs of the mice and was rapidly cleared from the circulation via the kidneys, appearing in the urine as the non-metabolised parent compound. Subsequently, our group reported on the synthesis and biological characterisation of a similar 18F-labeled lactose derivative, β-O-D-galactopyranosyl-(1,4′)-2′-deoxy-2′-[18F]fluoro-ethyl-D-glucopyranose ([18F]FEDL) [17]. The final product was synthesized by radiofluorination of a precursor, which was synthesized through a 12-step process. [18F]FEDL demonstrated efficacy in the micro-PET/CT detection of early microscopic pancreatic carcinoma lesions in an orthotopic xenograft model of L3.6pl pancreatic carcinoma in mice [18].
Those results suggested that [18F]FEDL is an excellent agent for targeting HIP/PAP and PET imaging of pancreatic carcinomas in animals. However, the lengthy synthesis process of the precursor and low overall yields made it unattractive for practical application. Turkman et al. synthesized another chemical variant, 1′-[18F]fluoroethyl-β-D-lactose ([18F]FEL), from bromo- and tosyl-containing precursors that required only four steps to synthesize [19]. However, the radiochemical yields of [18F]FEL were quite low from these precursors. We developed two other precursor molecules, 1′-(methanesulfonylethyl)-2′,3′,6′,2,3,4,6-hepta-O-acetyl-β-D-lactose and 1′-(p-nitrophenylsulfonylethyl)-2′,3′,6′,2,3,4,6-hepta-O-acetyl-β-D-lactose, and found that [18F]FEL synthesized from the nosyl derivative produced radiochemical yields of over 60% [20]. We recently published a report on formulation of [18F]FEL and its in vitro stability showing that the final product is stable at ambient temperature, allowing its use in animal studies [21]. The present report presents preliminary data on the efficacy of [18F]FEL in detection of early-stage pancreatic cancer by targeting HIP/PAP in the L3.6pl orthotopic xenograft nude mouse model of pancreatic carcinoma.
Materials and Methods
Reagents and instrumentation
Reagents and solvents were purchased from Aldrich Chemical Co. (Milwaukee, WI) and used without further purification. K[18F]/kryptofix 2.2.2. was obtained from the Center for Advanced Biomedical Imaging at The University of Texas MD Anderson Cancer Center (Houston, TX) as an aqueous solution. D-Luciferin potassium salt was purchased from Gold Biotechnology, Inc. (St Louis, MO).
High-performance liquid chromatography (HPLC) was performed using an 1100 series pump (Agilent Technologies, Stuttgart, Germany) with a built-in UV detector operated at 210 nm and 254 nm and a radioactivity detector with a single-channel analyser (Bioscan, Washington, DC). Crude products were purified on a semipreparative C18 reverse-phase column (Alltech, Econosil, 10×250 mm), and quality control analyses were performed on an analytical C18 column (Alltech, Econosil, 4.6×250 mm).
Production of [18F]FEL
Detailed radiosynthesis and production procedures for [18F]FEL were reported previously [19, 20]; for the work described here, however, modifications were made in dose preparation and thin-layer chromatography analysis [21]. Briefly, radiofluorination reactions were carried out using 1′-(p-nitrophenylsulfonylethyl)-2′,3′,6′,2,3,4,6-hepta-O-acetyl-β-D-lactose precursor and K[18F]/kryptofix in anhydrous acetonitrile at 80°C for 20 min to produce 1′-[18F]fluoroethyl-2′,3′,6′,2,3,4,6-hepta-O-acetyl-β-D-lactose. The crude product was passed through a silica gel Sep-Pak cartridge and eluted with ethyl acetate. The radiolabeled crude intermediate product was purified by HPLC using a semipreparative C18 column and 45% MeCN/water solvent system. The HPLC solvent was evaporated under vacuum at around 40°C. The radiolabeled intermediate pure compound was dissolved in CH2Cl2 and transferred into a V-vial, and the solvent was evaporated by blowing argon. The residue was hydrolysed with 0.5 M NaOMe in methanol at 80°C for 5 min. The solvent was evaporated and the product was neutralised with 1N HCl and diluted with phosphate-buffered saline solution (PBS) containing 1% ethanol. The product solution was passed through an anion-exchange cartridge, and the pH of the solution was adjusted to 7.0–7.5 by adding 20 μL NaHCO3 solution (1M). The purity of the [18F]FEL product was verified by radio-thin layer chromatography developed in 70% MeOH/EtOAc, which showed the product to be >99% pure with an Rf value of 0.5.
Cell culture and transduction
To establish pancreatic tumor xenografts in nude mice, human L3.6pl pancreatic cancer cells were stably transduced with a retroviral vector bearing dual reporter gene GL, a tandem fusion of the green fluorescence protein and firefly luciferase genes, as previously reported [18]. Transduced L3.6pl-GL+ cells were selected by fluorescence-activated cell sorting and their fluorescence and bioluminescence properties were characterised as previously described [22]. After incubation in flasks with DMEM/F12 medium, supplemented with 10% fetal bovine serum, penicillin and streptomycin, at 37°C in a humidified atmosphere with 5% CO2, the cells were harvested by trypsinisation and the cell suspension subjected to centrifugation at 5000 rpm for 5 min; the culture medium was removed by aspiration. The cell pellet was resuspended in sterile PBS for orthotopic injection into the pancreas.
Orthotopic pancreatic tumor model
Animal studies adhered to a protocol approved by the Institutional Animal Care and Use Committee of MD Anderson Cancer Center. Tumor implantation was performed as previously described [18]. Briefly, 4- to 6-week-old athymic nude mice (n=15, Charles River Laboratories) were anaesthetised by isoflurane inhalation (2–2.5% in oxygen). A small incision (2 cm) was made in the left abdominal wall. The spleen was then exteriorised along with the underlying pancreas. A suspension of approximately 1×10⁶ L3.6pl-GL+ cells in 50μL of sterile PBS was slowly injected directly into the tail of the pancreas. The wound was closed with nylon sutures and treated with antibacterial, antimycotic cream. After the operation, the animals were warmed and monitored until conscious and then placed in HEPA-filtered cages with food and water. A control group of animals (n=5) received no injections into the pancreas to avoid a nonspecific inflammatory response, which could induce HIP/PAP expression in the pancreas around the site of injection.
Bioluminescence imaging
To monitor the development of tumors, mice received intraperitoneal injections of D-luciferin (Gold Biotech, MO, 150 mg/kg) and underwent bioluminescence imaging (BLI) on days 4, 7, 10 and 14 after injection of tumor cells. For each imaging, the animals were anaesthetised with 2% isoflurane in oxygen and placed into the light-tight chamber of an IVIS200 imaging system (Xenogen Corp., Almeda, CA). Bioluminescence images were acquired using the following parameters: image acquisition time 1–5 s; binning 2; no filter; f/stop; field view, 10 cm. The signal intensity was quantified as the sum of all detected photons within the region of interest per second per cm2 per steradian (ph/s/cm2/sr) by using Living Image software (Xenogen Corp.).
Magnetic resonance imaging
To verify BLI measurements of tumor size and location, two representative tumor-bearing mice underwent MRI. The animals were anaesthetised with isoflurane inhalation (2–2.5% in oxygen) and scanned on a 4.7T Biospec USR47/40 small animal MR imaging system (Bruker Biospin MRI, Inc., Billerica, MA) with a 35-mm linear volume resonator and 60-mm micro-imaging gradients. A three-plane FLASH imaging sequence was used to confirm animal positioning. Coronal T2-weighted RARE images (TE/TR 57/3000ms, FOV 4cm×3cm, matrix 256×192, RARE factor 12) and ventilation-gated axial T2-weighted RARE images (TE/TR 46.5/1800ms, FOV 4cm×4cm, matrix 256×256, RARE factor 8) were used for determining tumor location and measuring tumor volume.
PET/CT imaging
To test the efficacy of [18F]FEL in homing to tumor, tumor-bearing (n=6) and control (n=5) mice underwent [18F]FEL PET/CT. The same protocol was used for both groups. A small animal PET/CT INVEON scanner (Siemens Preclinical Solutions, Knoxville, TN) was used. Mice were anaesthetised with isoflurane (2% in oxygen) and their temperature maintained at 38°C by setting on a heating pad. Animals were injected with [18F]FEL (approximately 3.7 MBq in 100 μL PBS containing 1% ethanol) as a slow bolus into the tail vein. Forty minutes after tracer injection, CT scan was acquired over 10 min with the following imaging parameters: X-ray voltage 80kVp, anode current 500 mA and exposure time 300–350 ms for each of the 360 rotational steps. Immediately following CT scan, beginning 50 min after tracer injection, static PET scan was performed over 10 min, after which animals were removed from the scanner for the biodistribution study. Images were reconstructed by using the two-dimensional ordered subsets expectation maximisation (OSEM) algorithm. PET and CT image fusion and image analysis were performed by the ASIPro 5.2.4.0 software (Siemens Preclinical Solutions).
Biodistribution and blood clearance
To determine the distribution of radioactivity in the body after [18F]FEL administration, the [18F]FEL-administered mice were sacrificed after the PET scan, and their organs and tumor/peritumoral tissues were collected and weighed. The radioactivity in each organ was counted in a gamma counter (Cobra II, Perkin Elmer). Percent injected dose per gram (%ID/g) was calculated for each organ and tissue sample, and an average radioactivity accumulation was determined with standard deviation.
Some of the tumor-bearing mice (n=4) administered [18F]FEL underwent serial blood draws for a blood clearance study. Blood samples (1–2 μL) were collected in capillary tubes from the second tail vein at 2, 5, 10, 20 and 60 min post injection. The radioactivity in each sample was counted in a gamma counter and %ID/g was calculated. The activity (%ID/g) was plotted against time to generate a blood clearance curve, from which the plasma/blood half-life of the radiotracer was calculated.
Autoradiography
To more closely examine the homing of [18F]FEL in the area of the tumor, autoradiographic studies were performed. For autoradiography, animals (n=2) were injected with 18.5 MBq of [18F]FEL and PET/CT scans were obtained as already described. After PET imaging, the animals were sacrificed and each pancreas with tumor was rapidly extracted, frozen and embedded in mounting medium M1 (Shandon-Lipshaw, Pittsburg, PA). Serial 20-μm coronal sections of frozen tissues were cut with a cryomicrotome (CM3050S, Leica, Germany). Tissue sections were thaw-mounted on poly-A lysine–coated glass slides and heat-fixed for 5 min at 65°C on a slide warmer (Fisher Scientific, PA). Tissue sections were exposed to a phosphor plate (Fujifilm Life Science, Woodbridge, CT), and the exposed plate was scanned by an FLA-5100 image reader (Fujifilm Life Science) using IP-S mode; the images were processed by the MultiGauge V3 software.
For ex vivo autoradiography, adjacent sections of frozen pancreatic tumor and peritumoral tissue obtained from tumor-bearing animals not injected with the radiotracer were placed onto glass slides, and a solution of [18F]FEL in normal saline solution (240 μCi/15 mL) was gently applied directly onto the section. The slides were placed in a humidified black box at room temperature for 60 min to reduce evaporation. The excess radioactivity was removed by washing three times in ice-cold PBS/Triton X-100 (0.01%) at pH 7.4. To assess the specificity of [18F]FEL binding, one of the adjacent tissue sections was pre-treated with cold lactose solution (1 mM) for 30 min before incubation with [18F]FEL as already described. Both sets of slides were dried and exposed to a phosphor plate for 6–8 h. The exposed plate was scanned by an FLA-5100 image reader using IP-S mode and the images were processed by the MultiGauge version 3 software.
Immunohistochemistry for HIP/PAP expression
To determine the expression of HIP/PAP in the pancreatic tumors and surrounding tissue, immunohistochemical analysis was used. Frozen tissue sections (20 μm) from animals injected with the radiotracer and paraffin-fixed tissue sections (5 μm) from animals that were not injected with the tracer were subjected to immunostaining for HIP/PAP. The sections used for immunostaining were adjacent to those used for ex vivo autoradiography. The sections were incubated in 3% aqueous H2O2 to block the endogenous peroxidase activity, washed and then incubated in 2% normal horse blocking serum for 60 min at room temperature. The sections were incubated with monoclonal anti-mouse Reg II antibody (R&D Systems Inc., Minneapolis, MN) at 1:50 dilution in Tris-NaCl overnight at 4°C. They were then incubated with the secondary biotinylated horse anti-mouse IgG and subjected to the avidin-peroxidase conjugation and 393-diaminobenzidine chromophore development steps of the Vectastain ELITE kit (Vector Laboratories, Burlingame, CA) according to the manufacturer’s protocol. The tissue sections were either counterstained with hematoxylin or used without counterstaining for densitometric analysis of the intensity of HIP/PAP immunostaining.
Statistical data analysis was performed using a two-tail Student t-test and assuming unequal variances.
Results
Orthotopic pancreatic tumor xenograft model and bioluminescence imaging
A total of 15 mice received an injection of 1 million L3.6pl-GL+ cells for orthotopic implantation of xenografts into the pancreas. The mice underwent BLI (following intraperitoneal injections of D-luciferin) on days 4, 7, 10 and 14 to monitor the growth of orthotopic pancreatic carcinoma xenografts. Of the 15 animals, 12 had a detectable tumor, for a tumor implantation success rate of 80%.
Figure 1 shows tumor growth in representative mice. Distinct BLI signal was detectable on day 4 in the area of the L3.6pl-GL+ cell injection site (Fig. 1A). Subsequent BLI showed continuous tumor growth (Fig. 1A). Figure 1B shows the quantitative tumor growth as measured by BLI; tumor growth was largely linear from day 4 to day 14, except for a slowing from day 7 to day 11. Because the BLI indicated reasonably good tumor size by day 14, MRI and PET/CT imaging studies were performed after 14 days of injection of L3.6pl/GL+ cells.
Figure 1.
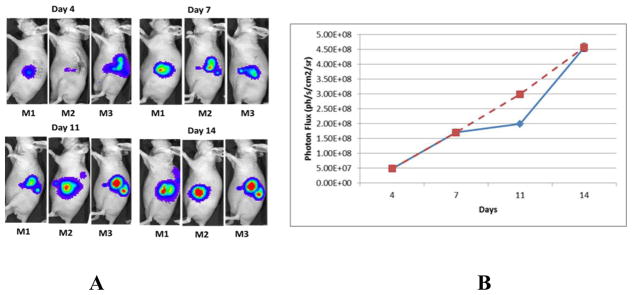
(A) Tumor growth determined by BLI. (B) Quantitative tumor growth curve measured by light absorption (Photon Flux); blue line represents actual growth; broken red line represents linear growth.
Magnetic resonance imaging
To confirm that the BLI were accurately reporting the presence of tumors, two animals (M2 and M3) with larger tumors (determined by BLI) were selected and scanned on a micro-MRI scanner. Figure 2 depicts MR images of these two tumor-bearing mice; the tumor diameters were calculated to be 3.00 mm for the animal shown in 2A and 2B (M2) and 2.67 mm for the animal shown in 2C and 2D (M3).
Figure 2.
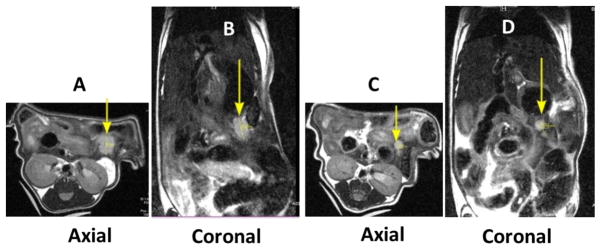
MR images obtained on two tumor-bearing mice. (A) and (B) are axial and coronal images of one mouse (M2), and (C) and (D) are axial and coronal images of the other (M3). Tumors are indicated by arrows.
PET/CT imaging
Figure 3 shows static PET/CT and MR images of a representative tumor-bearing mouse (M3) and demonstrates accumulation of [18F]FEL in the area of L3.6pl-GL+ cell injection or in surrounding tissue. There was no significant specific retention of the [18F]FEL-derived radioactivity in organs and tissues other than the kidneys and urinary bladder, which are involved in normal physiologic clearance of this radiotracer. Tumor and kidney are indicated with arrows. It should be noted that the axial MRI has been flipped (Fig. 3D) to make the image comparable with the PET/CT images; for example, the kidneys on the original MRI were below the tumor and in this image they are above the tumor.
Figure 3.
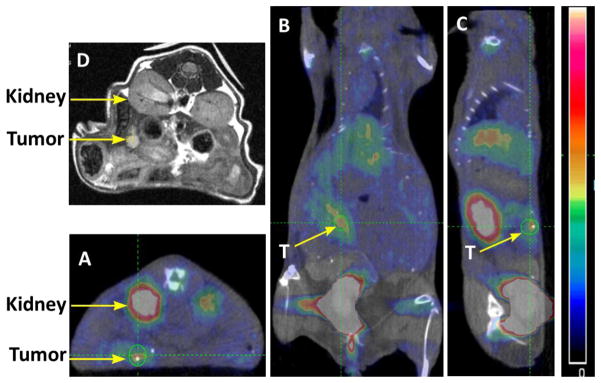
PET/CT and MR images of a representative tumor-bearing animal after injection of [18F]FEL: (A) axial image; (B) coronal image; and (C) sagittal image. (D) Axial MRI.
In the control animals that did not undergo tumor cell implantation, no radioactivity accumulation was observed in the pancreas or any other organ except the kidneys and urinary bladder (Fig. 4). Figure 4A (axial image) clearly shows that there was no [18F]FEL accumulation below the kidney (left side), where [18F]FEL was seen in the tumor-bearing animals (Fig 3A). Similarly, coronal and sagittal images did not show any accumulation of [18F]FEL in the pancreas or its neighbouring region.
Figure 4.

PET/CT images of a representative control animal, which did not receive any tumor cell injection: (A) axial image; (B) coronal image; and (C) sagittal image.
Biodistribution study
The biodistribution of [18F]FEL-derived radioactivity in organs and tissues at 60 min post intravenous injection is provided in Table 1.
Table 1.
Biodistribution of [18F]FEL in control (normal nude mice) and tumor-bearing mice at 60 min post injection.
| Organ | %ID/g (control group) | %ID/g (tumor group) | PT/organ |
|---|---|---|---|
| Blood | 0.254±0.156 | 0.221±0.068 | 5.84±1.23 |
| Brain | 0.046±0.045 | 0.064±0.021 | 20.15±3.52 |
| Muscle | 0.103±0.106 | 0.102±0.067 | 12.64±2.56 |
| Bone | 0.152±0.082 | 0.193±0.089 | 6.68±1.85 |
| Heart | 0.137±0.082 | 0.143±0.057 | 9.02±2.34 |
| Lung | 0.241±0.155 | 0.212±0.058 | 6.08±1.75 |
| Liver | 0.238±0.086 | 0.341±0.127 | 3.78±0.89 |
| Spleen | 0.111±0.093 | 0.141±0.047 | 9.15±2.34 |
| Pancreas | 0.090±0.010 | 0.152±0.047 | 8.48±2.12 |
| Intestine | 0.157±0.075 | 0.161±0.036 | 8.01±2.56 |
| Stomach | 0.173±0.039 | 0.142±0.035 | 9.08±2.01 |
| Kidney | 1.525±0.576 | 2.096±0.915 | 0.62±0.12 |
| Peritumoral tissue | N/A | 1.29±0.295 | 1.00±0.25 |
• PT= peritumoral tissue
Accumulation of [18F]FEL in most organs and tissues was comparable between the control group and the tumor-bearing group of animals. An exception is the pancreas, where accumulation of [18F]FEL was slightly higher (0.152±0.047 %ID/g) in tumor-bearing animals than in control animals (0.090±0.010 %ID/g). In the tumor-bearing animals, the peritumoral region had significantly higher accumulation (p<0.05) of [18F]FEL (1.29±0.295 %ID/g) than the control group (0.090±0.010). Kidneys had the highest radioactivity accumulation in both groups because of the renal clearance of the radiotracer. Brain had the lowest accumulation of radioactivity in both groups. Peritumoral tissue-to-blood ratio was 5.84 and that for the normal pancreas was 8.48.
Figure 5 represents the ratios of accumulation of [18F]FEL in peritumoral tissue to that in organs.
Figure 5.

Ratio of accumulation of [18F]FEL in peritumoral tissue to blood and peritumoral tissue to organs.
Blood clearance
The blood clearance curve for [18F]FEL in tumor-bearing nude mice (n=4) is shown in Figure 6. The radioactivity peaked at approximately 2 min after tail vein injection of [18F]FEL, in the range of 65% ID/g; after which a rapid decrease was observed followed by a slow clearance. [18F]FEL clearance from the blood was bi-exponential, with half-lives (t1/2) of approximately 3.5 min and 40 min. About 0.1% of the injected dose/g remained in the blood at 60 min.
Figure 6.
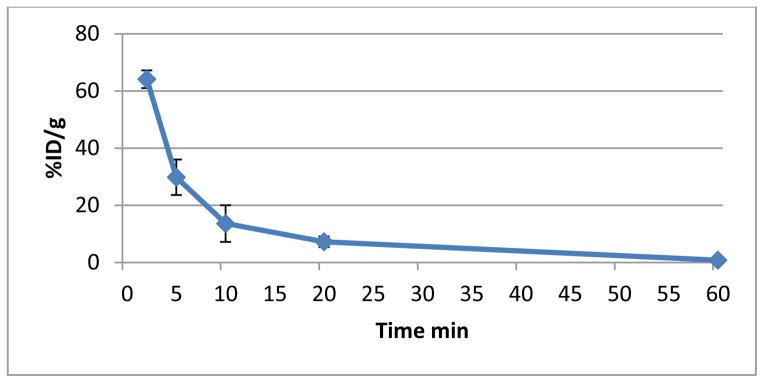
Blood clearance curve of [18F]FEL in tumor-bearing nude mice (n=4).
Autoradiography and immunohistochemistry
Figure 7 represents qualitative autoradiography and immunohistochemistry of the tumors and peritumoral pancreas. The sections showed accumulation of radioactivity in the peritumoral region but no significant radioactivity in the tumor itself (Fig. 7A, 7B). Immunostaining showed elevated HIP/PAP expression in the same peritumoral area where radioactivity accumulated (Fig. 7C, 7D). These results suggest that [18F]FEL binds with HIP/PAP.
Figure 7.
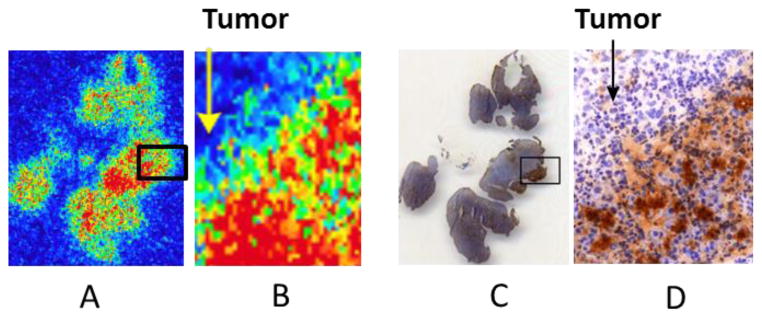
(A) Qualitative autoradiograph of a representative section of tumor and peritumoral pancreatic tissue. (B) Amplification of a small section of (A). (C) Immunohistochemical staining of the slice adjacent to the one shown in (A) containing tumor and peritumoral pancreatic tissue. (D) Amplification of a small section of (C).
Figure 8 represents qualitative ex vivo autoradiography and immunohistochemical analysis of adjacent sections of tumor and peritumoral pancreatic tissue. Ex vivo autoradiography was performed to further examine the localisation of [18F]FEL-related radioactivity and HIP/PAP in the tumor and peritumoral region. While the unblocked peritumoral tissue showed accumulation of radioactivity (Fig. 8A), no significant radioactivity was detected in the tumor or in the blocked peritumoral tissue (Fig. 8B). Similarly, high HIP/PAP expression was observed in the peritumoral tissue but not in the tumor (Fig. 8C, 8D). These images suggest that binding of [18F]FEL was specific to HIP/PAP, which was expressed only in peritumoral pancreas.
Figure 8.
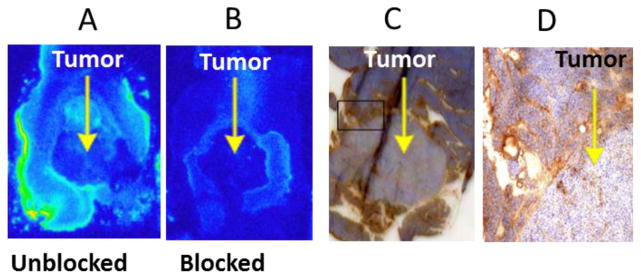
Ex vivo autoradiography and immunostaining of adjacent sections of tumor and peritumoral pancreas. (A) Unblocked section. (B) Section blocked with 1mM lactose solution prior to exposure to [18F]FEL. (C) Immunohistochemical staining of a section adjacent to that shown in (A) for HIP/PAP. (D) Amplification of a small section of (C).
Discussion
Transducing cancer cells with GL before implantation gives the advantage of allowing their growth to be monitored by non-invasive BLI and quantified by measuring photon flux over time. In our study, these measurements were useful for identifying when the tumor size was optimal for PET/CT imaging (i.e., 14 days). In a previous study, the PET/CT imaging was performed using [18F]FEDL 10 days after tumor implantation. Although tumor growth in the present study was nearly linear, it was not as fast on day 11 as on days 7 and 14. On day 14, BLI results suggested that the tumors were in good size for PET/CT. Although BLI and photon flux measurement provided information on tumor growth, actual tumor size cannot be determined by visual observation from BLI or photon flux. We therefore performed micro-MRI on two animals with larger-appearing tumors on BLI to confirm the presence, location and size of tumors. MRI was helpful not only for determining tumor size, but also for comparing with PET/CT images for co-registration.
Static PET/CT images of mice showed accumulation of [18F]FEL (Fig. 3) in the region of the pancreas where L3.6pl cells were injected to implant xenografts. The parameters set in the PET/CT scanner were not sensitive enough to get a clean image of the tumor by CT; therefore, MRI was used for additional support. In PET images, accumulation of [18F]FEL was seen in the region of the pancreas, where cells were injected, but the resolution was inadequate to differentiate between tumor and the peritumoral region. Previous study with [18F]FEDL yielded very similar imaging data, and accumulation of the tracer in the peritumoral tissue was established by autoradiography, not the PET image [18]. In the present study, we first used MRI to verify the size and position of the tumors shown on PET/CT and found that the locations of tumors on PET/CT and MR images were consistently matched. While axial PET/CT and MR images suggested that tracer accumulated near the tumor/peritumoral region, autoradiography was required to clearly differentiate between tumor and peritumoral tissue.
No radioactivity accumulated in the pancreas of the control (non–tumor-bearing) animals (Fig. 4). This indicated that [18F]FEL accumulates only in the tumor-bearing region of the pancreas. It further suggests that accumulation of [18F]FEL was associated with HIP/PAP expression, a finding that is consistent with those of a previous study [18].
Biodistribution results showed that accumulation of [18F]FEL in the peritumoral region was much greater (14-fold) in the tumor-bearing animals than in the control animals. Even though we assumed that there should be no accumulation of [18F]FEL in the region of tissue distant from the tumor of the tumor-bearing animals, some accumulation was evident. Since it is well known that HIP/PAP is overexpressed in the peritumoral tissue [7, 13] and that lactose derivatives bind with HIP/PAP, we attempted to separate tumor from the peritumoral tissue in the biodistribution study, but that was difficult. We were compelled to count radioactivity in tumor and peritumoral tissue together, and as a result the %ID/g was much lower than expected. However, about 80% of the total mass in the tumor/peritumoral tissue was due to tumor. Therefore, the %ID/g was calculated after subtracting the tumor mass and the average %ID/g was 1.29. A comparison between estimated uptake from the PET scan revealed that %ID/g by tissue sample counting and by image analysis are comparable. That the lowest accumulation of [18F]FEL was in the brain suggests that it does not cross blood-brain barrier. Accumulation of [18F]FEL in the peritumoral tissue was about 6-fold higher than in the blood, and much higher than all other organs except the kidney as would expected.
Because the imaging study was performed by static scanning, clearance of [18F]FEL from the blood was accomplished by manual blood sampling from mice injected with the radiotracer at multiple time points. Like other low-molecular-weight PET tracers, [18F]FEL cleared from the blood very quickly. Future studies should use dynamic PET scanning to more accurately derive the clearance curve.
The autoradiography showed that [18F]FEL accumulated in the peritumoral region and not in the tumor. Furthermore, ex vivo autoradiography and immunohistochemistry results suggest that binding of [18F]FEL was specific for the HIP/PAP expressed in the peritumoral region of the pancreas. These findings are consistent with results reported earlier for [18F]FEDL [18]. Therefore, our data suggest that the new tracer [18F]FEL has efficacy comparable to that of lactose derivative [18F]FEDL in detection of pancreatic cancer.
In summary, to overcome the synthetic complexity of [18F]FEDL, we developed a new radiotracer, [18F]FEL, that is simpler to produce and has a much higher yield [19, 20]. Here we report a preliminary study to determine its efficacy in detection of early-stage pancreatic cancer xenografts in mice using PET. The results suggest that [18F]FEL accumulated at the site or near the site where cancer cells were injected for development of xenografts. Although the PET/CT images did not clearly distinguish tumor from peritumoral pancreatic tissue, autoradiographic data confirmed that [18F]FEL, like [18F]FEDL, accumulated in the peritumoral region by binding with HIP/PAP, suggesting that [18F]FEL shows efficacy as a PET tracer in pancreatic cancer similar to that of [18F]FEDL. This proof-of-principle study comprising PET/CT imaging, autoradiography and biodistribution data suggests that [18F]FEL is a promising agent for detection of early-stage pancreatic cancer using PET, and these data warrant further studies.
Conclusion
[18F]FEL binds with the biomarker HIP/PAP and may be a useful radiotracer for non-invasive imaging of early-stage pancreatic tumor by PET.
Acknowledgments
This work was supported by the U.S. National Institutes of Health through the Cancer Center Core Support Grant to MD Anderson Cancer Center (CA016672) and by the Center for Advanced Biomedical Imaging developmental fund (to Drs. De Palatis and Alauddin).
Footnotes
Publisher's Disclaimer: This is a PDF file of an unedited manuscript that has been accepted for publication. As a service to our customers we are providing this early version of the manuscript. The manuscript will undergo copyediting, typesetting, and review of the resulting proof before it is published in its final citable form. Please note that during the production process errors may be discovered which could affect the content, and all legal disclaimers that apply to the journal pertain.
References
- 1.American Association for Cancer Research. Cancer Progress Report 2013. Philadelphia, PA: AACR; 2013. [Google Scholar]
- 2.American Cancer Society. Cancer Facts and Figures 2013. Atlanta, GA: American Cancer Society; 2013. [Google Scholar]
- 3.Koorstra JB, Hustinx SR, Offerhaus GJ, Maitra A. Pancreatic carcinogenesis. Pancreatology. 2008;8:110–25. doi: 10.1159/000123838. [DOI] [PMC free article] [PubMed] [Google Scholar]
- 4.Tsuchiya R, Tomiaka T, Izawa K, Noda T, Yamamoto K, Tsunoda T, et al. Collective review of small carcinomas of the pancreas. Ann Surg. 1986;203:77–81. doi: 10.1097/00000658-198601000-00013. [DOI] [PMC free article] [PubMed] [Google Scholar]
- 5.Yeo CJ, Cameron JL, Lillemoe KD, Sitzmann JV, Hruban RH, Goodman SN, et al. Pancreaticoduodenectomy for cancer of the head of the pancreas. Ann Surg. 1995;221:721–31. doi: 10.1097/00000658-199506000-00011. [DOI] [PMC free article] [PubMed] [Google Scholar]
- 6.Pakzad F, Groves AM, Ell PJ. The role of positron emission tomography in the management of pancreatic cancer. Semin Nucl Med. 2006;36:248–56. doi: 10.1053/j.semnuclmed.2006.03.005. [DOI] [PubMed] [Google Scholar]
- 7.Fukushima N, Koopmann J, Sato N, Prasad N, Carvalho R, Leach SD, et al. Gene expression alterations in the non-neoplastic parenchyma adjacent to infiltrating pancreatic ductal adenocarcinoma. Mod Pathol. 2005;18:779–87. doi: 10.1038/modpathol.3800337. [DOI] [PubMed] [Google Scholar]
- 8.Iovanna JL, Dagorn JC. The multifunctional family of secreted proteins containing a C-type lectin-like domain linked to a short N-terminal peptide. Biochim Biophys Acta. 2005;723:8–18. doi: 10.1016/j.bbagen.2005.01.002. [DOI] [PubMed] [Google Scholar]
- 9.Rosty C, Christa L, Kuzdzal CS, Balwin WM, Zahurak ML, Carnot F, et al. Identification of hepatocarcinoma–intestine–pancreas/pancreatitis-associated protein I as a biomarker for pancreatic ductal adenocarcinoma by protein biochip technology. Cancer Res. 2002;62:1868–75. [PubMed] [Google Scholar]
- 10.Gronborg M, Bunkenborg J, Kristiansen TZ, Jensen ON, Yeo CJ, Hruban RH, et al. Comprehensive proteomic analysis of human pancreatic juice. J Proteome Res. 2004;3:1042–55. doi: 10.1021/pr0499085. [DOI] [PubMed] [Google Scholar]
- 11.Christa L, Felin M, Morali O, Simon M-T, Lasserre C, Brechot C, et al. The human HIP gene, overexpressed in primary liver cancer, encodes a C-type carbohydrate binding protein with lactose binding activity. FEBS Lett. 1994;337:114–8. doi: 10.1016/0014-5793(94)80640-3. [DOI] [PubMed] [Google Scholar]
- 12.Graf R, Schiesser M, Reding T, Appenzeller P, Sun L-K, Fortunato F, et al. Exocrine meets endocrine: pancreatic stone protein and regenerating protein—two sides of the same coin. J Surg Res. 2006;133:113–20. doi: 10.1016/j.jss.2005.09.030. [DOI] [PubMed] [Google Scholar]
- 13.Demaugre F, Philippe Y, Sar S, Pileire B, Christa L, Lasserre C, et al. HIP/PAP, a C-type lectin overexpressed in hepatocellular carcinoma, binds the RII alpha regulatory subunit of cAMP-dependent protein kinase and alters the cAMP-dependent protein kinase signalling. Eur J Biochem. 2004;271:3812–20. doi: 10.1111/j.1432-1033.2004.04302.x. [DOI] [PubMed] [Google Scholar]
- 14.Drickamer K. C-type lectin-like domains. Curr Opin Struct Biol. 1999;9:585–90. doi: 10.1016/s0959-440x(99)00009-3. [DOI] [PubMed] [Google Scholar]
- 15.Lasserre C, Colnot C, Brechot C, Poirier F. HIP/PAP gene, encoding a C-type lectin overexpressed in primary liver cancer, is expressed in nervous system as well as in intestine and pancreas of the postimplantation mouse embryo. Am J Pathol. 1999;154:1601–10. doi: 10.1016/S0002-9440(10)65413-2. [DOI] [PMC free article] [PubMed] [Google Scholar]
- 16.Bormans G, Verbruggen A. Enzymatic synthesis and biodistribution in mice of β-O-D-galactopyranosyl-(1,4′)-2′-[18F]fluoro-2′-deoxy-D-glucopyranose (2′-[18F]fluorodeoxy-glucose) J Labelled Comp Radiopharm. 2001;44:417–23. [Google Scholar]
- 17.Ying Y, Ghosh P, Guo L, Pal A, Mukhapadhyay U, Peng Z, et al. Synthesis and ex vivo autoradiographic evaluation of ethyl-β-D-galactopyranosyl-(1,4′)-2′-deoxy-2′-[18F]fluoro-β-D-glucopyranoside, a novel radioligand for lactose-binding protein: Implications for early detection of pancreatic carcinomas with PET. Mol Imaging Biol. 2011;13:536–46. doi: 10.1007/s11307-010-0334-9. [DOI] [PubMed] [Google Scholar]
- 18.Flores L, Bertolini S, Yeh H, Young D, Mukhapadhyay U, Pal A, et al. Detection of pancreatic carcinomas by imaging lactose-binding protein expression in peritumoral pancreas using [18F]fluoroethyl-deoxylactose PET/CT. PLoSONE. 2009;4:e7977. doi: 10.1371/journal.pone.0007977. [DOI] [PMC free article] [PubMed] [Google Scholar]
- 19.Turkman N, Pal A, Tong W, Gelovani JG, Alauddin MM. Radiosynthesis of [18F]fluoroethyl-β-D-lactose ([18F]-FEL) for early detection of pancreatic carcinomas with PET. J Labelled Comp Radiopharm. 2011;54:233–8. [Google Scholar]
- 20.Turkman N, Gelovani JG, Alauddin MM. An improved synthesis of 1′-[18F]fluoroethyl-β-D-lactose ([18F]-FEL) for PET imaging of pancreatic cancer. J Labelled Comp Radiopharm. 2013;56:351–55. doi: 10.1002/jlcr.3042. [DOI] [PMC free article] [PubMed] [Google Scholar]
- 21.Paolillo V, De Palatis L, Alauddin MM. Optimization of precursor synthesis, formulation and stability of 1′-[18F]fluoroethyl-β-D-lactose ([18F]FEL) for preclinical studies in detection of pancreatic cancer. Nucl Med Biol. 2014 Jan 10; doi: 10.1016/j.nucmedbio.2014.01.002. pii: S0969–8051(14)00004-3. Epub ahead of print. [DOI] [PMC free article] [PubMed] [Google Scholar]
- 22.Nishii R, Volgin AY, Mawlawi O, Mukhopadhyay U, Pal A, Bornmann W, et al. Evaluation of 2′-deoxy-2′-[18F]fluoro-5-methyl-1-beta-L-arabinofuranosyluracil ([18F]-L-FMAU) as a PET imaging agent for cellular proliferation: comparison with [18F]-D-FMAU and [18F]FLT. Eur J Nucl Med Mol Imaging. 2008;35:990–8. doi: 10.1007/s00259-007-0649-1. [DOI] [PubMed] [Google Scholar]