Abstract
Bone has a hierarchical structure extending from the micrometer to the nanometer scale. We report here the first analysis of non-human primate osteonal bone obtained using a spectrometer coupled to an AFM-microscope (AFM-IR), with a resolution of 50–100 nm. Average spectra correspond to those observed with conventional FTIR spectroscopy. The following validated FTIR parameters were calculated based on intensities observed in scans covering ~60 µm from the osteon center: mineral content (1030 cm−1/1660 cm−1); crystallinity (1030 cm−1)/1020 cm−1), collagen maturity (1660 cm−1/1690 cm−1) and acid phosphate content (1128 cm−1/1096 cm−1). A repeating pattern was found in most of these calculated IR parameters corresponding to the reported inter- and intra-lamellar spacing in human bone, indicating that AFM-IR measurements will be able to provide novel compositional information on the variation in bone at the nanometer level.
Keywords: AFM-IR, nano-IR, bone composition, osteonal bone, bone nano-structure
Introduction
Bone chemical composition, bone morphology and bone geometry contribute to the strength and fracture resistance of bones [1]. Chemical composition changes in bone composition have been reported from Fourier Transform Infrared Imaging (FTIRI) [2–6] and Raman micro-imaging [7–11] at ~7 and 1µm spatial resolution, respectively. Micro-architectural differences may be observed at tenths of micron resolutions. Here we report one of the first studies using nanoscale spectroscopy to examine the variation in the chemical composition of bone at the nanometer level. This is the first report in which the spectra recorded with nanometer spatial resolution are not distorted, making characterization and mapping simpler procedures.
There is one previous report of nanoscale IR spectroscopy of bone based on scattering scanning near-field optical microscopy (s-SNOM) coupled with FTIR spectroscopy [12]. The s-SNOM IR methodology produced spectra that are shifted by variable amounts to higher or lower wavenumbers, at times by as much as 12 cm−1, making the published data on bone and shell minerals difficult to interpret, despite the reported spatial resolution of 20 nm. Here we use an atomic force microscope (AFM) to directly detect the IR absorbance with a spatial resolution of 50–100 nm. The AFM-IR instrumentation used couples a continuously tunable pulsed laser source to an atomic force microscope (AFM), where wavelength-dependent absorption in the sample results in local thermal expansion, sensed using the sharp tip of an AFM cantilever [13]. This instrument has been used previously to study polyethylene at a resolution of 15nm [14]. This preliminary report details the application of this instrument to the study of a non-human primate osteon at 50–100 nm spatial resolution. The spatial resolution is ultimately limited by the tip sharpness, and also affected by the thickness and thermal diffusion properties of the sample, which should not vary significantly within a given sample section [15, 16].
Materials and Methods
Osteon Preparation
One femur from a 13 year old baboon described previously [17] was used to perform this pilot study. The animal was from the colony at the Southwest National Primate Research Center/Southwest Foundation for Biomedical Research (SNPRC/SFBR, San Antonio, TX) and all procedures during its life at SNPRC/SFBR were approved by the Institutional Animal Care and Use Committee in accordance with established guidelines. The details of bone preparation, routinely used in most laboratories, have been reviewed elsewhere [17]. In brief, femurs were collected during routine necropsies, wrapped in saline-soaked gauze and maintained in frozen storage at −20 °C; bones were initially fixed with 80% ethanol (EtOH), slowly dehydrated through a series of increasing concentrations of EtOH, cleared with xylene and finally infiltrated and embedded in polymethylmethacrylate (PMMA) using the Erben method [18]. It was demonstrated that this standard protocol does not affect the mineral composition at 6–7µm resolution [19].
AFM-IR Analysis
For the AFM-IR analysis 4 sections each, 0.5 µm thick, were cut horizontally from the embedded undecalcified bone block using a Reichert Jung Ultracut E ultramicrotome (Vienna, Austria) equipped with a diamond knife (Diatome Ltd., Bienne, Switzerland). These sections were then transferred onto ZnSe prism and mounted onto the sample stage of the nanoIR™ AFM-IR instrument (Anasys Instruments, Santa Barbara, CA). Data were obtained in contact mode with an Arrow cantilever (Arrow-FM, NanoWorld, Switzerland). A typical cantilever frequency of 300 KHz was used for signal detection with a frequency window of 50 KHz. Analysis Studio software (version 3.6.4695, Anasys Instruments, Santa Barbara, CA) was used for data collection and analysis. The tunable IR laser produced laser pulses of 10 ns at a repetition rate of 1 KHz, with a spectral resolution of better than 8 cm−1 over the whole tuning range. The IR power levels incident on the ZnSe was about 0.5 mW, and the focused laser spot size was about 50 µm. With this configuration (IR laser, cantilever and tip) the spatial resolution can reach 50–100 nm. The AFM-IR spectra were collected over a range of 900 – 1800 cm−1, with a spectral resolution of 4 cm−1 and an accumulation of 128 scans for each data point. IR absorption images at 1030 and 1660 cm−1 were collected at a scan rate of 0.05 Hz, with an accumulation of 16 scans at each position. The 60 µm × 10 µm image size corresponds to an array of 600 × 50 measurements. The ratio image was constructed by dividing the intensities of the image at 1030 cm−1 by those at 1660 cm−1.
Data Processing
Data was collected from multiple osteons in 4 different tissue sections. To study the chemical composition changes at various distances from the bone osteon center, we used the same intensity ratio parameters that had been published for FTIRI [4,17], and included the intensity ratio of 1030 cm−1/1660 cm−1 to assess mineral to matrix ratio, previously measured as a peak area ratio in FTIRI.
Results
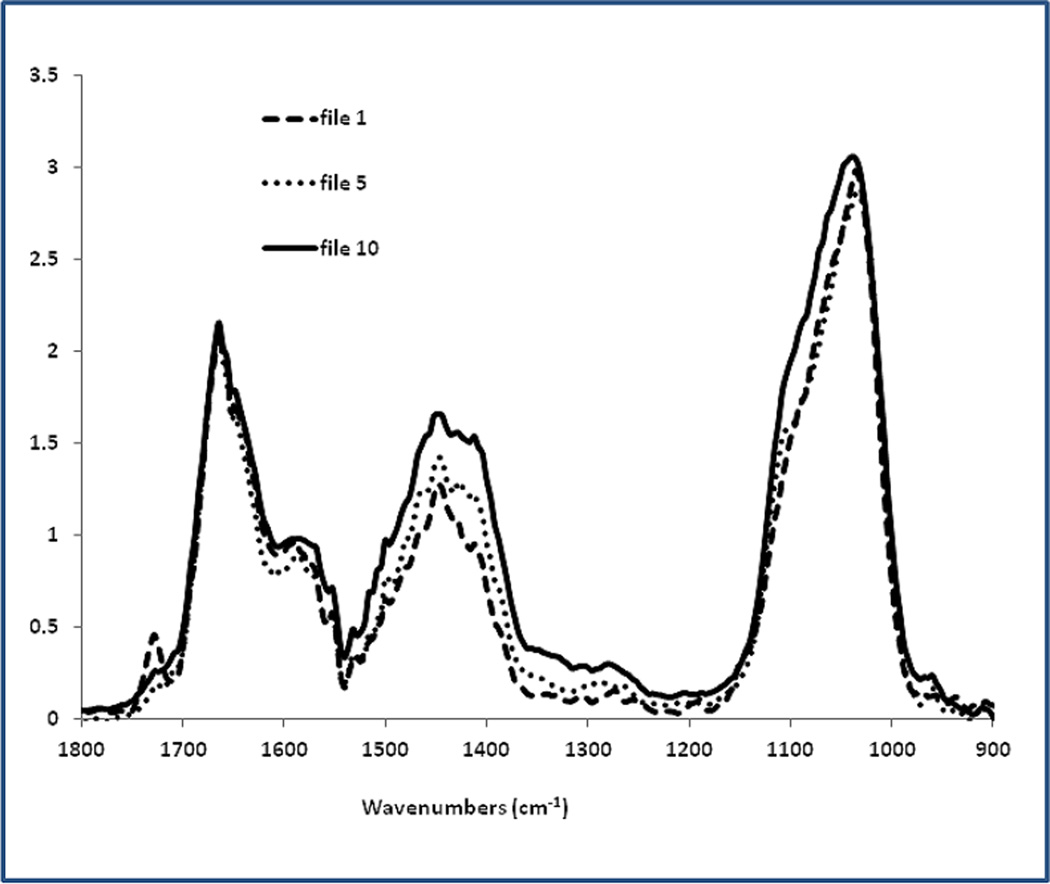
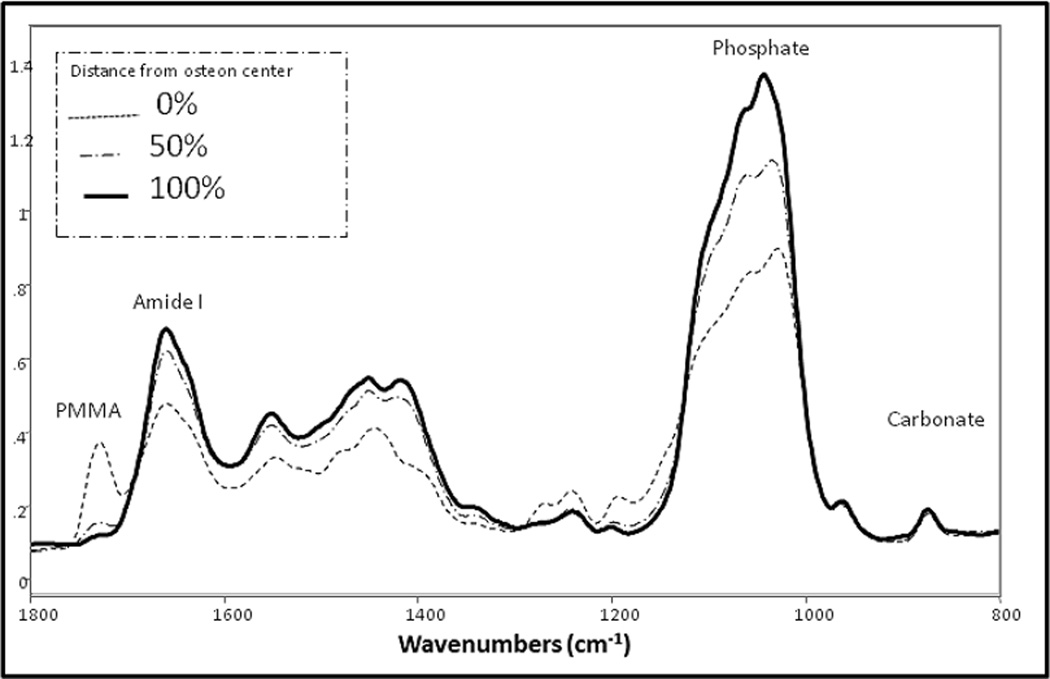
The merged spectra from the nano-IR (Figure 1A) were not visibly different from the averaged spectra recorded previously [17] using FTIR-imaging from the same bone samples (Figure 1B). AFM-IR spectrum in Fig. 1A shows all the major absorption features including amide and phosphate bands as seen in the FTIR spectrum in Fig. 1B. Most significantly peaks were not shifted and occurred at the expected locations. Slight alterations in phosphate and protein band shapes in the AFM-IR compared to the FTIR can be noted, which may occur due to the fact that the AFM-IR spectra are averaging over far fewer conformational states than the FTIR spectra, which average roughly 100-times more area of the sample.
Fig. 1.
Comparison of bone spectra obtained by: (A) AFM-IR and (B) conventional FTIRI. (A) Each spectrum is the average of 10 raw spectra 20 nm apart, with 3-point smoothing, scaled to the Amide I band (1660 cm−1). Smoothing is useful, as AFM-IR spectra are generated from IR absorption of very small amounts of material at nanometer scale, resulting in lower S/N ratio than conventional FTIR. Representative files are shown. File 1 is at the edge of the Haversian canal. File 5 and 10 are 20 and 45 µm away, respectively. Note the PMMA band (1729cm−1) in file 1, which is adjacent to the osteon center. (B) FTIR spectra of an osteon in the same tissue section as the osteon in Figure 1A. The correspondence of the spectra in A and B is apparent. The FTIR image in (B) was scanned with the following parameter: spectral resolution 4cm−1, spatial resolution 6.25 µm and 4 scans accumulation in the range 2000–800cm−1.
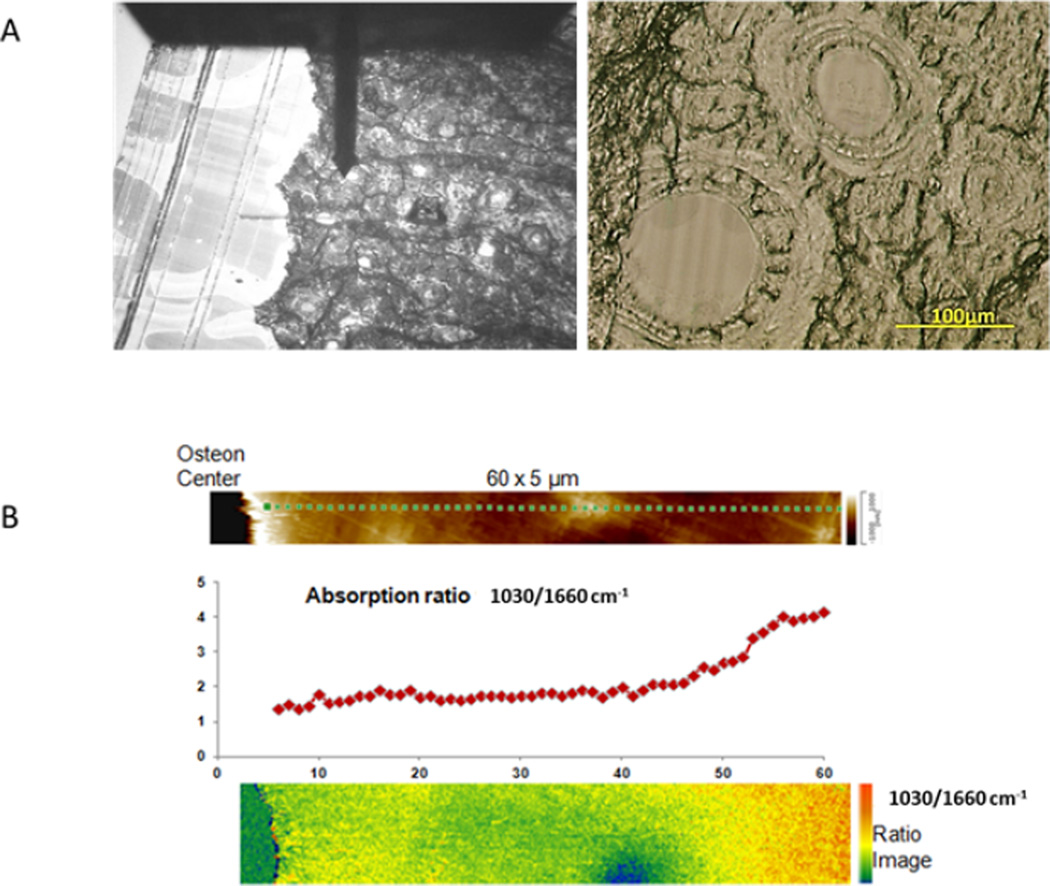
A typical bone sample, showing the AFM probe and several osteons is seen in figure 2A. Figure 2B shows the 60×5 µm area scanned in one osteon, a plot of the maximum phosphate intensity (1030 cm−1) over the maximum amide I intensity (1660 cm−1) and the image of that calculated ratio. This ratio increases as a function of distance from the osteon center. There is a slightly elevated mineral to amide I content adjacent to the osteon center.
Fig. 2.
AFM-IR Images of the osteon. A: Image of the osteon as seen through the AFM-IR with the probe resting at the center of the osteon. A bright field image of two of the osteons in the section is seen in the adjacent image. B: the AFM map of 60 um from the osteon center, a graph showing the variation in the intensity ratio of 1030/1660, and a colorized image of that ratio.
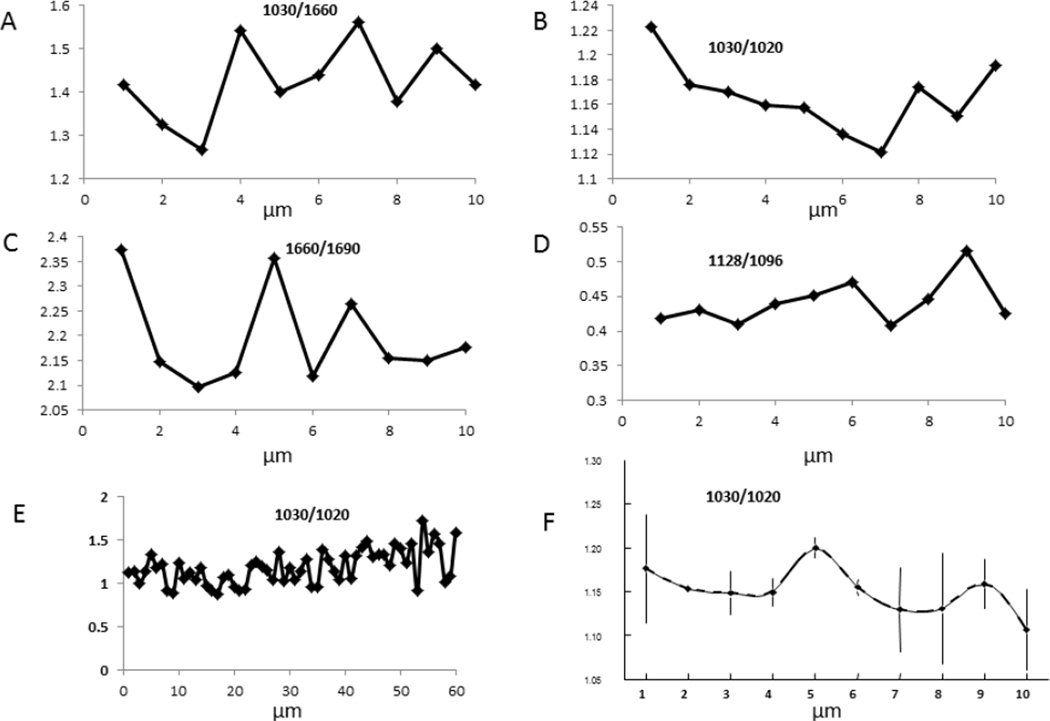
Line scans were used to map the variation in parameters from the center of the osteon (point 0) to its edge, or to other variable distances. Line scans for parameters derived and validated earlier from FTIRI [17,20] are shown for the first 10 micrometers in Figure 3 for mineral/matrix ratio, crystallinity, collagen maturity, and acid phosphate content. Note the periodicity (~2–4 µm) of the data in many of the figures represented by a single line. The S/N of the data was significantly smaller than these variations. A similar, but less obvious periodicity was suggested in the 60 micrometer mineral/matrix scan in figure 2B. Figure 3F shows the average of 2 lines in 2 different osteons for the 1030 cm−1/1020 cm−1 ratio. These data coming from osteons of different tissue ages, as estimated by osteon diameter and number of visible concentric circles, suggest the reproducibility of the method, and the various values that may arise from the osteonal tissue, irrespective of animal age.
Fig. 3.
Periodic variation of parameters observed by AFM-IR at a higher resolution than shown in Figure 2: the first 10 µm from the osteon center for A) mineral content, B) crystallinity, C) collagen maturity, and D) Acid phosphate substitution. Figure E shows the variation that is noted in crystallinity for 60 um beginning at the osteon center using the same spectral data as in Fig. 2B. Figure F shows reproducibility from spectra from two separate osteons in different sections, error bars are SD for multiple measurements. The same repeating pattern (periodicity) noted in individual osteons can be seen.
Discussion
The data in this preliminary report was obtained using sections from a single baboon bone that was previously analyzed as part of an investigation of age-dependent changes in osteons from animals of different ages [17]. Results are presented to show the consistency of the spectra obtained by AFM-IR and the reproducibility of the patterns obtained. There are some intriguing observations in these preliminary data. First, the elevated mineral content adjacent to the osteon center suggests either a mineral accumulation prior to matrix maturation or that the matrix is not tightly associated with the mineral during initial mineral deposition or that an artifact not noted using standard FTIRI has occurred. Two types of artifact are possible: i) A sectioning artifact in which the knife slides from the Haversian canal (just embedding material) into the sparsely mineralized tissue, compressing the tissue and thus producing an apparent elevated mineral/matrix ratio, or (ii) a chemical artifact, in which mineral dissolved during aqueous processing reprecipitates on the available matrix during processing in organic solvents. The chemical artifact seems unlikely as it was not seen in the calvaria [19].
The sectioning artifact is also unlikely as the increased ratio was noted on all four sides of the Haversian canal. Further studies with osteons from different aged animals using different knives and different processing times and reagents should help determine which of these possibilities is the case.
Second, the repeating pattern of 2–4 microns in the immature baboon osteon is reminiscent of the TEM reports of this same distance repeat for human interlamellar bone [21,22]. Additional analysis of multiple osteons in samples of different ages will be required to confirm this periodicity.
There is an additional intriguing possibility. Using nano-resolution AFM-IR, it will be possible to document the variations in chemical composition of inter- and intra-lamellar bone; which to date has only been evaluated by staining at the TEM level [23,24]. Controversies regarding the relative amounts of collagen and mineral in these histologically different regions can be addressed by AFM-IR.
It is important to point out that the high spatial resolution of the AFM-IR technique is due to the fact that the AFM tip high frequency vibration amplitude is sensitive to the speed of the surface displacement when the sample absorbs the laser, rather than by the displacement itself. Therefore, only IR absorption near the AFM tip contributes significantly to the AFM-IR signal. [15], thus concerns that elastic deformation fields excited by the laser might propagate over large distances be sensed by the AFM tip, although the photons were absorbed a micron or more away from the tip, can be dismissed.
These preliminary data indicate that AFM-IR can be used in the future to map changes in bone mineral composition both in normal and diseased bones. Additionally, mapping drug effects, mapping changes in ligament and tendon insertions, as was done using standard FTIR imaging [25–27], and mapping changes in vascular tissues and teeth, also reported by standard FTIR imaging [28,29] will provide further opportunities for the optimization and utilization of this technique.
Acknowledgements
Data for this study was collected at Anasys Instruments, Santa Barbara, CA. The study was supported by NIH grant AR041325. The authors are grateful to Dr. Judah Gerstein for editing the manuscript.
Footnotes
Conflict of interest
Curt Marcott is a scientific advisor for Anasys Instruments; Qichi Hu is an employee of Anasys Instruments; Samuel Gourion-Arsiquaud and Adele Boskey have no conflicts of interest.
References
- 1.Bouxsein ML, Seeman E. Quantifying the material and structural determinants of bone strength. Best Pract Res Clin Rheumatol. 2009;23:741–753. doi: 10.1016/j.berh.2009.09.008. [DOI] [PubMed] [Google Scholar]
- 2.Gourion-Arsiquaud S, Allen MR, Burr DB, Vashishth D, Tang SY, Boskey AL. Bisphosphonate treatment modifies canine bone mineral and matrix properties and their heterogeneity. Bone. 2010;46:666–672. doi: 10.1016/j.bone.2009.11.011. [DOI] [PMC free article] [PubMed] [Google Scholar]
- 3.Boskey AL, Spevak L, Weinstein RS. Spectroscopic markers of bone quality in alendronate-treated postmenopausal women. Osteoporos Int. 2009;20:793–800. doi: 10.1007/s00198-008-0725-9. [DOI] [PMC free article] [PubMed] [Google Scholar]
- 4.Donnelly E, Meredith DS, Nguyen JT, Gladnick BP, Rebolledo BJ, Shaffer AD, Lorich DG, Lane JM, Boskey AL. Reduced cortical bone compositional heterogeneity with bisphosphonate treatment in postmenopausal women with intertrochanteric and subtrochanteric fractures. J Bone Miner Res. 2012;27:672–678. doi: 10.1002/jbmr.560. [DOI] [PMC free article] [PubMed] [Google Scholar]
- 5.Gourion-Arsiquaud S, Lukashova L, Power J, Loveridge N, Reeve J, Boskey AL. Fourier transform infrared imaging of femoral neck bone: reduced heterogeneity of mineral-to-matrix and carbonate-to-phosphate and more variable crystallinity in treatment-naive fracture cases compared with fracture-free controls. J Bone Miner Res. 2013;28:150–161. doi: 10.1002/jbmr.1724. [DOI] [PMC free article] [PubMed] [Google Scholar]
- 6.Bala Y, Farlay D, Chapurlat RD, Boivin G. Modifications of bone material properties in postmenopausal osteoporotic women long-term treated with alendronate. Eur J Endocrinol. 2011;165:647–655. doi: 10.1530/EJE-11-0333. [DOI] [PubMed] [Google Scholar]
- 7.Zoehrer R, Roschger P, Paschalis EP, Hofstaetter JG, Durchschlag E, Fratzl P, Phipps R, Klaushofer K. Effects of 3- and 5-year treatment with risedronate on bone mineralization density distribution in triple biopsies of the iliac crest in postmenopausal women. J Bone Miner Res. 2006;21:1106–1112. doi: 10.1359/jbmr.060401. [DOI] [PubMed] [Google Scholar]
- 8.Juillard A, Falgayrac G, Cortet B, Vieillard MH, Azaroual N, Hornez JC, Penel G. Molecular interactions between zoledronic acid and bone: An in vitro Raman microspectroscopic study. Bone. 2010;47:895–904. doi: 10.1016/j.bone.2010.07.018. [DOI] [PubMed] [Google Scholar]
- 9.Misof BM, Roschger P, Gabriel D, Paschalis EP, Eriksen EF, Recker RR, Gasser JA, Klaushofer K. Annual intravenous zoledronic acid for three years increased cancellous bone matrix mineralization beyond normal values in the HORIZON biopsy cohort. J Bone Miner Res. 2013;28:442–448. doi: 10.1002/jbmr.1780. [DOI] [PubMed] [Google Scholar]
- 10.McCreadie BR, Morris MD, Chen TC, Sudhaker Rao D, Finney WF, Widjaja E,Goldstein SA. Bone tissue compositional differences in women with and without osteoporotic fracture. Bone. 2006;39:1190–1195. doi: 10.1016/j.bone.2006.06.008. [DOI] [PubMed] [Google Scholar]
- 11.Akkus O, Adar F, Schaffler MB. Age-related changes in physicochemical properties of mineral crystals are related to impaired mechanical function of cortical bone. Bone. 2004;34:443–453. doi: 10.1016/j.bone.2003.11.003. [DOI] [PubMed] [Google Scholar]
- 12.Amarie S, Zaslansky P, Kajihara Y, Griesshaber E, Schmahl WW, Keilmann F. Nano-FTIR chemical mapping of minerals in biological materials. Beilstein J Nanotechnol. 2012;3:312–323. doi: 10.3762/bjnano.3.35. [DOI] [PMC free article] [PubMed] [Google Scholar]
- 13.Kjoller K, Felts JR, Cook D, Prater CB, King WP. High-sensitivity nanometer-scale infrared spectroscopy using a contact mode microcantilever with an internal resonator paddle. Nanotechnology. 2010;21:185–705. doi: 10.1088/0957-4484/21/18/185705. [DOI] [PubMed] [Google Scholar]
- 14.Felts JR, Cho H, Yu MF, Bergman LA, Vakakis AF, King WP. Atomic force microscope infrared spectroscopy on 15 nm scale polymer nanostructures. Rev Sci Instrum. 2013;84:023709. doi: 10.1063/1.4793229. [DOI] [PubMed] [Google Scholar]
- 15.Dazzi A, Prazeres R, Glotin F, Ortega JM. Local infrared microspectroscopy with subwavelength spatial resolution with an atomic force microscope tip used as a photothermal sensor. Opt Lett. 2005;30:2388–2390. doi: 10.1364/ol.30.002388. [DOI] [PubMed] [Google Scholar]
- 16.Dazzi A, Prater DB, Hu Q, Chase DB, Rabolt JF, Marcott C. Combining Atomic Force Microscopy and Infrared Spectroscopy for Nanoscale Chemical Characterization. Applied Spectroscopy. 2012;66:1365–1384. doi: 10.1366/12-06804. [DOI] [PubMed] [Google Scholar]
- 17.Gourion-Arsiquaud S, Burket JC, Havill LM, DiCarlo E, Doty SB, Mendelsohn R, van der Meulen MC, Boskey AL. Spatial variation in osteonal bone properties relative to tissue and animal age. J Bone Miner Res. 2009;24:1271–1281. doi: 10.1359/JBMR.090201. [DOI] [PMC free article] [PubMed] [Google Scholar]
- 18.Erben RG. Embedding of bone samples in methylmethacrylate: an improved method suitable for bone histomorphometry, histochemistry, and immunohistochemistry. J Histochem Cytochem. 1997;45:307–313. doi: 10.1177/002215549704500215. [DOI] [PubMed] [Google Scholar]
- 19.Aparicio S, Doty SB, Camacho NP, Paschalis EP, Spevak L, Mendelsohn R, Boskey A. Optimal methods for processing mineralized tissues for Fourier transform infrared microspectroscopy. Calcif Tissue Int. 2002;70:422–429. doi: 10.1007/s00223-001-1016-z. [DOI] [PubMed] [Google Scholar]
- 20.Spevak L, Flach CR, Hunter T, Mendelsohn R, Boskey A. Fourier transform infrared spectroscopic imaging parameters describing acid phosphate substitution in biologic hydroxyapatite. Calcif Tissue Int. 2013;92:418–428. doi: 10.1007/s00223-013-9695-9. [DOI] [PMC free article] [PubMed] [Google Scholar]
- 21.Giraud-Guille M. Twisted plywood architecture of collagen fibrils in human compact bone osteons. Calcif Tissue Int. 1988;42:167–180. doi: 10.1007/BF02556330. [DOI] [PubMed] [Google Scholar]
- 22.Weiner S, Traub W, Wagner HD. Lamellar bone structure-function relations. J Struct Biol. 1999;126:241–255. doi: 10.1006/jsbi.1999.4107. [DOI] [PubMed] [Google Scholar]
- 23.Rubin MA, Jasiuk I. The TEM characterization of the lamellar structure of osteoporotic human trabecular bone. Micron. 2005;36:653–664. doi: 10.1016/j.micron.2005.07.010. [DOI] [PubMed] [Google Scholar]
- 24.Marotti G, Ferretti M, Palumbo C. The problem of bone lamellation: an attempt to explain different proposed models. J Morphol. 2013;274:543–550. doi: 10.1002/jmor.20114. [DOI] [PubMed] [Google Scholar]
- 25.Gourion-Arsiquaud S, Allen MR, Burr DB, Vashishth D, Tang SY, Boskey AL. Bisphosphonate treatment modifies canine bone mineral and matrix properties and their heterogeneity. Bone. 2010;46:666–672. doi: 10.1016/j.bone.2009.11.011. [DOI] [PMC free article] [PubMed] [Google Scholar]
- 26.Paschalis EP, Glass EV, Donley DW, Eriksen EF. Bone mineral and collagen quality in iliac crest biopsies of patients given teriparatide: new results from the fracture prevention trial. J Clin Endocrinol Metab. 2005;90:4644–4649. doi: 10.1210/jc.2004-2489. [DOI] [PubMed] [Google Scholar]
- 27.Spalazzi JP, Boskey AL, Pleshko N, Lu HH. Quantitative mapping of matrix content and distribution across the ligament-to-bone insertion. PLoS One. 2013;8:e74349. doi: 10.1371/journal.pone.0074349. [DOI] [PMC free article] [PubMed] [Google Scholar]
- 28.Lattermann A, Matthäus C, Bergner N, Beleites C, Romeike BF, Krafft C, Brehm BR, Popp J. Characterization of atherosclerotic plaque depositions by Raman and FTIR imaging. J Biophotonics. 2013;6:110–121. doi: 10.1002/jbio.201200146. [DOI] [PubMed] [Google Scholar]
- 29.Boskey AL, Verdelis K, Spevak L, Lukashova L, Beniash E, Yang X, Cabral WA, Marini JC. Mineral and matrix changes in Brtl/+ teeth provide insights into mineralization mechanisms. Biomed Res Int. 2013;2013:295–812. doi: 10.1155/2013/295812. [DOI] [PMC free article] [PubMed] [Google Scholar]


