

Abstract
Over the past decade, laser capture microdissection (LCM) has grown as a tool for gene expression profiling of small numbers of cells from tumor samples and of specific cell populations in complex tissues. LCM can be used to study toxicant effects on selected cell populations within the testis at different stages of spermatogenesis. There are several LCM-related hurdles to overcome, including issues inherent to the method itself, as well as biases that result from amplifying the LCM-isolated RNA. Many technical issues associated with the LCM method are addressed here, including increasing RNA yield and obtaining more accurate quantification of RNA yields. We optimized the LCM method optimized to generate RNA quantities sufficient for qRT-PCR array analysis without amplification, and were able to validate the method through direct comparison of results from unamplified and amplified RNA from individual samples. The addition of an amplification step for gene expression studies using LCM RNA resulted in a bias, especially for low abundance transcripts. Although the amplification bias was consistent across samples, researchers should use caution when comparing results generated from amplified and unamplified LCM RNA. Here we have validated the use of LCM-derived RNA with the qRT-PCR array, improving our ability to investigate cell-type and stage-specific responses to toxicant exposures.
Keywords: laser capture microdissection, testis, amplification, PCR array
Introduction
Laser capture microdissection (LCM) is a useful technique for isolating populations of cells and subsequently their DNA, RNA, and protein (Cheng et al. 2013; Emmert-Buck et al. 1996). It is used in molecular profiling of diseases, isolation of small populations of cells from large tissues (i.e., Kupffer cells from the liver (Gehring et al. 2009)), and examination of cell-type specific toxicant responses (Campion et al. 2010b; Sluka et al. 2008). Characteristically, LCM is used to capture small numbers of cells for RNA isolation and subsequent amplification in transcriptomic analyses (Subkhankulova and Livesey 2006). The amplification of LCM material is generally a necessity due to the extensive amount of time required to perform LCM to obtain ng amounts of RNA for each sample. Optimization of the LCM method has been the focus of many efforts and has included factors such as the proper selection of consumables and staining reagents, tissue handling, and extraction methods, all to maximize both the quantity and quality of isolated RNA from LCM sections (Sluka et al. 2008). Optimization efforts have extended to the examination of various amplification methods and gene expression platforms, and the different biases these may introduce.
LCM isolation of cell populations is a highly manipulated process that generates additional questions, including whether amplification bias occurs and where bias originates (Caretti et al. 2008; Duftner et al. 2008; Lang et al. 2009; Mazurek et al. 2013; Nygaard et al. 2003). Researchers have compared the use of pooled LCM RNA with different array platforms (Affymetrix U133 plus 2.0 vs. X3P arrays) and different amplification methods (NuGen vs. Arcturus) and have found minimal differences between the methods (Caretti et al. 2008). Also, unamplified and amplified RNA have been compared using several amplification techniques and varying sub-nanogram input concentrations of intact total RNA, and found that arrays with unamplified RNA had higher Pearson’s correlations than amplified RNA in an unprocessed dataset (Lang et al. 2009). Utilizing RNA amplification techniques with downstream gene analysis is useful for highly expressed genes, but decreases the absolute discovery rate (Lang et al. 2009). Furthermore, amplification techniques introduce biases into downstream applications and reduce the signal-to-noise ratio (Lang et al. 2009), making it difficult to discern subtle changes in gene expression responses. Mazurek et al. (2013) identified an amplification-dependent bias, where the method used resulted in a large number of probe sets with significant expression differences between LCM-derived and whole tissue samples. Here, we validated the use of qRT-PCR arrays with LCM-derived material and examined the effect of amplification on LCM-derived RNA. The comparison of unamplified and amplified versions of the same LCM-derived sample, allowed for the direct examination of amplification influence on qRT-PCR array data from LCM-derived RNA.
The testis is a complex organ, with multiple cell types (Sertoli, Leydig, and germ cells) and many varying stages of spermatogenesis depending on the organism. This complexity is compounded when the testicular toxic effects of chemical mixtures are studied. The use of the model germ and Sertoli cell specific toxicants, X-irradiation (x-ray) and 2,5-hexanedione (HD), respectively, can be useful in the investigation of co-exposure effects on spermatogenesis because their effects have been well characterized. In previous high dose studies, the germ cell apoptosis induced by x-ray exposure appears to be attenuated when there is a priming exposure to HD (Campion et al. 2010a; Campion et al. 2010b; Yamasaki et al. 2010). Certain stages of spermatogenesis are more susceptible to particular toxicants, as illustrated by Hasegawa et al.(Hasegawa et al. 1997), who found that a greater number of spermatogonia undergo apoptosis following x-ray exposure during stages I–VI of spermatogenesis, when compared to other stages. This stage-specific effect of toxicant exposure on a few genes involved in the apoptosis of germ cells was studied further through LCM by Campion et al. (Campion et al. 2010b). They found that when the diluting effect of non-affected cell types was removed, the apoptotic effects of the toxicants on germ cells was much greater than had previously been realized. The dilution of gene expression effects in whole tissues vs. LCM-derived cells becomes more apparent when the subtle effects of low-dose exposures are studied. LCM is required to overcome these complexities associated with the use of multicellular tissues and multiple exposure scenarios in broad gene expression studies.
Here, LCM was applied to study cell types that are targeted by specific toxicants to overcome the attenuation effect that occurs when studying a small subset of cells within a complex multicellular organ (Leblond and Clermont 1952; Moffit et al. 2007). LCM material was used in conjunction with a qRT-PCR array platform to enhance our ability to detect small gene changes in low-dose exposures across an entire pathway, which would otherwise be lost within the inherent noise of whole genome array studies. Here we address many of the LCM-associated technical hurdles to ultimately increase RNA yield and maximize the utility of LCM. This optimized and streamlined LCM method generated RNA quantities sufficient for qRT-PCR array analysis without amplification, so that we could directly compare results from the use of both unamplified and amplified RNA. The effect of amplification on LCM RNA was examined within samples and across multiple genes, to identify potential biases caused by RNA input concentrations used in the amplification process. It was found that there are highly variable amplification rates across several different transcripts on the qRT-PCR array used, but the within-gene amplification was consistent across samples. These data indicate that if comparisons are to be made between unamplified and amplified material, they should be made with caution.
Materials and methods
Animals
Adult male Fischer 344 rats (200 - 250 g) were purchased from Charles River Laboratories (Wilmington, MA). Upon arrival, rats were acclimated for one week and maintained in a temperature and humidity controlled environment with a 12 hr alternating dark-light cycle. All rats were housed in community cages with free access to water and Purina Rodent Chow 5001 (Farmer’s Exchange, Framingham, MA). The Brown University Institutional Animal Care and Use Committee approved all experimental animal protocols in compliance with National Institute of Health guidelines.
Toxicant exposure
Animals were exposed using an established treatment protocol (Markelewicz et al. 2004; Yamasaki et al. 2010) to 2,5-hexanedione (HD) in the drinking water for 18 days as a 0.33% solution. Animals were subsequently exposed to 2 Gy caudal half-body radiation on the 17th day of HD exposure, at a dose rate of 0.31 Gy/min using a RT 250 Philips kVp x-irradiation (x-ray) machine (Philips, Hamburg, Germany). At 3 hrs following irradiation, the rats were euthanized by CO2 asphyxiation and testes were collected and immediately embedded in optimal cutting temperature (OCT) compound (Sakura Finetek, Torrance, CA) as described previously (Yamasaki et al. 2010). Only the testis tissue from four animals (two control and two HD + x-ray) of a larger study were chosen randomly for this study, due to the length of time that was required to generate enough LCM RNA without an amplification step.
Laser capture microdissection (LCM) and RNA isolation
The LCM method detailed below was optimized for several factors, resulting in a method that could generate enough RNA for use with qRT-PCR arrays without the use of an amplification step. The staining procedure was optimized to obtain better histology, since a cover slip cannot be used with the LCM method. These staining optimizations included the use of a dilute stain solution and a reduction in the amount of time the slides were dehydrated with xylene. In addition, we tested several RNA extraction methods to determine which yielded the greatest amount of high-quality RNA. The addition of multiple LCM cap films to the RNA extraction buffer removed multiple RNA extractions steps, which saved on overall time required and further increased RNA yield. The number of slides to capture for each biological replicate was increased to obtain approximately 350 ng of LCM-derived RNA, enough for qRT-PCR array analysis. These optimizations were streamlined into the following detailed method, which takes less time compared to traditional LCM methods to generate the same amount of RNA.
Frozen embedded testis tissue was sectioned at 10 μm and bonded to the slide by allowing it to briefly melt and then quickly re-freeze. Slides were kept on dry ice until fixation in 75% ethanol for 30 sec. Slides were stained, in groups of 4, for 30 sec in a 0.075% staining solution of Arcturus Histogene Staining Solution (Applied Biosystems, Carlsbad, CA, USA). After a 30 sec wash step with nuclease free water, slides were moved quickly through the following dehydration steps: 75% ethanol for 30 sec, 95% ethanol for 30 sec, 2x 100% ethanol for 1 min and xylene for 1 min. The slides were air dried for 5 min in a hood before use.
The PixCell IIe Laser Microdissection System (Arcturus Bioscience, Inc.) was used to perform LCM according to the manufacturer’s manual. The seminiferous tubules with spermatogenesis stages I–VI were identified and the seminiferous tubule peripheral cell layers, which mainly included Sertoli cells, spermatogonia, and spermatocytes, were captured as previously described (Campion et al. 2010b)(Figure 2A–2C). These stages were chosen due to the higher percentage of x-ray sensitive spermatogonia and because of previous research, which has shown that these stages have a higher incidence of apoptosis than other spermatogenesis stages (Yamasaki et al. 2010). The cap was removed from the slide and the polymer film was carefully peeled off from the edge with a pair of forceps and placed on ice in 600 μl lysis/binding buffer included in the Ambion mirVana kit (Life Technologies, Grand Island, NY). This process was repeated until all 12 slides of the biological replicate had been completed and the polymer films from each cap of the 12 individual slides were added to the lysis/binding buffer. RNA was isolated from the lysis/binding buffer containing the 12 cap films for each biological replicate using the manufacturer’s protocol (2011 version) for the mirVana kit, from step D.2 to step F.I.5 (where indicated, for tissue) and RNA was eluted with nuclease-free water. The above process was repeated seven times for the same biological replicate to increase RNA yield following the combination and concentration of these replicates, as detailed in the next section.
Figure 2.

Micrograph of an intact rat seminiferous tubule before LCM (A), the remaining tissue following LCM (B), and the isolated tissue on the LCM cap (C). Scale bar is 50 μm.
RNA concentration was determined in triplicate for each of the seven biological replicates using the low-range protocol detailed by Invitrogen’s QuantiT Ribogreen Assay kit (Life Technologies, Grand Island, NY) and exhibited an improvement in quality, as assessed by RNA integrity number (RIN) number from 2100 Bioanalyzer (Agilent, Santa Clara, CA) (Figure 3A–3C). To conserve the amount of RNA for each sample, RNA quality was assessed for two randomly selected sample replicates before RNA concentration, using the 2100 Bioanalyzer (Agilent, Santa Clara, CA), according to the manufacturer’s instructions (2010 version).
Figure 3.

LCM-derived seminiferous tubule RNA quality assessment. Digital gel (A) and electropherogram results (B–C) obtained with the Agilent 2100 Bioanalyzer. Electropherogram results are shown for before (B) and after (C) DNase treatment and RNA concentration, with RINs of 5.40 and 6.50, respectively.
DNase treatment and RNA concentration
The seven LCM RNA biological replicates were individually DNase treated according to manufacturer’s instructions (Qiagen, Valencia, CA, USA), then combined and concentrated during RNA cleanup according to the protocol detailed by Qiagen’s RNeasy MinElute Kit, with a few exceptions; after the addition of buffer RLT and 100% ethanol to each of the seven biological replicates, they were added to the column sequentially. RNA was eluted from the column with 14 μl of nuclease-free water. RNA concentration was determined for each sample in duplicate using the high-range protocol detailed by Invitrogen’s Quant-iT Ribogreen Assay kit (Life Technologies, Grand Island, NY).
qRT-PCR arrays and analysis
To assess the utility of LCM-derived RNA, we measured the response of genes across a qRT-PCR array platform, using the RT2 Profiler PCR Array System (SABiosciences, Valencia, CA) for apoptosis pathway related genes identified in the rat. Complementary DNA (cDNA) was synthesized from 240 ng of LCM cell-specific RNA using the RT2 First Strand kit (Qiagen) according to the manufacturer’s protocol. To perform a PCR based pre-amplification of the genes that are present on the qRT-PCR array, the RT2 PreAmp cDNA Synthesis Primer Mix (Qiagen) was utilized with 14 ng of input RNA according to the manufacturer’s protocol (2012 version). Each sample was run in 10 μl reactions, which were loaded onto the qRT-PCR array (a 4 × 96-well array was used) with an epMotion 5075 robot (Eppendorf, Hamburg, Germany). An ABI-7900HT PCR machine (Applied Biosystems, Grand Island, NY) was used with the following cycling program: 95°C for 10 min, 40 cycles of 95°C for 15 s and 60°C for 1 min, followed by a dissociation step. We selected the three optimal housekeeping genes for the two datasets (amplified and unamplified) from the five measured (Actb, B2m, Hprt1, Ldha, and Rplp1) and normalized the mRNA expression levels (ΔCt) using the R package SLqPCR which implements Vandesompele et al. (Vandesompele et al. 2002).
The LCM-derived RNA (n = 2, 0.33% HD) samples with the highest concentrations were also sent to the service core of SABiosciences to compare the reproducibility of our results. Within the pre-amplification step, they used 100 ng of input RNA. These amplified samples were loaded onto the apoptosis PCR array, along with their unamplified versions, and the same PCR cycling program was used. SABiosciences normalized the data using the arithmetic mean of all five housekeeping genes in the data they provided.
RNA amplification comparison and statistical analysis
The ratios, correlations, means and standard deviations (SD) were calculated using the R Statistical environment and plotted in both R and Prism (Graphpad Software, Inc., La Jolla, CA). The data from both unamplified and amplified LCM-derived RNA were plotted against each other for examination of the effect of amplification on the data. The threshold cycle (Ct) values for differing input concentrations of RNA for amplification were plotted, and the r2 and p-values determined using a linear regression in Prism Graphpad.
Results
The process of LCM, from microdissection to concentration of RNA replicates from one sample, is outlined in Figure 1. This process was repeated seven times to compensate for RNA loss during DNase treatment and concentration to ensure that sufficient RNA could be isolated despite eliminating an amplification step. The process yielded approximately 350 ng of RNA. Seminiferous tubules were chosen for microdissection based on their stage of spermatogenesis (stages I–VI). The peripheral cell layers of the seminiferous tubules were captured, which mainly included Sertoli cells, spermatogonia, spermatocytes, and spermatids (Figure 2C). An improvement in integrity was seen following RNA combination and concentration, as assessed by RIN number from 2100 Bioanalyzer (Figure 3A–3C). The before and after DNase treatment and RNA concentration steps yielded RINs of 5.40 and 6.50, respectively. (Agilent, Santa Clara, CA).
Figure 1.

Laser capture microdissection method schematic. For 1 sample replicate, about 20 seminiferous tubules from 12 slides were microdissected. The polymer film from each cap was peeled off and placed into 600 μl of mirVana Lysis/Binding buffer until all slides had been microdissected. After the final film had been added, the film/buffer mixture was incubated on ice for 45 min, following which RNA was extracted using the mirVana kit. This process was repeated 7 times and then each replicate is DNase treated, then combined and concentrated using the RNeasy MinElute Kit yielding approximately 350 ng of RNA.
To examine the variability of the ratio of amplified to unamplified Ct values, we compared the ratios of four samples, two controls and two exposed (Figure 4). The mean amplification ratio for the combined four samples ranged from about 1 to 2, indicating different amplification rates for each gene. However, the error bars (1 SD) show that the amplification ratio of the genes is very consistent between the four samples, implying consistency of amplification on a gene-by-gene basis.
Figure 4.

Effect of amplification on measured gene expression. Ratio of mean (and standard deviation) of amplified to unamplified mean cycle ratios across genes using sample data from both our lab and SABiosciences. Genes highlighted in black, Traf3, Tp53, Faslg, Dffb, Bcl2a1d and Bcl2l11, have a high standard deviation.
To explore the potential for amplification bias, the ΔCt values generated for the amplified LCM-derived samples were compared to their unamplified counterparts (Figures 5 and 6). LCM-derived samples (n = 2, 0.33% HD) were also sent to SABiosciences for an unamplified versus amplified samples to verify our methods and to compare the reproducibility of the results. The comparison of biological replicates (controls) between amplified and unamplified ΔCt values for each gene present on the array, show strong correlations with r2 values of 0.99 and 0.98, respectively (Figure 5A and 5B). The data for the 0.33% + 2 Gy biological replicates are not shown, but demonstrate the same strong correlations. Likewise, the comparison of the ΔCt values between the amplified and unamplified biological replicates performed by SABiosciences yields the same strong correlations, with r2 values of 0.98 and 0.97, respectively (Figure 5C and 5D).
Figure 5.

Consistency of RNA input method across samples. Unamplified and amplified ΔCt value comparison. Graphs are shown comparing the ΔCt values for amplified (A) and unamplified (B) control biological replicates from our lab and amplified (C) and unamplified (D) 0.33% HD exposed sample data generated by SABiosciences.
Figure 6.
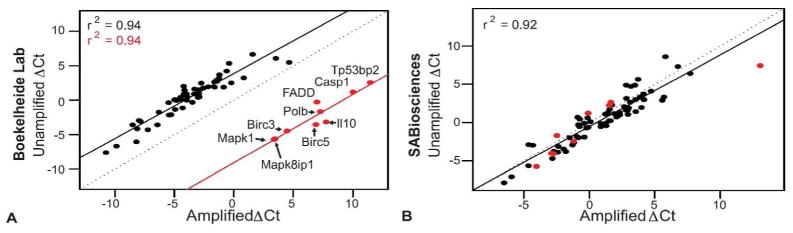
Consistency of RNA input method within samples. The unamplified and amplified ΔCt values were compared within samples for a control sample from our lab (A) and a 0.33% HD exposed sample from SABiosciences (B). The data points highlighted in red (A) indicate outliers in the correlation and the corresponding genes for the data points are labeled.
The nine data points highlighted in red in Figure 5A–5D are outliers in the comparison of the ΔCt values for unamplified versus amplified material generated by our lab. The unamplified and amplified ΔCt values generated by our lab correlate with an r2 of 0.94, with the exception of these nine outliers: Mapk1, Mapk8ip1, Birc3, Birc5, Il10, Polb, Fadd, Casp1 and Tp53bp2. Interestingly, these outliers correlate with each other just as well (r2 = 0.94) (Figure 6A). The SABiosciences data also correlate well (r2 = 0.92), but the outliers from Figure 6A are no longer outliers with their data, with the exception of one data point (Figure 6B).
The amount of input RNA that goes into an amplification reaction may affect the quality of results obtained. Different amounts of pooled LCM RNA (7, 14, 35, and 98 ng) were used as input into the pre-amplification step to test the role of input concentration in PCR array results (Figure 7). In Figure 7A, the correlation between 14 ng of input RNA and 7 ng, 35 ng, and 98 ng was strong, with r2 values of 0.98, 0.98 and 0.95, respectively. The Ct values were compared amongst each gene at each input RNA amount (Figure 7B). As expected, increasing the input concentration lowers the number of cycles required to reach the threshold at a rate consistent within transcripts but not between transcripts. The genes that demonstrated the largest variance in Ct values are labeled in black and these include Tnfrsf11b, Birc5, Bnip2, Dffa, Bak1, and Bcl10.
Figure 7.

Effect of RNA input concentration on threshold cycle values. (A) The threshold cycles for 14 ng of amplification input RNA compared to input RNA values of 7 ng (blue line), 35 ng (green line) and 98 ng (purple line). (B) The cycle threshold values for each gene at each amplification input RNA concentration, 7 ng (blue line), 14 ng (pink line), 35 ng (green line) and 98 ng (purple line). Highlighted genes, Tnfsf10, Bnip1, Bnip2, Dffb, Bcl2a1d, and Bcl2l11, indicate where the Ct values are not consistent across the different RNA values.
Discussion
LCM has proven to be a useful technique for isolating not only toxicant sensitive cell types, but also in isolating spermatogenesis stage-specific cell populations (Sluka et al. 2002). Cells are selected based on their morphology and used in downstream applications such as qRT-PCR and gene microarrays. Although this technique allows for cell-specific analysis, there are associated hurdles that need to be overcome to maximize the utility of LCM. Some of these issues, such as tissue handling, consumables, staining reagents and extraction methods, have already been addressed by previous methodology papers (Sluka et al. 2008).
In the optimization of LCM as a tool for studying stage-specific effects of testicular toxicants, additional issues needed to be addressed. Our streamlined method (Figure 1) addressed hurdles such as the limited concentrations of RNA generated by traditional LCM methods and the accuracy of quantification methods. With repeated capture of multiple slides from the same biological replicate combined with pooling of several of these replicates, we achieved both increased RNA yields (approximately 350 ng) and improved quality following concentration per biological sample (Figures 1 and 2). The method detailed here can be used to avoid an amplification step, while still reliably generating enough quality RNA to be used in downstream studies such as qRT-PCR arrays and microarrays.
The amplification ratio ranges from 1 to 2 across the transcripts, but the standard deviations of the ratios are small (Figure 4). These results indicate that there are highly variable amplification rates across the different transcripts, but the within-transcript amplification is consistent across samples. This argues that comparisons between transcripts should not be made without a correction factor adjusting for the amplification ratio, while the results from single transcripts on the PCR array across multiple samples are comparable. The transcripts with highly variable mean cycle amplification ratios (Tp73, Tnfsf12, Tnfsf10, Dffa, Bak1, Bcl10) (Figure 4) are either present at low levels within the testis and/or not in the spermatogenesis stages or cell types captured (Grataroli et al. 2002; Hamer et al. 2001; Song et al. 2008), which would explain some of the variability observed.
To examine the potential for amplification bias, we used the method outlined in Figure 1 to generate enough RNA to compare unamplified and amplified versions of the same sample on a PCR array platform. The same samples were analyzed in two different laboratories, providing independent replication of the experiment. From either lab, both the unamplified ΔCt values and the amplified showed a strong, within-method correlation of log-fold expression (Figure 5). There was also a strong correlation in the comparison of unamplified to amplified ΔCt values from both labs, but the labs differed in the presence or absence of outliers (Figure 6). This discrepancy was attributed to the amount of input RNA used for pre-amplification (14 ng vs. 100 ng of input RNA). Amplified samples resulting from a higher amount of input RNA were more consistent across the range of transcript abundance in the sample (Figure 5). Some of the outlying genes, though expressed in the testis, were not highly expressed within the cell types that were microdissected (Figure 6). For example, the Mapk1 and Mapk8ip1 transcripts are more abundant within Leydig cells (Thompson et al. 2001; Yamashita et al. 2011), and Il10 is produced by resident testicular macrophages upon inflammation (Winnall et al. 2011). These data demonstrate the need for caution when comparing LCM-derived unamplified to pre-amplified results, in particular with transcripts that are known to be of low abundance, and thus may not amplify at the same rate.
To better understand the amplification bias, we examined the effect of low RNA concentration on PCR threshold cycles by varying the input RNA amounts to be amplified. The RNA amounts were chosen based on the RNA concentration that is typically achieved with the LCM method. The respective threshold cycle values for each RNA input amount were compared across the different genes on the PCR array (Figure 7B). The amplification Ct values for 7 ng, 35 ng, and 98 ng of RNA input were compared to the Ct values from 14 ng of RNA input and show strong correlations across all the input values tested (Figure 7A). There was more variance with low concentration transcripts (Ct > 25), when the amplification input RNA was either very low (7ng) or very high (98ng). Here, the choice of input RNA amount makes little difference; however, when comparing the expression of low abundance transcripts in combination with low input RNA, the Ct values may fall below detection.
The use of LCM is often necessary to obtain insight into small subsets of cells within a larger population, whether these are toxicant-sensitive cells in a multicellular tissue, or specific cancerous cells within a tissue. Here, we present an improved and reliable LCM method for generating greater amounts of RNA for down-stream analyses and validate the use of a qRT-PCR array with the LCM-derived RNA. In a companion study, the validated method presented here was applied to the study of co-exposure effects on gene expression in specific cell types targeted by varying low doses of the toxicants HD and x-ray (Catlin et al. 2013b). Apoptosis specific PCR arrays were utilized to examine the testis cell specific response, and conclusions were drawn based on the expression data combined with histological data from the literature.
Amplification is almost always necessary with LCM-derived samples and it can introduce bias in the consistency of amplification across transcripts. Given the variability in low abundance genes from the amplification of LCM-derived RNA in this study, it is important to take low RNA input amounts into consideration when comparing results between unamplified and amplified input RNA experiments. We have determined the genes that are inconsistently amplified across the apoptosis PCR array platform with rat testis LCM-derived RNA. We recommend that a screening procedure be used with future applications of this method to determine those genes that will not respond to amplification due to low abundance.
Acknowledgments
This work was supported by the National Institute of Environmental Health Sciences at the National Institutes of Health (grant numbers P42 ES013660 and 5 T32 ES07272-17). We would like to thank the service core at SABiosciences for their contributions to the comparisons of our LCM-derived RNA.
Abbreviations
- LCM
laser capture microdissection
- HD
2,5-hexanedione
- x-ray
x-irradiation
- SD
standard deviation
Footnotes
Competing Interests
Kim Boekelheide has funding from NIEHS, USEPA, and the American Chemistry Council. He is an occasional expert consultant for chemical and pharmaceutical companies, and owns stock in CytoSolv, an early stage biotechnology company developing a wound healing therapeutic.
References
- Campion SN, Houseman EA, Sandrof MA, Hensley JB, Sui Y, Gaido KW, Wu Z, Boekelheide K. Suppression of radiation-induced testicular germ cell apoptosis by 2,5-hexanedione pretreatment. II. Gene array analysis reveals adaptive changes in cell cycle and cell death pathways. Toxicological sciences: an official journal of the Society of Toxicology. 2010a;117:457–65. doi: 10.1093/toxsci/kfq204. [DOI] [PMC free article] [PubMed] [Google Scholar]
- Campion SN, Sandrof MA, Yamasaki H, Boekelheide K. Suppression of radiation-induced testicular germ cell apoptosis by 2,5-hexanedione pretreatment. III. Candidate gene analysis identifies a role for fas in the attenuation of X-ray-induced apoptosis. Toxicological sciences: an official journal of the Society of Toxicology. 2010b;117:466–74. doi: 10.1093/toxsci/kfq205. [DOI] [PMC free article] [PubMed] [Google Scholar]
- Caretti E, Devarajan K, Coudry R, Ross E, Clapper ML, Cooper HS, Bellacosa A. Comparison of RNA amplification methods and chip platforms for microarray analysis of samples processed by laser capture microdissection. Journal of cellular biochemistry. 2008;103:556–63. doi: 10.1002/jcb.21426. [DOI] [PubMed] [Google Scholar]
- Cheng L, Zhang S, MacLennan GT, Williamson SR, Davidson DD, Wang M, Jones TD, Lopez-Beltran A, Montironi R. Laser-assisted microdissection in translational research: theory, technical considerations, and future applications. Appl Immunohistochem Mol Morphol. 2013;21:31–47. doi: 10.1097/PAI.0b013e31824d0519. [DOI] [PubMed] [Google Scholar]
- Duftner N, Larkins-Ford J, Legendre M, Hofmann HA. Efficacy of RNA amplification is dependent on sequence characteristics: implications for gene expression profiling using a cDNA microarray. Genomics. 2008;91:108–17. doi: 10.1016/j.ygeno.2007.09.004. [DOI] [PMC free article] [PubMed] [Google Scholar]
- Emmert-Buck MR, Bonner RF, Smith PD, Chuaqui RF, Zhuang Z, Goldstein SR, Weiss RA, Liotta LA. Laser capture microdissection. Science. 1996;274:998–1001. doi: 10.1126/science.274.5289.998. [DOI] [PubMed] [Google Scholar]
- Gehring S, Sabo E, San Martin ME, Dickson EM, Cheng CW, Gregory SH. Laser capture microdissection and genetic analysis of carbon-labeled Kupffer cells. World J Gastroenterol. 2009;15:1708–18. doi: 10.3748/wjg.15.1708. [DOI] [PMC free article] [PubMed] [Google Scholar]
- Grataroli R, Vindrieux D, Gougeon A, Benahmed M. Expression of tumor necrosis factor-alpha-related apoptosis-inducing ligand and its receptors in rat testis during development. Biology of reproduction. 2002;66:1707–15. doi: 10.1095/biolreprod66.6.1707. [DOI] [PubMed] [Google Scholar]
- Hamer G, Gademan IS, Kal HB, de Rooij DG. Role for c-Abl and p73 in the radiation response of male germ cells. Oncogene. 2001;20:4298–304. doi: 10.1038/sj.onc.1204568. [DOI] [PubMed] [Google Scholar]
- Hasegawa M, Wilson G, Russell LD, Meistrich ML. Radiation-induced cell death in the mouse testis: relationship to apoptosis. Radiation research. 1997;147:457–67. [PubMed] [Google Scholar]
- Lang JE, Magbanua MJ, Scott JH, Makrigiorgos GM, Wang G, Federman S, Esserman LJ, Park JW, Haqq CM. A comparison of RNA amplification techniques at sub-nanogram input concentration. BMC genomics. 2009;10:326. doi: 10.1186/1471-2164-10-326. [DOI] [PMC free article] [PubMed] [Google Scholar]
- Leblond CP, Clermont Y. Definition of the stages of the cycle of the seminiferous epithelium in the rat. Ann N Y Acad Sci. 1952;55:548–73. doi: 10.1111/j.1749-6632.1952.tb26576.x. [DOI] [PubMed] [Google Scholar]
- Markelewicz RJ, Jr, Hall SJ, Boekelheide K. 2,5-hexanedione and carbendazim coexposure synergistically disrupts rat spermatogenesis despite opposing molecular effects on microtubules. Toxicological sciences: an official journal of the Society of Toxicology. 2004;80:92–100. doi: 10.1093/toxsci/kfh140. [DOI] [PubMed] [Google Scholar]
- Mazurek N, Frisk AL, Beekman JM, Hartwig A, Meyer K. Comparison of progestin transcriptional profiles in rat mammary gland using Laser Capture Microdissection and whole tissue-sampling. Exp Toxicol Pathol. 2013 doi: 10.1016/j.etp.2013.01.009. [DOI] [PubMed] [Google Scholar]
- Moffit JS, Bryant BH, Hall SJ, Boekelheide K. Dose-dependent effects of sertoli cell toxicants 2,5-hexanedione, carbendazim, and mono-(2- ethylhexyl) phthalate in adult rat testis. Toxicologic pathology. 2007;35:719–27. doi: 10.1080/01926230701481931. [DOI] [PubMed] [Google Scholar]
- Nygaard V, Loland A, Holden M, Langaas M, Rue H, Liu F, Myklebost O, Fodstad O, Hovig E, Smith-Sorensen B. Effects of mRNA amplification on gene expression ratios in cDNA experiments estimated by analysis of variance. BMC genomics. 2003;4:11. doi: 10.1186/1471-2164-4-11. [DOI] [PMC free article] [PubMed] [Google Scholar]
- Sluka P, O’Donnell L, McLachlan RI, Stanton PG. Application of laser-capture microdissection to analysis of gene expression in the testis. Progress in histochemistry and cytochemistry. 2008;42:173–201. doi: 10.1016/j.proghi.2007.10.001. [DOI] [PubMed] [Google Scholar]
- Sluka P, O’Donnell L, Stanton PG. Stage-specific expression of genes associated with rat spermatogenesis: characterization by laser-capture microdissection and real-time polymerase chain reaction. Biology of reproduction. 2002;67:820–8. doi: 10.1095/biolreprod.102.004879. [DOI] [PubMed] [Google Scholar]
- Song Y, Liang X, Hu Y, Wang Y, Yu H, Yang K. p,p′-DDE induces mitochondria-mediated apoptosis of cultured rat Sertoli cells. Toxicology. 2008;253:53–61. doi: 10.1016/j.tox.2008.08.013. [DOI] [PubMed] [Google Scholar]
- Subkhankulova T, Livesey FJ. Comparative evaluation of linear and 1 exponential amplification techniques for expression profiling at the single-cell level. Genome Biol. 2006;7:R18. doi: 10.1186/gb-2006-7-3-r18. [DOI] [PMC free article] [PubMed] [Google Scholar]
- Thompson NA, Haefliger JA, Senn A, Tawadros T, Magara F, Ledermann B, Nicod P, Waeber G. Islet-brain1/JNK-interacting protein-1 is required for early embryogenesis in mice. The Journal of biological chemistry. 2001;276:27745–8. doi: 10.1074/jbc.C100222200. [DOI] [PubMed] [Google Scholar]
- Vandesompele J, De Preter K, Pattyn F, Poppe B, Van Roy N, De Paepe A, Speleman F. Accurate normalization of real-time quantitative RT-PCR data by geometric averaging of multiple internal control genes. Genome Biol. 2002;3:RESEARCH0034. doi: 10.1186/gb-2002-3-7-research0034. [DOI] [PMC free article] [PubMed] [Google Scholar]
- Winnall WR, Muir JA, Hedger MP. Rat resident testicular macrophages have an alternatively activated phenotype and constitutively produce interleukin-10 in vitro. Journal of leukocyte biology. 2011;90:133–43. doi: 10.1189/jlb.1010557. [DOI] [PubMed] [Google Scholar]
- Yamasaki H, Sandrof MA, Boekelheide K. Suppression of radiation-induced testicular germ cell apoptosis by 2,5-hexanedione pretreatment. I. Histopathological analysis reveals stage dependence of attenuated apoptosis. Toxicological sciences: an official journal of the Society of Toxicology. 2010;117:449–56. doi: 10.1093/toxsci/kfq203. [DOI] [PMC free article] [PubMed] [Google Scholar]
- Yamashita S, Tai P, Charron J, Ko C, Ascoli M. The Leydig cell MEK/ERK pathway is critical for maintaining a functional population of adult Leydig cells and for fertility. Molecular endocrinology. 2011;25:1211–22. doi: 10.1210/me.2011-0059. [DOI] [PMC free article] [PubMed] [Google Scholar]