

Background: Elongation factor P (EF-P) rescues ribosomes stalled at consecutive prolines; however, not all proteins with polyprolines show EF-P-dependent expression.
Results: A correlation between translation initiation rate and EF-P dependence is demonstrated.
Conclusion: Ribosome stalls lower protein levels only when they are more rate-limiting than initiation.
Significance: The results explain why stall motifs do not necessarily affect protein abundance.
Keywords: ATP Synthase, Bacterial Pathogenesis, Gene Regulation, mRNA, Ribosome, Translation Elongation Factor, Translation Initiation
Abstract
Ribosome stalling during translation can be caused by a number of characterized mechanisms. However, the impact of elongation stalls on protein levels is variable, and the reasons for this are often unclear. To investigate this relationship, we examined the bacterial translation elongation factor P (EF-P), which plays a critical role in rescuing ribosomes stalled at specific amino acid sequences including polyproline motifs. In previous proteomic analyses of both Salmonella and Escherichia coli efp mutants, it was evident that not all proteins containing a polyproline motif were dependent on EF-P for efficient expression in vivo. The α- and β-subunits of ATP synthase, AtpA and AtpD, are translated from the same mRNA transcript, and both contain a PPG motif; however, proteomic analysis revealed that AtpD levels are strongly dependent on EF-P, whereas AtpA levels are independent of EF-P. Using these model proteins, we systematically determined that EF-P dependence is strongly influenced by elements in the 5′-untranslated region of the mRNA. By mutating either the Shine-Dalgarno sequence or the start codon, we find that EF-P dependence correlates directly with the rate of translation initiation where strongly expressed proteins show the greatest dependence on EF-P. Our findings demonstrate that polyproline-induced stalls exert a net effect on protein levels only if they limit translation significantly more than initiation. This model can be generalized to explain why sequences that induce pauses in translation elongation to, for example, facilitate folding do not necessarily exact a penalty on the overall production of the protein.
Introduction
Cellular protein levels are the sum of transcription, translation, and degradation rates, and all of them incorporate their own regulatory mechanisms. During translation, one protein is produced for each ribosome that successfully recognizes and assembles on an mRNA transcript (initiation), constructs a polypeptide (elongation), and releases the full-length amino acid chain (termination). Decreased efficiency of any of these three phases reduces the number of ribosomes able to complete translation and, hence, lowers total protein production. To maximize the efficient use of resources, the rate-limiting step usually occurs at the point of initiation, and extensive work has made it clear that the strength of ribosome binding greatly affects the amount of protein produced from an mRNA transcript (1). By altering elements of the ribosome binding site, such as the Shine-Dalgarno (SD)3 sequence of canonical eubacterial mRNA, translation rates can be controlled to fine tune gene expression at the post-transcriptional level (2–4). Other elements of the 5′-UTR can also play a role in translation initiation including mRNA secondary structure, sRNA binding sites, the start codon, and translation enhancers, AT-rich regions in proximity to the SD sequence that improve small subunit binding (5–7).
Although initiation is typically the primary regulatory step in translation, slower progression through elongation can also influence protein synthesis. This has been studied extensively for rare codons that slow the elongation rate because of lower cellular tRNA concentration and starvation conditions that restrict the amount of aminoacylated tRNA (8–12). In these instances, ribosomes must pause until a properly charged tRNA accurately decodes at the A-site, and the impact of this delay on protein levels can be influenced by rare codon clustering, repetition, or position within an ORF (13–17). Other elongation stalls have been shown to regulate protein production such as during translation of secM, wherein ribosomes pause at a particular amino acid sequence until the N-terminal peptide is recognized by the SecA secretion apparatus, thus directing secM expression (18, 19). Interaction between the nascent polypeptide and the ribosome exit tunnel has been implicated to mediate this and other stalls in elongation or termination (20–23). Although these stall motifs bear little sequence similarity, many involve prolines, presumably because of their unique characteristics and relatively poor peptide bonding capability (24, 25).
Consecutive prolines within a protein sequence have been shown to have a negative effect on elongation during translation, and the universally conserved translation factor, elongation factor P (EF-P), and its eukaryotic homolog, eIF5A, play a critical role in alleviating stalls at polyproline-containing sequences including but not limited to PPP, APP, and PPG motifs (26–30). EF-P bears remarkable similarity in size and shape to a tRNA and has been shown to bind the ribosome between the P- and E-sites (31, 32). When bound, EF-P projects a unique highly conserved modified lysyl-(R)-β-lysine residue into the peptidyl transferase center to presumably reinitiate peptide bond formation (33–37). Both in vitro and in vivo assays have demonstrated that some of these polyproline motif-containing proteins display dramatically reduced levels in an efp mutant of Escherichia coli or Salmonella enterica serovar Typhimurium (hereafter referred to as Salmonella) (26, 27, 29, 30, 38). However, proteomic analysis by amino acid isotope labeling (SILAC) in both of these species has also demonstrated that a large percentage of polyproline-containing proteins are unaffected by the absence of EF-P (29, 30). This divergent impact of specific stall sequences on protein levels establishes polyproline motifs as an excellent model for examining the interplay between elongation stalls and cellular protein synthesis.
A particularly striking example is found in the ATP synthase complex, which contains two components, AtpD (β-subunit) and AtpA (α-subunit), which both contain a PPG motif. These two proteins are similar in sequence and structure, are present in the functional complex in equal stoichiometries, and are both encoded on the same mRNA transcript; yet despite these similarities, AtpD consistently exhibits lower levels in efp mutants, whereas AtpA levels are unaffected by the loss of EF-P (39, 40). In a recent study, we employed ribosome profiling to map the occurrence of translational stalls in an E. coli efp mutant and investigated the role of amino acids immediately upstream of the PPG motifs of AtpA and AtpD in EF-P-dependent stalling (41). This work indicated that although AtpA protein levels were not altered in previous SILAC analyses, some translational stalling occurs at its PPG motif, albeit to a lesser extent than AtpD. Swapping even a single amino acid two residues upstream of the PPG motif between AtpA and AtpD resulted in a partial, but incomplete reversal of EF-P dependence. This suggests that although the region proximal to the PPG motif does play a role in stalling, there are other factors influencing EF-P dependence beyond the immediate vicinity of the pause site.
In the work presented here, we used atpA and atpD as model systems to investigate additional factors affecting the impact of stalling on protein levels. Systematic swapping of regions of these two genes revealed that the component most critical for the difference in EF-P dependence was contained within the 5′-UTR. Further mutagenesis and modeling studies demonstrate a relationship between the translation initiation strength of a transcript and the impact of an EF-P-dependent stall on protein production. Taken together, our data indicate that not all polyproline motifs induce stalling to equal degrees and that EF-P dependence is only observed when a given polyproline sequence impacts the rate of synthesis more than translation initiation.
EXPERIMENTAL PROCEDURES
Bacterial Strains and Plasmids
Salmonella wild type was Salmonella enterica serovar Typhimurium strain 14028S (WN150) and generation of an isogenic efp mutant (WN1405) that deletes most of the efp gene (base pairs 145–424) while maintaining the yjeK promoter has been described previously (29). The pXG10sf translational fusion reporter system was used to measure EF-P-dependent expression in Salmonella strains and has been described previously (29, 42–44). The plasmid employs a tightly regulated low copy number origin of replication (pSC101) and a constitutively active promoter (PLtet0-1) to minimize variations in transcription.
Salmonella atpA or atpD genes were inserted into the NsiI and NheI sites of pXG10sf immediately after the promoter and lacking a stop codon for C-terminal translational fusion to “superfolder” GFP. Because the native atpIBEFHAGDC operon is transcribed as a single mRNA, 75 (atpA) or 74 bp (atpD) upstream of the start codon was included as a 5′-UTR. Successive directed mutations to these constructs were introduced by conducting around the world PCR, with primers containing the mutated sequence as overlapping overhangs, followed by Gibson isothermal assembly cloning to circularize (45). All constructs were confirmed by Sanger sequencing. Specific primers and constructs are listed in supplemental Table S1.
E. coli wild type (BW25113) and efp mutant were from the Keio knock-out collection, and kanamycin cassettes were removed using FLP recombinase (46, 47). For EF-P-dependent expression assays in E. coli, the pBAD30XS translation fusion plasmid was used as described previously (29, 41). The plasmid contains an arabinose-inducible tandem fluorescence cassette consisting of GFP followed immediately by the mCherry SD sequence and mCherry. Putative EF-P-dependent motifs were inserted at the N terminus of GFP, between codons 3 and 4. To vary the efficiency of translation initiation, different start codons (GTG, TTG, ATC, and CTG) were inserted into the pBAD30XS plasmids by double-stranded oligonucleotide hybridization between the EcoRI and XhoI cut sites (48). Specific primers and constructs are listed in supplemental Table S1.
GFP Fluorescence Assay in Salmonella
As described previously, Salmonella wild-type and Δefp mutant strains carrying derivatives of pXG10sf were grown at 37 °C with shaking for 16 h in a TECAN Infinite M200 microplate reader in MOPS minimal medium supplemented with 0.2% glucose and 20 μg/ml chloramphenicol (29, 41). Optical density (A600 nm) and GFP fluorescence (475- and 511-nm excitation and emission wavelengths, respectively) were measured every 15 min. Background value from no-cell controls was subtracted from all readings, and values at 10 h postinoculation are shown.
GFP Fluorescence Assay in E. coli
As described previously, overnight cultures of E. coli harboring pBAD30XS constructs were used to inoculate M9 medium to an A600 of 0.05 (29, 41). The M9 medium was supplemented with 0.2% glycerol, 0.5 g/liter, tryptone, 5 μg/liter thiamine, 0.2% arabinose, and 100 μg/ml ampicillin. Cultures were grown at 37 °C with shaking, and fluorescence was measured at 8 h using a spectrofluorometer (Horiba) with excitation at 481 nm and emission at 507 nm for GFP or excitation at 587 nm and emission at 610 nm for mCherry. Blank medium measurements were subtracted as background.
Immunoblotting
Salmonella strains containing pXG10sf plasmids were grown in MOPS minimal medium supplemented with 0.2% glucose and 20 μg/ml chloramphenicol to mid-log phase. Cells were then washed twice (1 mm Tris, pH 8.0, 5 mm magnesium acetate) and lysed by sonication in lysis buffer (9.32 m urea, 2.67 m thiourea, 40 mm Tris, 86.78 mm CHAPS, pH 8.5). 10 μg of total cell lysate was added to 2× SDS loading buffer and boiled for 10 min at 95 °C, and proteins were separated by SDS-PAGE followed by semidry transfer to a nitrocellulose membrane. Following 1 h of blocking at room temperature in 5% milk in TBST (1× Tris-buffered saline, 0.05% Tween 20), immunoblotting was conducted overnight in TBST + 5% milk at 4 °C using a mouse anti-DnaK antibody (1:50,000; Enzo Life Sciences) and a mouse monoclonal antibody specific for GFP (1:1000; Santa Cruz Biotechnology). Blots were washed with TBST and subsequently incubated for 1 h at room temperature with HRP-fused goat anti-mouse antibody (1:10,000 in TBST + 5% milk) for ECL imaging (Thermo Scientific).
Curve Fitting
Fluorescence data were fit to a “1 - exp” curve of the form y = A(1 − e−Bx) by the minimum sum of the chi square method. For each observed wild-type fluorescence value (x coordinate), the chi square values were generated by comparing the corresponding observed Δefp fluorescence to the y value calculated by the equation. The chi squares for all constructs with the same ORF were summed, and the values of A and B yielding the minimal sum of chi squares was solved using the Solver function in Microsoft Excel. Coefficient of determination (R2) comparing observed Δefp data and y values predicted by the solved 1 − exp equation was calculated using the RSQ function in Excel.
Translation Kinetics Modeling
Translation was modeled in silico using a 150-codon ORF. At each cycle, the program randomly decides whether a ribosome will initiate by generating a random number between 1 and I; if the number is 1, it will bind at the start codon if it is unoccupied (initiation frequency = 1/I). Similarly, elongation frequency was set to , and progression would only occur if the next codon was vacant. Movement from positions 99 to 100 was defined as the “stall site,” and progression was determined by the “pause frequency” of 1/S. The program was run for 10,000 cycles and 2,000 replicate mRNAs each time, and the values shown in the figures represent the number of ribosomes able to terminate translation (frequency of termination at codon 150 was set to be equal to the elongation frequency). Additionally, the program saves the end point positions of the ribosomes on the mRNA to reflect ribosome densities at each codon. The in silico model was written in Perl 5.
RESULTS
The 5′-UTR Plays a Significant Role in EF-P Dependence
In our recent paper, we employed translational fusion constructs and found that AtpD but not AtpA was dependent on EF-P for its efficient translation, and this is consistent throughout the growth curve (Fig. 1 and Ref. 41). Furthermore, we observed that swapping the amino acids immediately upstream of the PPG motif of AtpA and AtpD partially reversed their EF-P dependence (41). However, this reversal was incomplete when compared with a negative control (LacZ), with a PPG::PLG mutation in AtpD, or with an RPPG::PPPG mutation in AtpA. Complete reversal was not achieved even when swapping up to 40 codons upstream of the PPG motif, a distance that accounts for more amino acids than can be accommodated in the ribosomal exit tunnel (21, 23, 49). This suggested that factors outside of the ribosome were negatively affecting AtpD translation in the efp mutant.
FIGURE 1.

AtpD but not AtpA shows decreased fluorescence in efp mutant Salmonella throughout the growth curve. Sixteen-hour growth curves of wild-type (solid lines) and efp mutant (dashed lines) Salmonella containing pXG10sf plasmids with AtpD (A and B) or AtpA (C and D) were inserted as a translational fusion to GFP. GFP fluorescence (black lines in A and C) and optical density at 600 nm (gray lines in A and C) were measured every 15 min. The ratio of GFP fluorescence/A600 is also shown (B and D). At least three independent replicates were conducted, and one representative replicate is shown. AFU, arbitrary fluorescence units.
To investigate additional regions impacting EF-P dependence, we systematically swapped regions of atpA and atpD using the previously employed pXG10sf plasmid, involving a constitutively active promoter and C-terminally fused superfolder GFP as a reporter (29, 42–44). We generated serial swaps of increasing length from the 5′ end of the mRNA transcript to the PPG motif or in the reverse direction (Fig. 2). Results from this analysis demonstrated that the coding region beyond 12 codons upstream of the PPG motif had no additional reversal of EF-P dependence, even when the entire N terminus from the ATG start codon to the polyproline motif was swapped. Contrastingly, there was a stark change in EF-P dependence when the 5′-UTR was included in the swapped region or when only the 5′-UTR was swapped. Specifically, the atpD 5′-UTR confers strong EF-P dependence onto the AtpA protein, whereas the 5′-UTR of atpA appears to significantly reduce the amount of EF-P dependence displayed by AtpD. Combined replacement of the 5′-UTR and the 12 codons upstream of the PPG motif have a cumulative effect, suggesting that the two regions affect expression independently and that complete switching of EF-P dependence requires both elements. Indeed, the atpD construct with both the atpA 5′-UTR and upstream PPG flanking region demonstrates higher fluorescence in the efp mutant than in wild-type Salmonella; this resembles the lacZ negative control and may be due to decreased levels of protease in the efp mutant (29).
FIGURE 2.

The 5′-UTR plays a role in EF-P dependence in addition to residues immediately upstream of the PPG motif. A, outline of pXG10sf-AtpD and -AtpA constructs. Swap constructs are shown with regions of the atpA gene swapped into the pXG10sf-AtpD construct. The naming scheme is indicated at left for each construct. B, regions of the atpA gene were swapped into the pXG10sf-AtpD construct (as shown in A). The data show the ratio of GFP fluorescence in Δefp/WT Salmonella normalized to A600. Unaltered (wt), a PPG::PLG mutation (P214L), the “12aa” construct, and pXG10sf-LacZ have been previously published (41) and are shown for comparison. C, as in B but showing constructs with regions of the atpD gene swapped into pXG10sf-AtpA (inverse of depiction in A). The values are the means of at least three biological replicates, and the error bars show one standard deviation.
The 5′-UTR Regions That Include the SD Sequence and a Potential Translation Enhancer Play a Significant Role in EF-P Dependence
Although native ATP synthase proteins are translated from a single mRNA transcript, both atpA and atpD possess their own SD sequence. Furthermore, their start codons are spaced 12 and 26 bases, respectively, after the stop codon of the preceding gene, suggesting that the translation of each is independent and not coupled to that of the preceding gene (NCBI accession number NC_016856.1). For the plasmid-based translational fusion assay employed here, the 5′-UTRs of the atpA and atpD constructs consisted of the 75 or 74 bases upstream of the start codon, respectively.
To further dissect the region within the 5′-UTR involved in EF-P dependence, 15-bp stretches were systematically swapped between atpA and atpD, and expression of the resulting construct was measured by GFP fluorescence. EF-P dependence was reversed most significantly when regions −15 to −1 or −30 to −16 relative to the start codon were swapped (Fig. 3). Notably, these regions are both predicted to be heavily involved in translation initiation: the −15 to −1 region includes the SD sequence, whereas the −30 to −16 region of atpD is particularly AT-rich (74%) compared with atpA (47%), suggesting that it may act as a translation enhancer (5, 7). Moreover, for all of the serial swap constructs generated, there appeared to be a correlation between EF-P dependence and the degree of overall expression (Fig. 3). Specifically, constructs that were poorly expressed exhibited little difference in fluorescence levels between wild-type and efp mutant strains, whereas constructs with high levels of expression in the wild-type background were the most reduced in the efp mutant.
FIGURE 3.

The 5′-UTR regions affecting EF-P dependence include the ribosome binding site and correlate with expression levels. A, sequence of the 5′-UTRs included in pXG10sf-AtpD and -AtpA constructs. Putative Shine-Dalgarno sequences are underlined. Base positions relative to the translation start site (ATG) are indicated below. B, regions of the atpA 5′-UTR were serially swapped into the corresponding position of pXG10sf-AtpD. For example, “−15–1” indicates the 15 bp from position −15 to −1 (relative to the ATG start codon) were swapped. The data show GFP fluorescence in arbitrary fluorescence units (AFU) normalized to A600 in WT (dark gray) and Δefp (light gray) Salmonella. The numbers above the columns indicate the Δefp/WT ratio. C, as in B but with regions of the atpD 5′-UTR swapped into the pXG10sf-AtpA construct. The values are the means of at least three biological replicates, and error bars show one standard deviation.
To ensure that this apparent loss of EF-P dependence was not due to an inability to accurately measure differences at low fluorescence levels, Western blotting of select AtpA and AtpD constructs was performed. The patterns of EF-P dependence observed by Western blotting were similar to those found by fluorescence measurements (Fig. 4). For a few constructs where fluorescence levels are less than 2-fold greater than no-plasmid controls, protein levels were very low or nondetectable by Western blot in both the wild-type and efp mutant strains. These constructs, including the atpD construct with the whole 5′-UTR of atpA, were omitted from downstream analyses.
FIGURE 4.
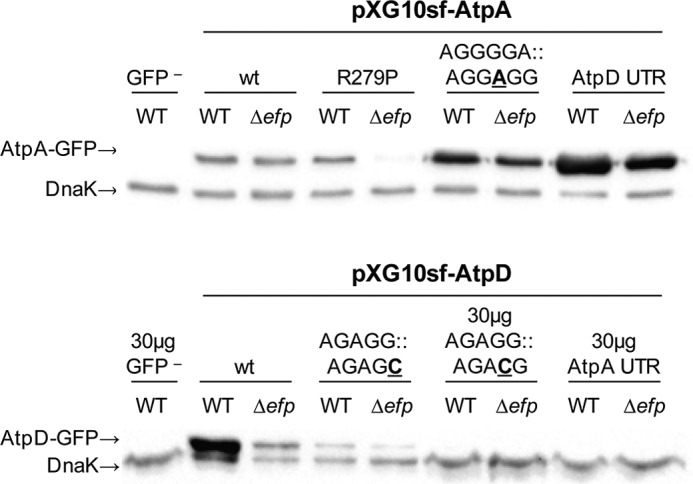
Immunoblot of GFP levels follow similar trends as fluorescence. Western blot probing for GFP expressed from pXG10sf constructs in WT and Δefp Salmonella grown to mid-log phase under conditions similar to those used for fluorescence measurements. GFP− control is wild-type cells expressing pXG10sf-AtpD but with a FLAG tag replacing GFP. Unless otherwise indicated, 10 μg of protein lysate was loaded for each sample. DnaK was included as a loading control. The experiment was conducted in triplicate, and one representative replicate is shown. For the “AtpD-AtpA UTR” and “AtpD AGAGG::AGACG” constructs in which fluorescence levels were less than 2-fold greater than no-plasmid controls, protein levels were very low or nondetectable in both the WT and efp mutant strains. The “AtpA-AtpD UTR from −60–46,” “AtpA-AtpD from ATG-PPG,” “AtpD-AtpA UTR and 12aa,” and “AtpD-AtpA UTR and P214L” constructs also had similarly low fluorescence levels (Figs. 2 and 3). These constructs were omitted from all downstream analyses.
Mutations That Affect Translation Initiation Influence EF-P Dependence
To further assess whether the 5′-UTR influences EF-P dependence through its role in translation initiation, we first confirmed that it instigates its effect via the polyproline stall rather than by a separate unrelated mechanism. Indeed, mutation of the PPG motif to PLG resulted in restoration of GFP fluorescence in the efp mutant even at high expression levels obtained by 5′-UTR swapping (Fig. 5). We next addressed translation initiation by mutating individual nucleotides within the SD sequence and the start codon of atpD and atpA. The atpA SD sequence (AGGGGA) was improved by mutating it to the consensus sequence (AGGAGG). For atpD, we weakened ribosome binding by mutating the ATG start codon or by altering the wild-type SD sequence (AGAGG) with a G > C mutation (AGAGC). Furthermore, we also strengthened the atpD SD sequence by a G insertion, yielding the consensus sequence (AGGAGG). Consistent with our hypothesis, the constructs displaying the highest levels of expression in wild-type cells were the most affected by the loss of EF-P (Fig. 6). Specifically, strengthening the SD sequence of either atpA or atpD yielded increased dependence on EF-P, whereas weakening the SD sequence or the start codon of atpD reduced its dependence. Because these point mutations target regions critical for ribosome binding, these data suggest that the 5′-UTR influences EF-P dependence via its role in translation initiation.
FIGURE 5.
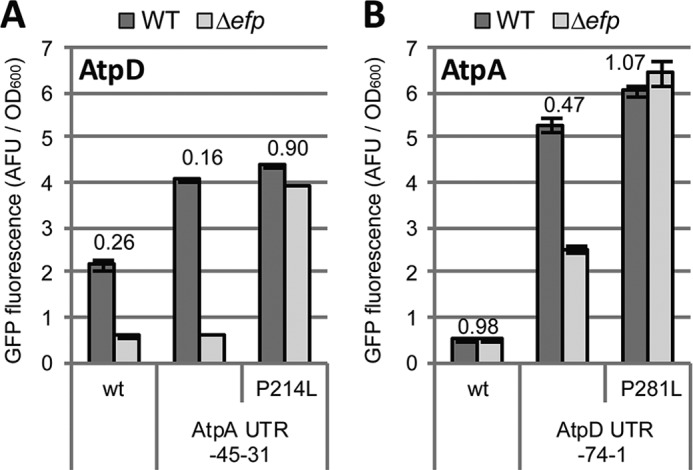
The effect of the 5′-UTR on EF-P dependence requires an intact stall motif. A, the −45–31 region of the atpA 5′-UTR was swapped into the pXG10sf-AtpD construct in combination with mutating the PPG motif to PLG. The data show GFP fluorescence in arbitrary fluorescence units (AFU) normalized to A600 comparing expression in WT (dark gray) to Δefp (light gray) Salmonella. The numbers above the columns indicate the Δefp/WT ratio. B, as in A but with the 5′-UTR of atpD (−74–1) swapped into the pXG10sf-AtpA construct. The values are the means of at least three biological replicates, and error bars show one standard deviation.
FIGURE 6.
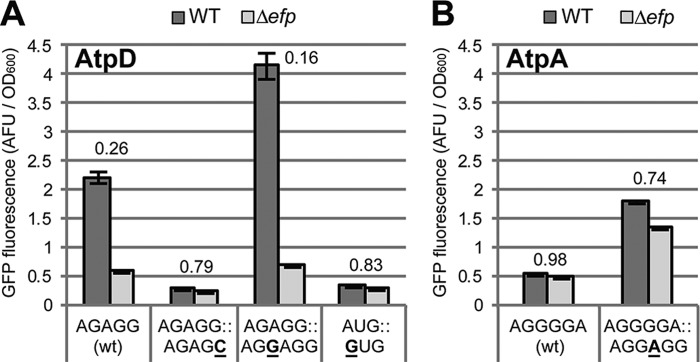
Single base mutations in the SD sequence or start codon alter expression and EF-P dependence. A, mutations in the SD sequence or in the ATG start codon of pXG10sf-AtpD. The wild-type sequence (AGAGG) is underlined in Fig. 3A. The data show GFP fluorescence in arbitrary fluorescence units (AFU) normalized to A600 comparing expression in WT (dark gray) to Δefp (light gray) Salmonella. The numbers above the columns indicate the Δefp/WT ratio. Unaltered (wt) construct is shown for comparison. B, as in A but with mutation in the SD sequence of the pXG10sf-AtpA construct. The wild-type sequence (AGGGGA) is underlined in Fig. 3A. The values are the means of at least three biological replicates, and error bars show one standard deviation.
Initiation Rate and Stall Strength Correlate with EF-P Dependence
To gain insight into the relation between initiation rate and EF-P dependence, we plotted fluorescence in wild-type versus in efp mutant Salmonella for the full set of 5′-UTR mutant constructs (Fig. 7A) (Table 1). We grouped constructs together by ORF such that in each group all constructs differed only in their 5′-UTR. Plotting in this manner allowed for visualization of changes in expression in the efp mutant (subjected to stalls in elongation) as initiation rate (and thereby wild-type expression) increases.
FIGURE 7.

Translation initiation and elongation stall strength influence protein level. A, GFP fluorescence data plotted to compare expression in WT (x axis) and Δefp (y axis) Salmonella. The y axis is expanded from 0 to 1 to clarify differences at low fluorescence levels. Each point represents fluorescence data for one pXG10sf construct. The specific construct for each data point is indicated by numerical label referring to Table 1. Icon groups signify constructs that all have the same ORF (indicated in key at bottom right) and only differ from one another in the 5′-UTR. For the AtpD and AtpA ORF groups, the data points were fit to a 1 − exp curve shown in the inset at the top left. P214L and P281L groups were connected linearly, and the dashed line indicates equal fluorescence in the WT and Δefp mutant. The data are shown as arbitrary fluorescence units (AFU) normalized to A600 and are the means of at least three biological replicates. Error bars showing one standard deviation are included for both x and y axes. “AtpD-AtpA 12aa” indicates 12 codons upstream of the atpA PPG motif were swapped into the AtpD construct, “AtpA-AtpD 12aa” is the reciprocal. B, fluorescence data from E. coli containing the pBAD30XS plasmid with the indicated polyproline motifs inserted at the fourth codon of GFP. For each motif construct, four start codon mutations were generated: from highest to lowest expression in wild type: AUG (wt), GUG, UUG, AUC, and CUG. Start codon mutant constructs with the same polyproline motif were plotted as a group with a corresponding 1 − exp curve of best fit. “No motif” has no inserted motif and is included as an EF-P independent control. Shown is a fluorescence ratio of GFP normalized to mCherry expressed from the same mRNA but with its own ribosome binding site. The y axis is expanded from 0 to 2 to clarify differences at low fluorescence levels. C, computational model comparing the effect of varying rates of translation initiation and stall clearance on protein synthesis (terminating ribosomes). Black circles indicate tested combinations of stall progression and initiation frequency and are connected linearly. Details of the model are described under “Experimental Procedures.”
TABLE 1.
Constructs used in Fig. 7A
| ORF | Mutation or swap in 5′-UTR | Label |
|---|---|---|
| LacZ | WT | 1 |
| AtpD | WT | 2 |
| AGAGG:AGAGC | 3 | |
| AtpA UTR from − 75 to − 61 | 4 | |
| AtpA UTR from − 60 to − 46 | 5 | |
| AtpA UTR from − 45 to − 31 | 6 | |
| AtpA UTR from − 30 to − 16 | 7 | |
| AtpA UTR from − 15 to − 1 | 8 | |
| AGAGG::AGGAGG | 9 | |
| ATG::GTG | 10 | |
| ATG::TTG | 11 | |
| AtpA UTR from − 45 to − 31 and AGAGG::AGGAGG | 12 | |
| AtpA | WT | 13 |
| AtpD UTR | 14 | |
| AGGGGA::AGGAGG | 15 | |
| AtpD UTR from − 74 to − 61 | 16 | |
| AtpD UTR from − 45 to − 31 | 17 | |
| AtpD UTR from − 30 to − 16 | 18 | |
| AtpD UTR from − 15 to − 1 | 19 | |
| AtpD UTR and AGAGG::AGGAGG | 20 | |
| AtpD UTR from − 30 to − 1 | 21 | |
| AtpD UTR from − 30 to − 1 and AGAGG::AGGAGG | 22 | |
| AtpD P214L | WT | 23 |
| AtpA UTR from − 45 to − 31 | 24 | |
| AtpA P281L | WT | 25 |
| AtpD UTR | 26 | |
| AtpA R279P | WT | 27 |
| AtpD-AtpA 12 amino acids | WT | 28 |
| AGAGG::AGGAGG | 29 | |
| AtpA UTR from − 45 to − 31 | 30 | |
| AtpA-AtpD 12 amino acids | WT | 31 |
| AtpD UTR | 32 | |
| AGGGGA::AGGAGG | 33 |
Strikingly, for both atpD and atpA, we find that as expression increases in wild type, expression in the efp mutant follows a distinct curve that eventually reaches a maximum. Indeed, the observed data could be fit well to a 1 − exp curve of the form: y = A(1 − e−Bx), where x and y represent fluorescence in the wild-type and efp mutant strains, respectively, and A and B are constants particular to the ORF being analyzed. Specifically, A is the asymptote of the curve and can be interpreted as the theoretical maximum expression in the efp mutant for that particular ORF, at which point progression through the stall motif has overtaken initiation as the rate-limiting step for all transcripts. Similarly, B is inversely related to the slope of the curve and how quickly it reaches the asymptote. Interestingly, the curve for the AtpD ORF was steeper than that for AtpA and reached a lower asymptote. This emphasizes that the stall in AtpD is more EF-P-dependent than that of AtpA, resulting in a lower maximum expression in the efp mutant and a significant hindrance on translation even at lower initiation rates.
Previously we found that the residues upstream of the PPG motif are partially responsible for the difference in EF-P dependence of AtpD and AtpA (41). To examine the additive effects of the upstream region and translation initiation rate, we applied our plotting analysis to constructs where the 12 amino acids upstream of the atpA or atpD PPG motifs were swapped. Interestingly, the data for the 12-amino acid swap constructs resemble the protein from which the upstream region originated, suggesting that the upstream residues govern stall strength and thereby the arc and maximum of the expression curve (Fig. 7A).
To investigate the relation between translation initiation and EF-P dependence in another bacterial species and with proteins other than AtpD and AtpA, we employed the Keio collection E. coli efp mutant (46). We conducted a similar plasmid-based translational fusion assay wherein specific polyproline motifs were inserted directly into the fourth codon position of GFP. We varied the efficient AUG initiation codon to GUG or UUG (class I codons that support efficient translation) or to AUC or CUG (class IIA codons that support translation at levels only 1–3% that of AUG) (48). Mutation of the start codons of these constructs revealed a similar correlation between expression in wild-type cells (initiation strength) and EF-P dependence for multiple different polyproline motifs (Fig. 7B). Fluorescence plotting and curve fitting follow a trend toward a maximum expression in the efp mutant, and interestingly, the strongest polyproline motif tested (six consecutive prolines) appeared to be rate-limiting (reached maximum expression in the efp mutant), even with the weakest start codon tested, CTG. This supports that the relation between initiation and EF-P dependence is not restricted to AtpD and AtpA in Salmonella but is generally applicable to other EF-P-dependent motifs and in other species.
Modeling the Interplay between Initiation Rates and Stall Clearance
Our observations of a maximum expression in the efp mutant as initiation rate increases prompted us to expand upon the relation between EF-P-dependent stalls and initiation rate. Using high throughput data sets from published works, we attempted to correlate measures of EF-P dependence, such as efp mutant SILAC (29, 30) or ribosome profiling data (41), with analogs for translation initiation rate including ribosome profiling reads (41), protein abundance (29, 30), or protein per mRNA (50) in wild-type cells. None of these analyses yielded a significant correlation (data not shown). This may be due to significant variation in the strength of different stalling sequences. EF-P dependence may be observed for some weakly expressed genes if they have a strong stall motif, and similarly some highly expressed genes encoding a polyproline motif may not show EF-P dependence if the motif triggers weak stalling. This heterogeneity may mask the correlation between translation rate and EF-P dependence in these high-throughput data sets.
To further explore the interplay between initiation rate and the stall strength of not just EF-P-dependent but also other elongation pauses, we generated a computational model simulating translation of a hypothetical 150-codon transcript using parameters (I and S) such that we could modulate the initiation rate and elongation stall strength. As described under “Experimental Procedures,” initiation was set to occur with a chance of 1/I. Ribosomes then proceeded forward one codon with a chance of and progressed through a mid-ORF stall with a chance of 1/S. This allowed us to vary the values of I and S while assessing the number of terminating ribosomes as an analog for protein production.
The computational modeling results follow a similar curve as our observed data for EF-P-dependent pauses wherein the impact of the elongation stall increases with initiation rate (Fig. 7C). Furthermore, for any given stall strength, the model predicts a maximum output at which point stall progression is the rate-limiting step for all mRNAs. Similarly, with increasing stall clearance time (S), the slope of the curve and the protein output decreases for any given initiation rate. The maximum expression level is also lower for stronger stalls. This resembles our findings for atpD and atpA, where the more EF-P-dependent stall in AtpD results in a sharper curve, reaching an earlier maximum than AtpA. Of note, when observing final ribosome positions at the end of the modeling run, a ribosome occupancy peak was observed at the stall site even for settings where initiation was clearly rate-limiting (I ≫ S), but total ribosome density on the transcript was similar pre- and poststall (Fig. 8, A and B). This suggests that stalling occurs when initiation rates are low but does not affect the number of terminating ribosomes because translation resumes prior to impeding the progression of upstream ribosomes. This was reflected in our previous E. coli ribosome profiling data for atpA and atpD where ribosome occupancy peaked at the PPG motif in both ORFs, but atpD showed a greater peak height relative to wild type and a more significant decrease in ribosome density poststall (Fig. 8, C and D) (41).
FIGURE 8.

Translation pause sites accumulate ribosomes and can affect downstream ribosome occupancy. A and B, ribosome occupancies from the computational translation model described under “Experimental Procedures” with a stall between codons 99 and 100. Shown are the number of ribosomes occupying each codon for varying initiation frequencies when the stall progression frequency was set to 1/100 (0.01). Ribosome occupancies are shown at 2,000 cycles (A) or 10,000 cycles (B) of running the program. C and D, ribosome profiling data from Elgamal et al. (41) showing ribosome occupancies within the AtpD (C) and AtpA (D) ORFs. A black line indicates ribosome occupancy in wild-type E. coli, and a gray line indicates ribosome occupancy in the efp mutant. The site of the PPG motif is indicated by a vertical dotted line.
Fate of Stalled Peptides in Vivo
A caveat of our model is that it assumes that ribosomes do not undergo premature release from the transcript during an extended stall at an EF-P-dependent motif. To assess whether this is a frequent occurrence in a Salmonella efp mutant, we reanalyzed peptide data from our previous SILAC investigation (29). In this experiment, proteins were fragmented into tryptic peptides that were quantified by mass spectrometry. Proteins observed during SILAC that contain an APP, PPG, or PPP motif were identified, and individual peptides observed in mass spectrometry were binned as either pre- or postmotif. Premature disengagement with the ribosome would be predicted to release truncated peptides, which would manifest as a relative decrease in peptides observed downstream of the polyproline motif as compared with peptides before the motif in the efp mutant strain. Such a decrease should not be observed in the wild-type strain, where the entire protein should be synthesized to completion.
We constrained our analysis to proteins with at least two peptides conclusively identified both before and after the motif, allowing for statistical comparison by t test of pre- and postmotif peptides. Of the 40 proteins for which sufficient peptide data were available, only one demonstrated a significant difference in relative expression pre- and postmotif (Fig. 9). Furthermore, SILAC ratios pre- and postmotif were linearly correlated with an R2 value of 0.851. Although it remains possible that truncated peptides are being degraded more rapidly than they can be detected, these data suggest that ribosomes do not prematurely disengage from the transcript at most polyproline motifs in the absence of EF-P, but rather eventually resume synthesis and complete the full-length protein.
FIGURE 9.

Peptide abundance ratios do not change significantly before and after APP, PPG, or PPP motifs in Salmonella. A, previously conducted SILAC data were analyzed comparing the mean peptide ratios (WT/Δefp) before and after the first APP, PPG, or PPP motif of the protein (29). Only proteins with an APP, PPG, or PPP motif and at least two peptides conclusively identified both before and after the motif were analyzed (40 proteins). A t test was used to calculate statistical significance comparing the average peptide abundance ratio pre- versus postmotif. Gene names and p values are shown for proteins with a difference between pre- and postmotif of greater than two. AtpD and AtpA are also indicated. The only protein with p < 0.05 is highlighted as a black square (Lon). The linear regression is shown with coefficient of determination (R2) indicated at right. A dashed line indicates a 1:1 regression. B, all Lon peptides detected in the previously conducted SILAC assay are shown plotting peptide ratio (WT/Δefp) against their location within the full-length Lon protein (29). The dashed line indicates the location of the PPG motif. The average values of all peptide ratios before or after the PPG motif are shown as a solid line, and error bars indicate one standard deviation.
DISCUSSION
In this work, we employed a plasmid-based translational fusion assay and the PPG-containing proteins AtpD and AtpA to explore the underlying determinants of EF-P dependence beyond polyproline motifs and as a model for other elongation stalls. We found that the 5′-UTR plays a crucial role in governing EF-P dependence, and all data suggest that this is through its effect on translation initiation rate. Simply put, the data suggest that many proteins containing polyproline motifs are unaffected by the loss of EF-P because poor initiation limits the rate of synthesis more than the stall itself. It follows that the impact of polyproline motifs on protein expression could be superseded not only by the rate of translation initiation, but also by the rate of elongation through alternate stalls including slow codons or starvation-sensitive regions (11, 14, 16, 51, 52). That is to say, an EF-P-dependent stall will only have an observable effect on protein level if it impacts the rate of synthesis more than initiation and any other step in translation including elongation or termination. We believe this is a parsimonious explanation for the many instances observed when a polyproline-containing protein does not demonstrate EF-P dependence in vivo (29, 30, 37, 38, 41).
Experimentally it is possible to observe an influence of both initiation and the stall sequence on translation. This can occur in situations where initiation and stalling impose similar constraints on the rate of protein synthesis and is due to heterogeneity in the population of transcripts. In a given population of mRNAs, some transcripts will successfully initiate several rounds of translation, whereas other transcripts will fail to initiate at all. Furthermore, the EF-P-dependent stalls on some transcripts will stochastically resolve faster than others. When transcripts have high overall initiation rates, most transcripts in the population will have engaged with more ribosomes than can be cleared through the polyproline-induced stall in the absence of EF-P, resulting in a buildup of blocked ribosomes upstream of the stall. For messages where initiation rates are low, ribosome binding is sufficiently rare that most stalled ribosomes will resume elongation before the next ribosome reaches the stall site. In this case, the polyproline motif will have no observable effect on protein levels. The net output of protein depends on how the population of transcripts is distributed among these states (Fig. 10).
FIGURE 10.
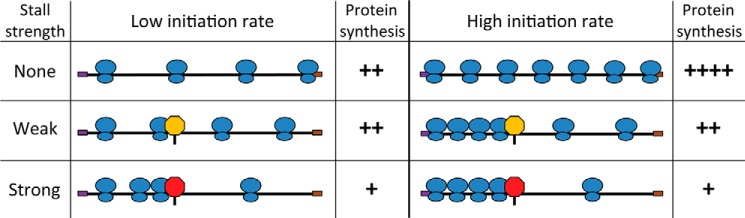
Model of the interplay between translation initiation rate and elongation stalls. This figure depicts translation of an mRNA transcript with low initiation rate (left columns) or high initiation rate (right columns) and the subsequent effect of no elongation stall (top row), a weak stall (middle row), or a strong stall (bottom row). Black line, mRNA transcript; purple box, start codon; brown box, stop codon; blue ovals, translating ribosomes; yellow stop sign, weak stall motif; red stop sign, strong stall motif. ++++, high degree of protein synthesis per transcript; ++, medium protein synthesis per transcript; +, low level of protein synthesis per transcript.
The model above is supported by our experimental results. For 5′-UTR mutants of atpA and atpD, as GFP fluorescence increased in wild-type cells, expression in the efp mutant appeared to approach an asymptote where stall progression becomes the predominant rate-limiting step of translation. This effect was dependent on an intact PPG motif and implies a calculable maximum expression in the efp mutant that is related to the rate of stall clearance. This stall strength is particular to individual ORFs and allows for a comparison of EF-P dependence across all initiation rates. Interestingly, the slope of the atpD curve declines much more rapidly than that of atpA and reaches a significantly lower maximum expression, supporting the idea that the EF-P relieved stall of AtpD is more difficult to bypass than that of AtpA. This is supported by our previous work where we found that the region upstream of the PPG motif plays a significant role in the degree of EF-P dependence (41). Indeed, when the 12 codons upstream of the PPG motifs were swapped, expression at multiple different initiation rates resembled the protein from which the 12 codons originated. Taken together, the region upstream of the PPG motif influences the strength of the stall and thereby the steepness and maximum of the expression curve as a function of initiation rate. Our in silico translational model supports this concept.
Our results also suggest that polyproline-dependent stalls in the absence of EF-P are eventually resolved and that protein synthesis proceeds to completion in most cases. If the ribosome disengaged from polyproline-induced stalls, we would expect that proteins translated with low rates of initiation would show a degree of EF-P dependence similar to that of proteins derived from transcripts with much higher initiation rates. This supposition is supported by our SILAC data, in which we did not observe an increase in peptide counts before the stall sequence compared with sequences downstream of the stall.
It is unlikely that the balance between translation initiation rate and impaired elongation is limited to EF-P-dependent stalls. Indeed, our computational modeling is not restricted to EF-P-dependent pauses and could be applied to any stall in translation elongation regardless of mechanism. The correlation between codon usage and gene expression is well described where highly expressed genes have a strong bias toward using codons that correspond to the most abundant tRNAs (8, 10, 12, 53, 54). Chu et al. (15) observed that the impact of slowly translated codons on protein synthesis could be modulated by altering the 5′-UTRs of reporter plasmids in yeast. Other studies have described a translation “ramp” wherein slow, nonpreferred codons are more abundant at the 5′ end of a coding region, and this is supported by ribosome profiling data where increased ribosome occupancy was observed at the 5′ end of ORFs (55, 56). It was also observed that the length of this slow ramp was significantly larger for transcripts with high ribosome densities, suggesting evolutionary pressure on highly expressed genes to prevent downstream ribosome jamming (15, 55–57). At various transcripts, such a ramp could also allow time for protein folding, for binding of cofactors to the N-terminal peptide, or for rare codons to affect the translation rate via blocking new ribosomes from binding the mRNA (14, 58–61). Cumulatively, these works support the interplay described in the present study between translation initiation rate and elongation stalls. This concept, demonstrated herein for EF-P-dependent pauses, can be readily modeled in silico and can be further applied to other forms of ribosome stalls.
Supplementary Material
Acknowledgments
We thank Dr. Leonard Foster for help with SILAC data analysis and Dr. Kurt Fredrick for helpful advice and discussion.
This work was supported, in whole or in part, by National Institutes of Health Grant GM065183. This work was also supported by Natural Sciences and Engineering Research Council of Canada Grant RGPIN 386286-10 (to W. W. N.) and a Vanier Canada Graduate Scholarship from Natural Sciences and Engineering Research Council of Canada (to S. J. H.).

This article contains supplemental Table S1.
- SD
- Shine-Dalgarno sequence
- EF-P
- elongation factor P
- SILAC
- stable isotope labeling of amino acids in cell culture.
REFERENCES
- 1. Laursen B. S., Sørensen H. P., Mortensen K. K., Sperling-Petersen H. U. (2005) Initiation of protein synthesis in bacteria. Microbiol. Mol. Biol. Rev. 69, 101–123 [DOI] [PMC free article] [PubMed] [Google Scholar]
- 2. Ma J., Campbell A., Karlin S. (2002) Correlations between Shine-Dalgarno sequences and gene features such as predicted expression levels and operon structures. J. Bacteriol. 184, 5733–5745 [DOI] [PMC free article] [PubMed] [Google Scholar]
- 3. Salis H. M., Mirsky E. A., Voigt C. A. (2009) Automated design of synthetic ribosome binding sites to control protein expression. Nat. Biotechnol. 27, 946–950 [DOI] [PMC free article] [PubMed] [Google Scholar]
- 4. Chen H., Bjerknes M., Kumar R., Jay E. (1994) Determination of the optimal aligned spacing between the Shine-Dalgarno sequence and the translation initiation codon of Escherichia coli mRNAs. Nucleic Acids Res. 22, 4953–4957 [DOI] [PMC free article] [PubMed] [Google Scholar]
- 5. Qing G., Xia B., Inouye M. (2003) Enhancement of translation initiation by A/T-rich sequences downstream of the initiation codon in. Escherichia coli. J. Mol. Microbiol. Biotechnol. 6, 133–144 [DOI] [PubMed] [Google Scholar]
- 6. Takahashi S., Furusawa H., Ueda T., Okahata Y. (2013) Translation enhancer improves the ribosome liberation from translation initiation. J. Am. Chem. Soc. 135, 13096–13106 [DOI] [PubMed] [Google Scholar]
- 7. Vimberg V., Tats A., Remm M., Tenson T. (2007) Translation initiation region sequence preferences in Escherichia coli. BMC Mol. Biol. 8, 100. [DOI] [PMC free article] [PubMed] [Google Scholar]
- 8. Fredrick K., Ibba M. (2010) How the sequence of a gene can tune its translation. Cell 141, 227–229 [DOI] [PMC free article] [PubMed] [Google Scholar]
- 9. Plotkin J. B., Kudla G. (2011) Synonymous but not the same: the causes and consequences of codon bias. Nat. Rev. Genet. 12, 32–42 [DOI] [PMC free article] [PubMed] [Google Scholar]
- 10. Buchan J. R., Stansfield I. (2007) Halting a cellular production line: responses to ribosomal pausing during translation. Biol. Cell 99, 475–487 [DOI] [PubMed] [Google Scholar]
- 11. Elf J., Nilsson D., Tenson T., Ehrenberg M. (2003) Selective charging of tRNA isoacceptors explains patterns of codon usage. Science 300, 1718–1722 [DOI] [PubMed] [Google Scholar]
- 12. Novoa E. M., Ribas de Pouplana L. (2012) Speeding with control: codon usage, tRNAs, and ribosomes. Trends Genet. 28, 574–581 [DOI] [PubMed] [Google Scholar]
- 13. Cannarozzi G., Schraudolph N. N., Faty M., von Rohr P., Friberg M. T., Roth A. C., Gonnet P., Gonnet G., Barral Y. (2010) A role for codon order in translation dynamics. Cell 141, 355–367 [DOI] [PubMed] [Google Scholar]
- 14. Ciandrini L., Stansfield I., Romano M. C. (2013) Ribosome traffic on mRNAs maps to gene ontology: genome-wide quantification of translation initiation rates and polysome size regulation. PLoS Comput. Biol. 9, e1002866. [DOI] [PMC free article] [PubMed] [Google Scholar]
- 15. Chu D., Kazana E., Bellanger N., Singh T., Tuite M. F., von der Haar T. (2014) Translation elongation can control translation initiation on eukaryotic mRNAs. EMBO J. 33, 21–34 [DOI] [PMC free article] [PubMed] [Google Scholar]
- 16. Kudla G., Murray A. W., Tollervey D., Plotkin J. B. (2009) Coding-sequence determinants of gene expression in Escherichia coli. Science 324, 255–258 [DOI] [PMC free article] [PubMed] [Google Scholar]
- 17. Goodman D. B., Church G. M., Kosuri S. (2013) Causes and effects of N-terminal codon bias in bacterial genes. Science 342, 475–479 [DOI] [PubMed] [Google Scholar]
- 18. Nakatogawa H., Ito K. (2001) Secretion monitor, SecM, undergoes self-translation arrest in the cytosol. Mol. Cell 7, 185–192 [DOI] [PubMed] [Google Scholar]
- 19. Yap M. N., Bernstein H. D. (2011) The translational regulatory function of SecM requires the precise timing of membrane targeting. Mol. Microbiol. 81, 540–553 [DOI] [PMC free article] [PubMed] [Google Scholar]
- 20. Nakatogawa H., Ito K. (2002) The ribosomal exit tunnel functions as a discriminating gate. Cell 108, 629–636 [DOI] [PubMed] [Google Scholar]
- 21. Wilson D. N., Beckmann R. (2011) The ribosomal tunnel as a functional environment for nascent polypeptide folding and translational stalling. Curr. Opin. Struct. Biol. 21, 274–282 [DOI] [PubMed] [Google Scholar]
- 22. Tanner D. R., Cariello D. A., Woolstenhulme C. J., Broadbent M. A., Buskirk A. R. (2009) Genetic identification of nascent peptides that induce ribosome stalling. J. Biol. Chem. 284, 34809–34818 [DOI] [PMC free article] [PubMed] [Google Scholar]
- 23. Ito K., Chiba S., Pogliano K. (2010) Divergent stalling sequences sense and control cellular physiology. Biochem. Biophys. Res. Commun. 393, 1–5 [DOI] [PMC free article] [PubMed] [Google Scholar]
- 24. Giudice E., Gillet R. (2013) The task force that rescues stalled ribosomes in bacteria. Trends Biochem. Sci. 38, 403–411 [DOI] [PubMed] [Google Scholar]
- 25. Pavlov M. Y., Watts R. E., Tan Z., Cornish V. W., Ehrenberg M., Forster A. C. (2009) Slow peptide bond formation by proline and other N-alkylamino acids in translation. Proc. Natl. Acad. Sci. U.S.A. 106, 50–54 [DOI] [PMC free article] [PubMed] [Google Scholar]
- 26. Ude S., Lassak J., Starosta A. L., Kraxenberger T., Wilson D. N., Jung K. (2013) Translation elongation factor EF-P alleviates ribosome stalling at polyproline stretches. Science 339, 82–85 [DOI] [PubMed] [Google Scholar]
- 27. Doerfel L. K., Wohlgemuth I., Kothe C., Peske F., Urlaub H., Rodnina M. V. (2013) EF-P Is essential for rapid synthesis of proteins containing consecutive proline residues. Science 339, 85–88 [DOI] [PubMed] [Google Scholar]
- 28. Gutierrez E., Shin B. S., Woolstenhulme C. J., Kim J. R., Saini P., Buskirk A. R., Dever T. E. (2013) eIF5A promotes translation of polyproline motifs. Mol. Cell. 51, 35–45 [DOI] [PMC free article] [PubMed] [Google Scholar]
- 29. Hersch S. J., Wang M., Zou S. B., Moon K. M., Foster L. J., Ibba M., Navarre W. W. (2013) Divergent protein motifs direct elongation factor P-mediated translational regulation in Salmonella enterica and Escherichia coli. mBio. 4, e00180-13. [DOI] [PMC free article] [PubMed] [Google Scholar]
- 30. Peil L., Starosta A. L., Lassak J., Atkinson G. C., Virumäe K., Spitzer M., Tenson T., Jung K., Remme J., Wilson D. N. (2013) Distinct XPPX sequence motifs induce ribosome stalling, which is rescued by the translation elongation factor EF-P. Proc. Natl. Acad. Sci. U.S.A. 110, 15265–15270 [DOI] [PMC free article] [PubMed] [Google Scholar]
- 31. Hanawa-Suetsugu K., Sekine S., Sakai H., Hori-Takemoto C., Terada T., Unzai S., Tame J. R., Kuramitsu S., Shirouzu M., Yokoyama S. (2004) Crystal structure of elongation factor P from Thermus thermophilus HB8. Proc. Natl. Acad. Sci. U.S.A. 101, 9595–9600 [DOI] [PMC free article] [PubMed] [Google Scholar]
- 32. Choi S., Choe J. (2011) Crystal structure of elongation factor P from Pseudomonas aeruginosa at 1.75 Å resolution. Proteins 79, 1688–1693 [DOI] [PubMed] [Google Scholar]
- 33. Zou S. B., Roy H., Ibba M., Navarre W. W. (2011) Elongation factor P mediates a novel post-transcriptional regulatory pathway critical for bacterial virulence. Virulence 2, 147–151 [DOI] [PMC free article] [PubMed] [Google Scholar]
- 34. Roy H., Zou S. B., Bullwinkle T. J., Wolfe B. S., Gilreath M. S., Forsyth C. J., Navarre W. W., Ibba M. (2011) The tRNA synthetase paralog PoxA modifies elongation factor-P with (R)-β-lysine. Nat. Chem. Biol. 7, 667–669 [DOI] [PMC free article] [PubMed] [Google Scholar]
- 35. Peil L., Starosta A. L., Virumäe K., Atkinson G. C., Tenson T., Remme J., Wilson D. N. (2012) Lys34 of translation elongation factor EF-P is hydroxylated by YfcM. Nat. Chem. Biol. 8, 695–697 [DOI] [PubMed] [Google Scholar]
- 36. Bullwinkle T. J., Zou S. B., Rajkovic A., Hersch S. J., Elgamal S., Robinson N., Smil D., Bolshan Y., Navarre W. W., Ibba M. (2013) (R)-β-Lysine-modified elongation factor P functions in translation elongation. J. Biol. Chem. 288, 4416–4423 [DOI] [PMC free article] [PubMed] [Google Scholar]
- 37. Navarre W. W., Zou S. B., Roy H., Xie J. L., Savchenko A., Singer A., Edvokimova E., Prost L. R., Kumar R., Ibba M., Fang F. C. (2010) PoxA, YjeK, and elongation factor P coordinately modulate virulence and drug resistance in Salmonella enterica. Mol. Cell. 39, 209–221 [DOI] [PMC free article] [PubMed] [Google Scholar]
- 38. Zou S. B., Hersch S. J., Roy H., Wiggers J. B., Leung A. S., Buranyi S., Xie J. L., Dare K., Ibba M., Navarre W. W. (2012) Loss of elongation factor P disrupts bacterial outer membrane integrity. J. Bacteriol. 194, 413–425 [DOI] [PMC free article] [PubMed] [Google Scholar]
- 39. Senior A. E. (1990) The proton-translocating ATPase of Escherichia coli. Annu. Rev. Biophys. Biophys. Chem. 19, 7–41 [DOI] [PubMed] [Google Scholar]
- 40. von Ballmoos C., Cook G. M., Dimroth P. (2008) Unique rotary ATP synthase and its biological diversity. Annu. Rev. Biophys. 37, 43–64 [DOI] [PubMed] [Google Scholar]
- 41. Elgamal S., Katz A., Hersch S. J., Newsom D., White P., Navarre W. W., Ibba M. (2014) EF-P dependent pauses integrate proximal and distal signals during translation. PLoS Genet. 10, e1004553. [DOI] [PMC free article] [PubMed] [Google Scholar]
- 42. Corcoran C. P., Podkaminski D., Papenfort K., Urban J. H., Hinton J. C., Vogel J. (2012) Superfolder GFP reporters validate diverse new mRNA targets of the classic porin regulator, MicF RNA. Mol. Microbiol. 84, 428–445 [DOI] [PubMed] [Google Scholar]
- 43. Urban J. H., Vogel J. (2009) A green fluorescent protein (GFP)-based plasmid system to study post-transcriptional control of gene expression in vivo. Methods Mol. Biol. 540, 301–319 [DOI] [PubMed] [Google Scholar]
- 44. Pédelacq J. D., Cabantous S., Tran T., Terwilliger T. C., Waldo G. S. (2006) Engineering and characterization of a superfolder green fluorescent protein. Nat. Biotechnol. 24, 79–88 [DOI] [PubMed] [Google Scholar]
- 45. Gibson D. G., Young L., Chuang R. Y., Venter J. C., Hutchison C. A., 3rd, Smith H. O. (2009) Enzymatic assembly of DNA molecules up to several hundred kilobases. Nat. Methods 6, 343–345 [DOI] [PubMed] [Google Scholar]
- 46. Baba T., Ara T., Hasegawa M., Takai Y., Okumura Y., Baba M., Datsenko K. A., Tomita M., Wanner B. L., Mori H. (2006) Construction of Escherichia coli K-12 in-frame, single-gene knockout mutants: the Keio collection. Mol. Syst. Biol. 2, 2006.0008. [DOI] [PMC free article] [PubMed] [Google Scholar]
- 47. Datsenko K. A., Wanner B. L. (2000) One-step inactivation of chromosomal genes in Escherichia coli K-12 using PCR products. Proc. Natl. Acad. Sci. U.S.A. 97, 6640–6645 [DOI] [PMC free article] [PubMed] [Google Scholar]
- 48. Sussman J. K., Simons E. L., Simons R. W. (1996) Escherichia coli translation initiation factor 3 discriminates the initiation codon in vivo. Mol. Microbiol. 21, 347–360 [DOI] [PubMed] [Google Scholar]
- 49. Voss N. R., Gerstein M., Steitz T. A., Moore P. B. (2006) The geometry of the ribosomal polypeptide exit tunnel. J. Mol. Biol. 360, 893–906 [DOI] [PubMed] [Google Scholar]
- 50. Lu P., Vogel C., Wang R., Yao X., Marcotte E. M. (2007) Absolute protein expression profiling estimates the relative contributions of transcriptional and translational regulation. Nat. Biotechnol. 25, 117–124 [DOI] [PubMed] [Google Scholar]
- 51. Shah P., Ding Y., Niemczyk M., Kudla G., Plotkin J. (2013) Rate-limiting steps in yeast protein translation. Cell 153, 1589–1601 [DOI] [PMC free article] [PubMed] [Google Scholar]
- 52. Goldman E., Rosenberg A. H., Zubay G., Studier F. W. (1995) Consecutive low-usage leucine codons block translation only when near the 5′ end of a message in. Escherichia coli. J. Mol. Biol. 245, 467–473 [DOI] [PubMed] [Google Scholar]
- 53. Ikemura T. (1985) Codon usage and tRNA content in unicellular and multicellular organisms. Mol. Biol. Evol. 2, 13–34 [DOI] [PubMed] [Google Scholar]
- 54. Stoletzki N., Eyre-Walker A. (2007) Synonymous codon usage in Escherichia coli: selection for translational accuracy. Mol. Biol. Evol. 24, 374–381 [DOI] [PubMed] [Google Scholar]
- 55. Ingolia N. T., Ghaemmaghami S., Newman J. R., Weissman J. S. (2009) Genome-wide analysis in vivo of translation with nucleotide resolution using ribosome profiling. Science 324, 218–223 [DOI] [PMC free article] [PubMed] [Google Scholar]
- 56. Tuller T., Carmi A., Vestsigian K., Navon S., Dorfan Y., Zaborske J., Pan T., Dahan O., Furman I., Pilpel Y. (2010) An evolutionarily conserved mechanism for controlling the efficiency of protein translation. Cell 141, 344–354 [DOI] [PubMed] [Google Scholar]
- 57. Angov E. (2011) Codon usage: Nature's roadmap to expression and folding of proteins. Biotechnol. J. 6, 650–659 [DOI] [PMC free article] [PubMed] [Google Scholar]
- 58. Kemp A. J., Betney R., Ciandrini L., Schwenger A. C., Romano M. C., Stansfield I. (2013) A yeast tRNA mutant that causes pseudohyphal growth exhibits reduced rates of CAG codon translation. Mol. Microbiol. 87, 284–300 [DOI] [PMC free article] [PubMed] [Google Scholar]
- 59. Chartier M., Gaudreault F., Najmanovich R. (2012) Large-scale analysis of conserved rare codon clusters suggests an involvement in co-translational molecular recognition events. Bioinformatics 28, 1438–1445 [DOI] [PMC free article] [PubMed] [Google Scholar]
- 60. Zhang G., Hubalewska M., Ignatova Z. (2009) Transient ribosomal attenuation coordinates protein synthesis and co-translational folding. Nat. Struct. Mol. Biol. 16, 274–280 [DOI] [PubMed] [Google Scholar]
- 61. Oh E., Becker A. H., Sandikci A., Huber D., Chaba R., Gloge F., Nichols R. J., Typas A., Gross C. A., Kramer G., Weissman J. S., Bukau B. (2011) Selective ribosome profiling reveals the cotranslational chaperone action of trigger factor in vivo. Cell 147, 1295–1308 [DOI] [PMC free article] [PubMed] [Google Scholar]
Associated Data
This section collects any data citations, data availability statements, or supplementary materials included in this article.