

Abstract
Conventional haemodynamic analysis of pulmonary venous and left atrial (LA) pressure waveforms yields substantial forward and backward waves throughout the cardiac cycle; the reservoir wave model provides an alternative analysis with minimal waves during diastole. Pressure and flow in a single pulmonary vein (PV) and the main pulmonary artery (PA) were measured in anaesthetized dogs and the effects of hypoxia and nitric oxide, volume loading, and positive-end expiratory pressure (PEEP) were observed. The reservoir wave model was used to determine the reservoir contribution to PV pressure and flow. Subtracting reservoir pressure and flow resulted in ‘excess’ quantities which were treated as wave-related. Wave intensity analysis of excess pressure and flow quantified the contributions of waves originating upstream (from the PA) and downstream (from the LA and/or left ventricle (LV)). Major features of the characteristic PV waveform are caused by sequential LA and LV contraction and relaxation creating backward compression (i.e. pressure-increasing) waves followed by decompression (i.e. pressure-decreasing) waves. Mitral valve opening is linked to a backwards decompression wave (i.e. diastolic suction). During late systole and early diastole, forward waves originating in the PA are significant. These waves were attenuated less with volume loading and delayed with PEEP. The reservoir wave model shows that the forward and backward waves are negligible during LV diastasis and that the changes in pressure and flow can be accounted for by the discharge of upstream reservoirs. In sharp contrast, conventional analysis posits forward and backward waves such that much of the energy of the forward wave is opposed by the backward wave.
Key points
In pressure flow data from a pulmonary vein, we use the reservoir wave model to separate the effects of an elastic venous reservoir from the effects of waves created by the heart.
Wave intensity analysis was used to separate the effects of waves generated upstream by the right ventricle from the effects of waves generated downstream by the left atrium and left ventricle.
Most waves are created by the left atrium and left ventricle and can be linked to events that occur during the cardiac cycle.
Waves transmitted through the pulmonary circulation are attenuated less when blood volume is increased but are attenuated more and delayed when the lungs are expanded.
The drainage of pulmonary arterial and venous reservoirs are responsible for substantial changes in measured pulmonary venous pressure and flow but waves are associated with the conventional landmarks of these characteristic waveforms.
Introduction
Conventional approaches to the analysis of pressure and flow in vascular systems generally treat these measurements as combinations of incident waves created by the heart and reflections of these waves, biased by their mean values (Westerhof et al. 1972; Hughes & Parker, 2009). The reservoir wave model is based on the concept that pressure and flow are composed of volume-related reservoir (or windkessel) components and wave-related ‘excess’ components. The reservoir wave model (Tyberg et al. 2014) has been used successfully in several circumstances to analyse vascular systems (Wang et al. 2003, 2006, 2008, 2011, 2013; Flewitt et al. 2007; Davies et al. 2010) and provides an alternative understanding of pulmonary vascular haemodynamics (Bouwmeester et al. 2014). The reservoir wave model is based on a two-element windkessel (Frank, 1899; Sagawa et al. 1990) that, when applied to the pulmonary circulation, is modified to take account of fact that pulmonary arterial and venous pressure do not decline to zero (Bouwmeester et al. 2013). Once the reservoir pressure and flow components are defined, they are subtracted and the resulting excess pressure and excess flow are analysed using wave intensity analysis (WIA) (Parker & Jones, 1990).
We used the reservoir wave model to determine if current concepts of the genesis of the pulmonary venous pressure (PPV) waveform satisfactorily explain the observed patterns. A wave is a propagating disturbance that changes pressure and velocity/flow (Lighthill, 1978). We define ‘wave’ specifically and consider each heartbeat to be an isolated event. In our view, the prototypical wave is the forward-going, pressure- and flow-increasing wave (forward compression wave) that the left ventricle (LV) generates in the aorta during early ejection (Parker et al. 1988; Wang et al. 2003). Our observations confirm much of what is believed to be responsible for the observed pressure waveforms but also provide some novel insights into their genesis. In particular, the reservoir wave model shows that the forward and backward waves are negligible during LV diastasis and that the changes in pressure and flow can be accounted for by the discharge of upstream reservoirs. In sharp contrast, conventional analysis posits forward and backward waves such that much of the energy of the forward waves is opposed by the backward waves.
Methods
Animal preparation
The University of Calgary animal care committee granted ethical approval for all experimental protocols. Anaesthesia was induced in 11 mongrel dogs (seven male; 18–28 kg; mean 22 kg) with an initial iv injection of 25 mg kg−1 sodium thiopental. Anaesthesia was maintained with an infusion of fentanyl (20–30 μg kg−1 h–1) and midazolam (0.01–0.015 μg kg−1 h–1). The dogs were ventilated using a constant-volume respirator (model 607, Harvard Apparatus Inc., Natick, MA, USA) with a 50% O2, 50% nitrous oxide gas mixture during surgery and with 100% O2 during experimentation. The respiratory rate (16–18 breaths min−1) and tidal volume (15 ml kg−1) were adjusted to maintain physiological arterial blood gas levels ( = 35–45 mmHg) and pH (7.2–7.4) (Mitchell et al. 2011). Body temperature was kept at 37°C by using a circulating warm water blanket and heat lamp when necessary; a bladder catheter was inserted into the urethra to collect urine. At the conclusion of the experiments, while deeply anaesthetized, the dogs were killed with an intracardiac injection of KCl.
The experimental procedure and instrumentation have been described previously (Bouwmeester et al. 2013, 2014). Briefly, pressure was measured in the right ventricle (RV), LV and left atrium (LA) with 7-F catheters with lumens (Scisense Inc., London, ON, Canada) and in the main pulmonary artery (PA) and a pulmonary vein (PV) with 3.5-F catheters without lumens (Millar Instruments Inc., Houston, TX, USA). The PA catheter was inserted through the anterior wall of the RV and advanced approximately 1 cm beyond the pulmonary valve. The PV catheter was placed in the left superior PV, approximately 1 cm upstream of the LA. Flow probes (A- and S-Series models and flowmeter model T206; Transonic Systems, Ithaca, NY, USA) were placed on the main PA (immediately downstream of the tip of the PA catheter) and the PV (immediately upstream of the tip of the PV catheter). A four-limb-lead electrocardiogram (ECG) was also recorded. After instrumentation was complete, the pericardium was reapproximated with interrupted loose sutures (Scott-Douglas et al. 1991).
Electronic signals were sampled at 400 Hz with data acquisition software (Sonometric Corp., London, ON, Canada) and preliminary data analysis of measured pressure and flow signals was performed using CV Works software (AccuDAQ Inc., Calgary, AB, Canada).
Figure 1 shows a representative example of the measured PPV, LA pressure (PLA), LV pressure (PLV) and flow measured in a single PV (QPV), in relation to the ECG. The common landmarks are labelled (i.e. a, c and v waves; x and y descents), as well as the timings of mitral valve closing (MC) and opening (MO), which are identified by the crossover of PLV and PLA.
Figure 1. Typical measurements of pressure and flow in a single pulmonary vein.
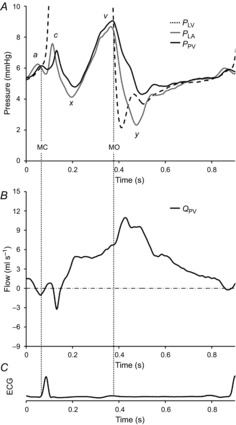
A, left ventricular pressure (PLV), left atrial pressure (PLA) and pulmonary venous pressure (PPV). Vertical dotted lines indicate mitral valve opening (MO) and closing (MC), as defined by the crossover of PLV and PLA; a, c and v waves and the x and y descents are indicated with respect to PLA and PPV. B, measured pulmonary venous flow (QPV). C, ECG shown for temporal reference.
Experimental protocol
The overall experimental protocol is described elsewhere (Bouwmeester et al. 2013, 2014). Briefly, volume loading was assessed by mean PPV, which was sequentially increased with an infusion of a 10% pentastarch solution (Pentaspan; Bristol-Myers Squibb Canada, Montreal, QC, Canada) to achieve low (∼5 mmHg), medium (∼9 mmHg) and high (∼14 mmHg) filling pressures. At each level, three ventilation regimens were followed: (1) 100% O2, (2) hypoxia and (3) hypoxia plus nitric oxide. Ventilation with 100% O2 was used as a baseline; hypoxia was effected by adding N2 to the inspired gas mixture until  was less than 50 mmHg. While sustaining hypoxic ventilation, nitric oxide was added (80 p.p.m.) to the inspired gas mixture (INOvent delivery system, Datex-Ohmeda, Helsinki, Finland). At each ventilation state, recordings were taken at 0 and 10 cmH2O positive-end expiratory pressure (PEEP), the order of which was random.
During experimentation, the chest remained open to allow access to the measuring devices that sometimes required adjustment. Recordings were taken under steady-state conditions with the ventilator turned off at end-expiration. After 20–30 s of recording, a bolus injection of acetylcholine (0.01–0.02 mg kg−1) in saline solution was given directly into the LV. This produced a diastolic pause of 1–2 s that was used to determine the parameters of the reservoir model more robustly.
Reservoir wave analysis
Flow measured in the PA (QPA) was used to scale the measured PV flow (QPV). QPV was measured in a single PV, which constituted only a fraction of total PV outflow (Qout). Therefore, to determine the lumped venous reservoir parameters with Qout, it was necessary to scale QPV appropriately to represent flow through all PVs. QPV was multiplied by a venous scaling factor (VSF) to yield Qout (Qout = VSF × QPV). The VSF was determined by the value at which mean Qout equalled mean QPA, averaged over a cardiac cycle.
The pulmonary venous reservoir model used by Bouwmeester et al. (2013) based on earlier work (Wang et al. 2006) was used to describe the PV reservoir pressure (Pres) as follows:
 |
(1) |
| (2) |
Inflow (Qin) to the venous reservoir represents the flow provided to the veins from the pulmonary capillaries, which is much more difficult to measure and was therefore modelled by (1), where P∞ is the elevated, upstream venous zero-flow pressure and R represents the lumped resistance to flow through the reservoir. Equation (2) represents the solution to eqn (1), where P0 and t0 represent the time and PPV before atrial contraction and R, C and P∞ are the venous reservoir parameters.
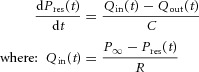
To solve eqn (2), venous reservoir parameters were assumed to be constant over the range of measured PPV. Pres was determined from experimental measurements of PPV and Qout by fitting the data during diastasis as shown in Fig. 2. Initial estimates of reservoir parameters (i.e. R = 10 mmHg s ml−1, C = 0.5 ml mmHg−1 and P∞ = end diastolic PPV) were made and Pres was calculated throughout a complete cardiac cycle. The initial estimates were arbitrary and appropriate values for reservoir parameters were calculated using an algorithm developed in Matlab (Mathworks, Natick, MA, USA) employing the function ‘fminsearch’ (Nelder-Mead simplex algorithm) to vary these parameters iteratively to minimize the mean-squared error between the calculated Pres and PPV during the fitting period. The result of this procedure is illustrated by the waveform of Pres in Fig. 2A, where Pres matches PPV throughout the fitting period (i.e. LV diastasis).
Figure 2. Reservoir wave analysis of pulmonary venous pressure and flow.
A, measured pulmonary venous pressure (PPV), modelled reservoir pressure (Pres) and asymptotic pressure (P∞). B, total pulmonary venous outflow (Qout), modelled reservoir inflow (Qin) and calculated reservoir flow (Qres). In this example: Qres = 0.67 × Qout. C, the result of subtracting Pres from PPV is excess pressure (Pexcess) and the result of subtracting Qres from Qout is excess flow (Qexcess). Vertical dotted lines indicate mitral valve opening (MO) and closing (MC).
Just as Pres was used to account for the filling of the venous reservoir during the diastolic rise in PPV, a similar subtraction of upstream reservoir discharge from measured flow during diastole was necessary. As shown in Fig. 2B, the magnitude of Qout was substantial during diastole. Its exponential decrease was attributed to the discharge of the upstream PA and PV reservoirs, which was identified (post hoc) as reservoir flow (Qres). The first step in determining Qres was to calculate the inflow to the PV reservoir (Qin), as described by eqn (1). With Qin defined throughout the cardiac cycle, Qres was determined by taking a fraction of Qin (Qres = K × Qin; where: 0 < K < 1), which was determined when the error between Qres and Qout during diastasis was minimized.
Excess pressure (Pexcess) and flow (Qexcess) waveforms are shown in Fig. 2C. The reservoir component was subtracted from both PPV and Qout, resulting in Pexcess and Qexcess (Pexcess = PPV − Pres; Qexcess = Qout − Qres), Qexcess representing the total PV excess flow. However, for the purposes of WIA it was necessary to analyse excess pressure and velocity at a single location (i.e. a single PV), and therefore Qexcess was divided by the VSF. Thus, excess mean blood velocity (Uexcess) was calculated as follows: Uexcess = Qex/(VSF × A); the cross-sectional area of the vessel (A) was estimated from the diameter of the flow probe.
Wave intensity analysis
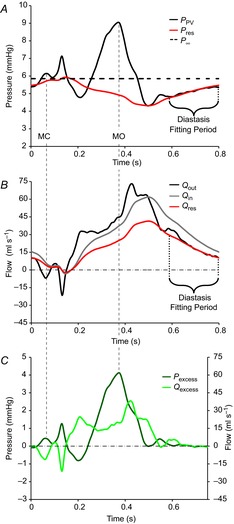
WIA defines four types of waves that have different effects on pressure and velocity and, in the context of this study, account for Pexcess and Uexcess. The forward direction is defined as the direction of net blood flow and waves might either increase (compression waves) or decrease (decompression waves) pressure as they pass. Thus, there are forward (FCW) or backward (BCW) compression waves and forward (FDW) or backward (BDW) decompression waves. In this study, the LA and LV generate backward waves and the RV generates forward waves, which are transmitted across the pulmonary circulation. Forward waves can be separated from backward waves if the local wave speed is known (Parker, 2009), which in this study was calculated using the sum-of-squares, single-point method (Davies et al. 2006). WIA of Pexcess and Uexcess is shown in Fig. 3A, where excess wave intensity (WIexcess) is decomposed into the intensities of forward- and backward-going waves (WIforward and WIbackward, respectively). To quantify the pressure effects of these waves, the incremental pressure changes of forward- and backward-going waves were integrated (Pforward and Pbackward, respectively) as shown in Fig. 3B, where the onsets of each unique backward wave are identified.
Figure 3. Wave intensity analysis of wave-related excess pressure and flow/velocity.
A, net wave intensity (WIexcess) was calculated from Pexcess and Qexcess (Fig. 2C) and is decomposed into forward (WIforward) and backward (WIbacward) components. B, Pexcess is decomposed into the contributions of forward- (Pforward) and backward-going (Pbackward) waves. The onset of backward compression waves (BCW) and backward decompression waves (BDW) are labelled and a, c and v waves and x and y descents are indicated with respect to Pexcess. Vertical dotted lines indicate mitral valve opening (MO) and closing (MC).
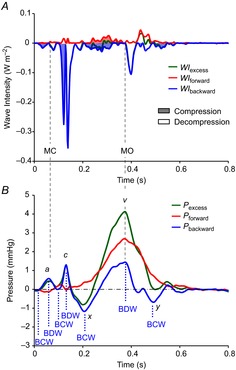
The origin of the forward waves measured in the PV can be traced back to the PA and the waveforms shown in Fig. 4 demonstrate how this was quantified. Following procedures that have been described previously (Bouwmeester et al. 2014), PA reservoir pressure was defined using the arterial reservoir wave model (Wang et al. 2003). In Fig. 4A, PA excess pressure (Pexcess−PA) was decomposed into PA forward- and backward-going components (Pforward−PA and Pbackward−PA, respectively) and in Fig. 4B, PV excess pressure (Pexcess−PV) was decomposed into PV forward- and backward-going components (Pforward−PV and Pbackward−PV, respectively). In both these panels, the onsets of forward-going waves are labelled (i.e. FCW and FDW); forward waves appear in the PA and, after some transmission time (Δt), in the PV. Δt was defined by the time shift of Pforward−PA (with respect to Pforward−PV) that maximized the R2 value resulting from linear regression of Pforward−PV vs. time-shifted Pforward−PA shown in Fig. 4C. The slope of the linear regression line provides an estimate of forward-going wave attenuation between PA and PV, expressed as a percentage: attenuation = (1 − slope) × 100.
Figure 4. Forward wave transmission from pulmonary artery to vein.
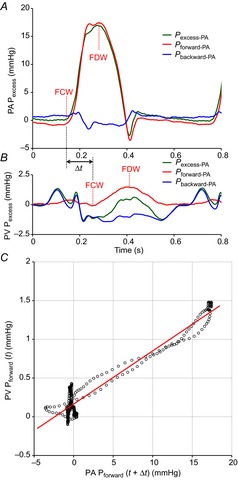
A, from measurements made in the main PA, excess pressure (Pexcess-PA) is decomposed into the contributions of forward- (Pforward-PA) and backward-going (Pbackward-PA) waves. B, from measurements made in a PV; Pexcess-PV, Pforward-PV and Pbackward-PV. In both panels, the onsets of forward compression waves (FCW) and forward decompression waves (FDW) are labelled. C, the transmission time (Δt) of forward waves from PA to PV was determined by time-shifting Pforward-PA with respect to Pforward-PV until the R2 value, determined from linear regression, was maximized. The slope of the line provides an estimate of forward wave attenuation. In this figure, Δt = 131 ms, R2 = 0.94 and the slope = 0.07 (i.e. attenuation = 93%).
Statistical analysis
All data were analysed with SigmaPlot software (Systat Software Inc., San Jose, CA, USA). Three-way analysis of variance (ANOVA) was used to analyse the effects of volume load, PEEP and ventilation (Table 1). Due to incomplete data, the results in this table are presented as least-squared mean values (estimated using a general linear model), ± the standard error of the mean (SEM). For all statistical tests, the significance level was set at 0.05. Pairwise multiple comparisons were made with the Bonferroni method.
Table 1.
Pulmonary venous reservoir parameters and wave analysis results
| Low volume | Medium volume | High volume | PEEP 0 cmH2O | PEEP 10 cmH2O | 100% O2 | Hypoxia | Nitric oxide | |
|---|---|---|---|---|---|---|---|---|
| Reservoir parameters | ||||||||
| R (mmHg·s ml–1) | 0.08 ± 0.01‡ | 0.07 ± 0.01 | 0.05 ± 0.01‡ | 0.07 ± 0.01 | 0.06 ± 0.01 | 0.05 ± 0.01 | 0.08 ± 0.01 | 0.06 ± 0.01 |
| C (mL mmHg–1) | 1.67 ± 0.19 | 1.56 ± 0.21 | 1.68 ± 0.24 | 1.70 ± 0.17 | 1.57 ± 0.18 | 1.87 ± 0.20 | 1.45 ± 0.22 | 1.59 ± 0.23 |
| P∞ (mmHg) | 7.3 ± 0.2*‡ | 11.6 ± 0.3*† | 16.0 ± 0.3†‡ | 12.0 ± 0.2 | 11.3 ± 0.2 | 10.9 ± 0.3¶ | 11.7 ± 0.3 | 12.3 ± 0.3¶ |
| K (%) (K = 100 × Qres/Qin) | 73 ± 1*‡ | 64 ± 2* | 57 ± 3‡ | 63 ± 2 | 66 ± 2 | 63 ± 2 | 66 ± 2 | 65 ± 2 |
| Wave analysis | ||||||||
| Wave speed (m s–1) | 3.3 ± 0.2 | 3.2 ± 0.2 | 3.0 ± 0.3 | 3.2 ± 0.2 | 3.2 ± 0.2 | 3.2 ± 0.2 | 3.2 ± 0.2 | 3.2 ± 0.2 |
| Forward wave Δt (ms) | 161 ± 4* | 175 ± 4* | 172 ± 7 | 155 ± 4 | 183 ± 4 | 163 ± 5 | 176 ± 5 | 168 ± 5 |
| Forward wave zattenuation (%) | 91 ± 0*‡ | 87 ± 1*† | 84 ± 1†‡ | 86 ± 1 | 88 ± 1 | 87 ± 1 | 88 ± 1 | 86 ± 1 |
Values represent least-squared mean values ± SEM and statistical results from three-way ANOVA.
Bold numbers indicate significant (P < 0.05) differences within each volume load, PEEP and ventilation group.
Within volume load, significant (P < 0.05) pairwise Bonferroni comparisons are indicated: *Low vs. Medium, †Medium vs. High, and ‡Low vs. High.
Within ventilation, significant (P < 0.05) pairwise Bonferroni comparisons are indicated: §100 O2 vs. Hypoxia, +Hypoxia vs. Nitric oxide, and ¶100% O2 vs. Nitric oxide.
Results
The Pres and Qres waveforms shown in Fig. 2 are determined by the PV reservoir parameters (i.e. R, C, P∞ and K) listed in Table 1. This table shows the results of three-way ANOVA applied to PV reservoir parameters and results from WIA. The results are organized into overlapping groups to show the effects of volume loading, PEEP and ventilation condition. None of the interventions had a significant effect on the VSF used to calculate Qout and therefore the mean value is 6.4 ± 0.7.
The data shown in Figs 3 and 6 all come from the same experiment and provide a clear example of a relatively long period of diastasis. Figures 4 and 5 each display data from different experiments and demonstrate the variability in heart rate, the length of diastasis, and the resulting Pforward and Pbackward waveforms. All the figures show experimental conditions during low volume, 0 cmH2O PEEP and 100% O2 ventilation to facilitate comparison.
Figure 6. Reservoir wave versus conventional wave analysis.
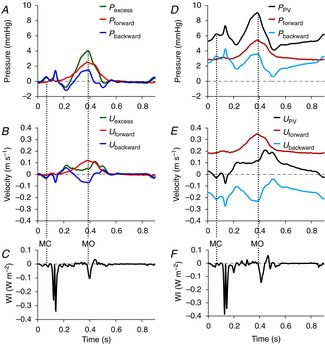
This figure indicates the importance of subtracting reservoir pressure and velocity from the measured values before analysing wave motion. The left-hand panels (A–C) show the results of these subtractions; there are no substantial waves during diastasis. The right-hand panels (D–E) show the results without these subtractions; there are substantial additive pressure waves and opposing flow waves during diastasis. In all panels, both pressure and velocity are decomposed into the contributions of forward- (Pforward/Uforward) and backward-going waves (Pbackward/Ubackward). The left-hand panels show the decomposition of excess pressure (Pexcess; A) and excess velocity (Uexcess; B) and net excess wave intensity (C), while the right-hand panels show the decomposition of measured pulmonary venous pressure (PPV; D) and pulmonary venous velocity (UPV; E) and net wave intensity (F). For temporal orientation, vertical dotted lines indicate mitral valve opening (MO) and closing (MC). (NB. The crossover of left ventricular and left atrial pressure is not shown here but is demonstrated in Fig. 1.)
Figure 5. Variable effects of backward waves and the effect of increased heart rate.
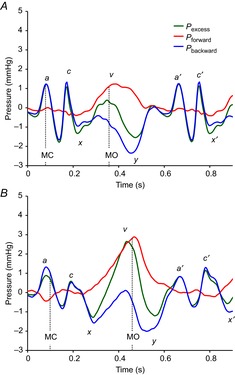
Two examples, from separate animals, of PV excess pressure (Pexcess) are decomposed into the contributions of forward- (Pforward) and backward-going (Pbackward) waves; a, c and v waves and x and y descents are indicated with respect to Pexcess; a′, c′ and x′ show the landmarks of the next cardiac cycle. In both panels heart rate is 103 b.p.m. For temporal orientation, vertical dotted lines indicate mitral valve opening (MO) and closing (MC). (NB. The crossover of left ventricular and left atrial pressure is not shown here but is demonstrated in Fig. 1.)
BCWs make variable contributions to the v wave. Note the relatively large BCW contribution in Fig. 3B where the heart rate is 73 b.p.m. and a negligible contribution in Fig. 4B where heart rate is 95 b.p.m. The two examples shown in Fig. 5 demonstrate the variability of backward waves, the contributions of Pbackward during the v wave and the effect that increased heart rate has on shortening diastasis. In Fig. 5, diastasis is comparatively short (A) and effectively disappears (B), even though in both panels the heart rate is 103 b.p.m.
Discussion
We used the reservoir wave model (Wang et al. 2003, 2006) to investigate the genesis of the pulmonary venous pressure waveform, which is very similar to the left atrial waveform. Using conventional impedance analysis, it has been assumed that the perturbations in pulmonary venous pressure and flow are caused only by waves. However, when we used the reservoir wave model and analysed waves on the basis of wave-related ‘excess’ pressure and flow, it became apparent that the genesis of these waveforms is more complex than generally appreciated. According to the reservoir wave model, we conclude that the substantial changes in measured pulmonary venous pressure and flow during diastasis are entirely consistent with the discharge of the upstream pulmonary artery and venous reservoirs and are not due to ‘waves’.
Transmission of waves through the pulmonary circulation
Figure 4 demonstrates that the FCW and FDW generated by RV ejection were transmitted through the pulmonary circulation. These forward waves arrived during late systole/early diastole in the PV and can contribute substantially to the upslope and downslope of the v wave. As shown in Table 1, the transmission delay depends on the intervention and generally corresponds to the upper limit of the transmission times (80–160 ms (Wiener et al. 1966; Pinkerson, 1967), 90–140 ms (Morkin et al. 1965) and 88–108 ms (Hollander et al. 2004)) found with other methods. The data suggest that the degree of attenuation and transmission time depend on the state of the pulmonary circulation. Consistent with decreased pulmonary vascular resistance (Bouwmeester et al. 2013), forward waves are attenuated less with volume loading. Maloney et al. (1968) postulated that delays in forward wave transmission may be introduced by the opening and closing process of collapsed vessels. We speculate that the collapse of some pulmonary blood vessels with the application of PEEP leads to greater attenuation and transmission time of forward waves.
Genesis of the a and c waves
By quantifying wave-related excess pressure and flow, features of the characteristic pulmonary venous pressure waveform can be described in terms of waves, as defined by WIA specifically. In keeping with expectations, the model confirmed that the a wave is the result of a pair of sequential backward waves (i.e. BCW followed by a BDW), attributed to LA contraction and relaxation, respectively (Ankeney et al. 1956; Hobson et al. 2007). The rise in pressure observed with the c wave is a result of a BCW arising from LV contraction and the process of mitral valve closure, including the potential bulging of the leaflets into the LA. The decline in pressure is a result of a BDW generally attributed to the descent of the mitral annulus towards the apex during early systole and the effective increase of LA volume with a closed mitral valve (Nixon & Polis, 1962; Nolan et al. 1969; Keren et al. 1988).
Genesis of the v wave
We were able to provide new insights into the genesis of the v wave. The combined effects of FCWs (originating in the main PA and travelling through the pulmonary circulation) and, to a variable degree, BCWs (probably originating in the LA) contribute to the upslope of the v wave. The downslope of the v wave, at the beginning of diastole, is predominantly due to a BDW, the manifestation of ‘diastolic suction’ (MacRae et al. 1997; Wang et al. 2005), while FDWs also contribute during this time.
In some experiments (see Figs 3B and 5B), a BCW also contributed substantially to the upslope of the v wave. The origin of this BCW is unclear. Theoretically, it might have been caused by mitral regurgitation, which cannot be excluded rigorously. However, in this study mitral regurgitation seems unlikely as no catheters were passed through the mitral valve and, because filling pressures were low and the pericardium had been reconstructed, the mitral annulus should not have been dilated. In principle, the closed mitral valve might be a source of positive reflection but the relative magnitudes and timings of the FCW and the BCW do not clearly support the reflection hypothesis. The upslope of the v wave is often explained by the fact that the elastic LA fills while the mitral valve is closed. With respect to the LA, this process could be understood by the filling of an elastic reservoir but it is unclear what kind of waves might be generated through this process. One may speculate that after the BDW (i.e. the x descent and decreasing Pbackward), a change in momentum occurs in the LA that causes the BCW and the increase in Pbackward associated with the upslope of the v wave. Regardless, from the perspective of the PV, the onset of LA filling appears to create a disturbance that propagates backwards into the PV. In this respect, the LA is the source of a BCW that contributes to the upslope of the v wave. However, if LA stiffness is altered (Mehta et al. 1991) or should mitral regurgitation be present (Freihage et al. 2007), one would anticipate that the characteristics of the v wave may be altered, perhaps substantially, depending on many variables including the volume and rate of regurgitation and the pressure at which it occurs.
LV relaxation generates a decompression wave that decelerates and stops aortic outflow, decreases LV elastance, and finally aids its own filling by the process known as diastolic suction (Wang et al. 2005; Tyberg, 2010). In the PV, this process is manifested by a BDW that contributes to the downslope of the v wave (MacRae et al. 1997; Flewitt et al. 2007). The effects of this BDW may become greater with increased LV diastolic suction in response to reduced end-systolic LV volume (Mitchell et al. 2005a,b2005b) that serves to augment LV filling or the effects of this BDW might become less with LV diastolic dysfunction (Garcia, 2008).
Reservoir wave versus conventional wave analysis
Figure 6 demonstrates the consequences of considering reservoir effects. The results of wave analysis are substantially different, depending on whether wave-related excess quantities are used or not (Tyberg et al. 2013; Westerhof & Westerhof, 2013). Accounting for the reservoir is the important difference: after subtracting the reservoir effect, excess pressure and velocity may be analysed with either the impedance approach or WIA and the results will be identical (Hughes & Parker, 2009).
In Fig. 6, all panels show the contributions of forward- and backward-going waves. The panels on the left show the wave separation results of Pexcess (as described in Fig. 3) and Uexcess. The panels on the right show the conventional technique (Westerhof et al. 1972; Hughes & Parker, 2009) applied separately to measured PPV and UPV. In the right-hand panels, WIA of PPV and UPV yields a complicated pattern of summating waves. In Fig. 3D, prominent backward-going waves (Ubackward) appear to strongly oppose the forward flow (Uforward) of blood. This paradigm implies that blood is conveyed inefficiently through the pulmonary circulation to the LV because the flow provided by forward waves is substantially diminished by backward waves. Furthermore, the physiological mechanism that precisely balances forward and backward waves that equate to a near-zero flow during diastasis (and diastole), even if diastole is extended, has not been offered. In the left-hand panels, WIA of Pexcess and Uexcess shows that wave activity is negligible during diastasis and the effects of backward waves are relatively small compared to conventional analysis. These observations describe the basis of efficient transmission and economy of energy that allows blood flow to the LA and LV to be relatively unimpeded by backward waves.
Clinical relevance
It would be premature to imply that this type of waveform analysis can be applied usefully to haemodynamic measurements acquired clinically. However, one might speculate that there is potential for our approach to provide quantitative, clinically useful interpretations of data in assessing a variety of left-sided cardiac conditions. For example, quantification of backward waves might help assess the severity of mitral regurgitation (Freihage et al. 2007) or the effects of a stiff LA (Pilote et al. 1988; Mehta et al. 1991). Similar measurements in both systolic and diastolic heart failure could possibly contribute to our understanding of these conditions and the magnitude of the backward waves may provide additional diagnostic information regarding the severity of these abnormalities.
Limitations
This study was conducted in open-chest, anaesthetized dogs because it was not feasible to make such extensive measurements in a more intact preparation. Thus, our conclusions should be validated using more physiological experimental models and/or clinical observations.
To quantify the entire PV reservoir, mean flow measured in a single PV was scaled to equal the cardiac output measured in the main pulmonary artery. In principle there may be differences between flows in each pulmonary vein, although it was not technically feasible to measure flow in all four PVs. Furthermore, for the purpose of WIA, we calculated the mean velocity by dividing measured flow by the area estimated from the diameter of the flow probe.
Measured pulmonary venous flow during diastole was deemed to be the outflow from an upstream reservoir (i.e. Qres). However, we cannot ascertain the separate contributions that either the upstream PA or PV reservoirs may have towards Qres because of the lumped parameter nature of the reservoir wave model.
Reservoir parameters were calculated during LV diastasis. When heart rate is less than ∼80 b.p.m., the reservoir parameters could be determined from regular PPV waveforms robustly. However, when the heart rate was greater, determining reservoir parameters for regular beats became more difficult. In this study, to maintain the ability to calculate reservoir parameters more robustly during every intervention, acetylcholine was injected to extend diastole/diastasis after a series of regular beats.
As with any technique used to calculate the single-point wave speed (Borlotti et al. 2014), there are potential limitations of using the sum-of-squares technique when wave reflections are present (Kolyva et al. 2008). Single-point wave speed can be calculated robustly when only one wave can be assumed to exist during a particular period of the cardiac cycle (usually the upstroke of pressure and flow during the beginning of systole in arterial measurements) (Khir et al. 2001). In this study, atrial contraction could have been used to calculate the single-point wave speed with the linear regression technique. However, our observations of PPV and QPV often indicated that the period of atrial contraction was very short and it was difficult to identify a period when only one wave was present objectively. Therefore, wave speed was calculated using the sum-of-squares technique (Davies et al. 2006) because the assumptions of the linear regression technique could often not be made objectively.
The reservoir wave model has proven to be a useful concept (Parker, 2013) and has recently shown plausible patterns of wave propagation and reflection during in vivo experiments that investigated normal, vasoconstriction and vasodilation conditions (Wang et al. 2011, 2013) that cannot be explained by conventional methods of wave analysis (Tyberg et al. 2013; Westerhof & Westerhof, 2013). However, as previously discussed (Bouwmeester et al. 2014; Tyberg et al. 2014), the reservoir wave model has been criticized (Mynard et al. 2012; Segers et al. 2012). We acknowledge that in this study the reservoir wave model is empirical and further refinements of the reservoir wave theory are necessary to fully define the nature of the reservoir pressure (Parker, 2013).
Conclusions
Using the reservoir wave model, we conclude that the change in measured pulmonary venous pressure and flow during LV diastasis is entirely consistent with the discharge of upstream reservoir(s) and, thus, that these changes in pressure and flow are not due to waves. WIA of excess pressure and velocity indicates that the major features of the characteristic pulmonary venous and left atrial waveforms can be attributed mostly to backward waves. The a and c waves are caused by backward waves, while the v wave is caused by a combination of forward waves transmitted from the PA and backward waves generated by the LA and/or LV.
Acknowledgments
The authors appreciate the surgical expertise of Cheryl Meek and the helpful criticisms of Dr Jiun-Jr Wang.
Glossary
- BCW
backward compression wave
- BDW
backward decompression wave
- C
reservoir compliance
- FCW
forward compression wave
- FDW
forward decompression wave
- K
reservoir flow fraction
- LA
left atrium/atrial
- LV
left ventricle/ventricular
- MC
mitral valve closing
- MO
mitral valve opening
- P∞
asymptotic pressure
- PA
pulmonary artery
- Pbackward
pressure of a backward-going wave
- PEEP
positive end-expiratory pressure
- Pexcess
excess pressure
- Pforward
pressure of a forward-going wave
- PLA
left atrial pressure
- PLV
left ventricular pressure
- PPV
pulmonary venous pressure
- Pres
reservoir pressure
- PV
pulmonary vein/venous
- Qexcess
excess flow
- Qin
pulmonary venous reservoir inflow
- Qout
total pulmonary venous outflow
- QPA
pulmonary arterial flow
- QPV
pulmonary venous flow
- Qres
pulmonary venous reservoir flow
- R
reservoir resistance
- RV
right ventricle/ventricular
- Ubackward
velocity of a backward-going wave
- Uexcess
excess velocity
- Uforward
velocity of a forward-going wave
- UPV
pulmonary venous velocity
- VSF
venous scaling factor
- WIA
wave intensity analysis
- WIbackward
intensity of a backward-going wave
- WIexcess
excess wave intensity
- WIforward
intensity of a forward-going wave
- Δt
forward wave transmission time
Additional Information
Competing interests
The authors have no conflicts of interest, financial or otherwise, to declare.
Author contributions
The experiments in this study were performed in the Libin Cardiovascular Institute of Alberta at the University of Calgary. J.C.B., I.B., N.G.S. and J.V.T. conceived and designed the experiments. J.C.B. collected and analysed experimental data and J.C.B., I.B., N.G.S. and J.V.T. interpreted the experimental data. J.C.B., I.B., N.G.S. and J.V.T. drafted the article and revised it critically for important intellectual content. All authors have read and approved the final manuscript.
Funding
This work was supported by the Canadian Institutes of Health Research [106520].
References
- Ankeney JL, Fishman AP, Fritts HW. An analysis of normal and abnormal left atrial pressure pulse in man. Circ Res. 1956;4:95–99. doi: 10.1161/01.res.4.1.95. [DOI] [PubMed] [Google Scholar]
- Borlotti A, Li Y, Parker KH, Khir AW. Experimental evaluation of local wave speed in the presence of reflected waves. J Biomech. 2014;47:87–95. doi: 10.1016/j.jbiomech.2013.10.007. [DOI] [PubMed] [Google Scholar]
- Bouwmeester JC, Belenkie I, Shrive NG, Tyberg JV. Partitioning pulmonary vascular resistance using the reservoir-wave model. J Appl Physiol. 2013;115:1838–1845. doi: 10.1152/japplphysiol.00750.2013. [DOI] [PubMed] [Google Scholar]
- Bouwmeester JC, Belenkie I, Shrive NG, Tyberg JV. Wave reflections in the pulmonary arteries analysed with the reservoir-wave model. J Physiol. 2014;592:3053–3062. doi: 10.1113/jphysiol.2014.273094. [DOI] [PMC free article] [PubMed] [Google Scholar]
- Davies JE, Baksi J, Francis DP, Hadjiloizou N, Whinnett ZI, Manisty CH, Aguado-Sierra J, Foale RA, Malik IS, Tyberg JV, Parker KH, Mayet J, Hughes AD. The arterial reservoir pressure increases with aging and is the major determinant of the aortic augmentation index. Am J Physiol Heart Circ Physiol. 2010;298:H580–H586. doi: 10.1152/ajpheart.00875.2009. [DOI] [PMC free article] [PubMed] [Google Scholar]
- Davies JE, Whinnett ZI, Francis DP, Willson K, Foale RA, Malik IS, Hughes AD, Parker KH, Mayet J. Use of simultaneous pressure and velocity measurements to estimate arterial wave speed at a single site in humans. Am J Physiol Heart Circ Physiol. 2006;290:H878–H885. doi: 10.1152/ajpheart.00751.2005. [DOI] [PubMed] [Google Scholar]
- Flewitt JA, Hobson TN, Wang JJ, Johnston CR, Shrive NG, Belenkie I, Parker KH, Tyberg JV. Wave intensity analysis of left ventricular filling: application of windkessel theory. Am J Physiol Heart Circ Physiol. 2007;292:H2817–H2823. doi: 10.1152/ajpheart.00936.2006. [DOI] [PubMed] [Google Scholar]
- Frank O. Die Grundform des Arteriellen Pulses. Erste Abhandlung. Mathematische Analyse. Z Biol. 1899;37:483–526. [Google Scholar]
- Freihage JH, Joval D, Arab D, Dieter RS, Loeb HS, Steen L, Lewis B, Liu JC, Leva F. Invasive assessment of mitral regurgitation: comparison of hemodynamic parameters. Catheter Cardiovasc Interv. 2007;69:303–312. doi: 10.1002/ccd.20940. [DOI] [PubMed] [Google Scholar]
- Garcia MJ. Left ventricular filling. Heart Failure Clincs. 2008;4:47–56. doi: 10.1016/j.hfc.2007.10.005. [DOI] [PubMed] [Google Scholar]
- Hobson TN, Flewitt JA, Belenkie I, Tyberg JV. Wave intensity analysis of left atrial mechanics and energetics in anesthetized dogs. Am J Physiol Heart Circ Physiol. 2007;292:H1533–H1540. doi: 10.1152/ajpheart.00837.2006. [DOI] [PubMed] [Google Scholar]
- Hollander EH, Dobson GM, Wang JJ, Parker KH, Tyberg JV. Direct and series transmission of left atrial pressure perturbations to the pulmonary artery: a study using wave-intensity analysis. Am J Physiol Heart Circ Physiol. 2004;286:H267–H275. doi: 10.1152/ajpheart.00505.2002. [DOI] [PubMed] [Google Scholar]
- Hughes AD, Parker KH. Forward and backward waves in the arterial system: impedance or wave intensity analysis? Med Biol Eng Comput. 2009;47:207–210. doi: 10.1007/s11517-009-0444-1. [DOI] [PubMed] [Google Scholar]
- Keren G, Sonnenblick EH, LeJemtel TH. Mitral anulus motion: relation to pulmonary venous and transmitral flows in normal subjets and in patients with dilated cardiomyopathy. Circulation. 1988;78:621–629. doi: 10.1161/01.cir.78.3.621. [DOI] [PubMed] [Google Scholar]
- Khir AW, O'Brien A, Gibbs JSB, Parker KH. Determination of wave speed and wave separation in the arteries. J Biomech. 2001;34:1145–1155. doi: 10.1016/s0021-9290(01)00076-8. [DOI] [PubMed] [Google Scholar]
- Kolyva C, Spaan JA, Piek JJ, Siebes M. Windkesselness of coronary arteries hampers assessment of human coronary wave speed by single-point technique. Am J Physiol Heart Circ Physiol. 2008;295:H482–490. doi: 10.1152/ajpheart.00223.2008. [DOI] [PubMed] [Google Scholar]
- Lighthill MJ. Waves in Fluids. Cambridge: Cambridge University Press; 1978. [Google Scholar]
- MacRae JM, Sun Y-H, Isaac DL, Dobson GM, Cheng C-P, Little WC, Parker KH, Tyberg JV. Wave-intensity analysis: a new approach to left ventricular filling dynamics. Heart Vessels. 1997;12:53–59. doi: 10.1007/BF02820867. [DOI] [PubMed] [Google Scholar]
- Maloney JE, Bergel DH, Glazier JB, Hughes JMB, West JB. Transmission of pulsatile blood pressure and flow through isolated lung. Circ Res. 1968;23:11–24. doi: 10.1161/01.res.23.1.11. [DOI] [PubMed] [Google Scholar]
- Mehta S, Charbonneau F, Fitchett DH, Marpole DG, Patton R, Sniderman AD. The clinical consequences of a stiff left atrium. Am Heart J. 1991;122:1184–1191. doi: 10.1016/0002-8703(91)90498-7. [DOI] [PubMed] [Google Scholar]
- Mitchell JR, Doig CJ, Whitelaw WA, Tyberg JV, Belenkie I. Volume loading reduces pulmonary vascular resistance in ventilated animals with acute lung injury: evaluation of RV afterload. Am J Physiol Regul Integr Comp Physiol. 2011;300:R763–R770. doi: 10.1152/ajpregu.00366.2010. [DOI] [PubMed] [Google Scholar]
- Mitchell JR, Sas R, Zuege DJ, Doig CJ, Smith ER, Whitelaw WA, Tyberg JV, Belenkie I. Ventricular interaction during mechanical ventilation in closed-chest anesthetized dogs. Can J Cardiol. 2005a;21:73–81. [PubMed] [Google Scholar]
- Mitchell JR, Whitelaw WA, Sas R, Smith ER, Tyberg JV, Belenkie I. RV filling modulates LV function by direct ventricular interaction during mechanical ventilation. Am J Physiol Heart Circ Physiol. 2005b;289:H549–H557. doi: 10.1152/ajpheart.01180.2004. [DOI] [PubMed] [Google Scholar]
- Morkin E, Collins JA, Goldman HS, Fishman AP. Pattern of blood flow in the pulmonary veins of the dog. J Appl Physiol. 1965;20:1118–1128. [Google Scholar]
- Mynard JP, Penny DJ, Davidson MR, Smolich JJ. The reservoir-wave paradigm introduces error into arterial wave analysis: a computer modelling and in-vivo study. J Hypertens. 2012;30:734–743. doi: 10.1097/HJH.0b013e32834f9793. [DOI] [PubMed] [Google Scholar]
- Nixon PGF, Polis O. Left atrial X descent. Br Heart J. 1962;24:173–179. doi: 10.1136/hrt.24.2.173. [DOI] [PMC free article] [PubMed] [Google Scholar]
- Nolan SP, Dixon SH, Fisher RD, Morrow AG. The influence of atrial contraction and mitral valve mechanics on ventricular filling. Am Heart J. 1969;77:784–791. doi: 10.1016/0002-8703(69)90412-8. [DOI] [PubMed] [Google Scholar]
- Parker KH. An introduction to wave intensity analysis. Med Biol Eng Comput. 2009;47:175–188. doi: 10.1007/s11517-009-0439-y. [DOI] [PubMed] [Google Scholar]
- Parker KH. Arterial reservoir pressure, subservient to the McDonald lecture, Artery 13. Artery Research. 2013;7:171–185. [Google Scholar]
- Parker KH, Jones CJH. Forward and backward running waves in the arteries: analysis using the method of characteristics. J Biomech Eng. 1990;112:322–326. doi: 10.1115/1.2891191. [DOI] [PubMed] [Google Scholar]
- Parker KH, Jones CJH, Dawson JR, Gibson DG. What stops the flow of blood from the heart? Heart Vessels. 1988;4:241–245. doi: 10.1007/BF02058593. [DOI] [PubMed] [Google Scholar]
- Pilote L, Huttner I, Marpole D, Sniderman A. Stiff left atrial syndrome. Can J Cardiol. 1988;4:255–257. [PubMed] [Google Scholar]
- Pinkerson AL. Pulse-wave propagation through pulmonary vascular bed of dogs. Am J Physiol. 1967;213:450–454. doi: 10.1152/ajplegacy.1967.213.2.450. [DOI] [PubMed] [Google Scholar]
- Sagawa K, Lie RK, Schaefer J. Translation of Otto Frank's paper “Die Grundform des Arteriellen Pulses” Zeitschrift fur Biologie 37: 483–526 (1899).[classical article] J Mol Cell Cardiol. 1990;22:253–277. doi: 10.1016/0022-2828(90)91459-k. [DOI] [PubMed] [Google Scholar]
- Scott-Douglas NW, Traboulsi M, Smith ER, Tyberg JV. Experimental instrumentation and left ventricular pressure–strain relationship. Am J Physiol. 1991;261:H1693–H1697. doi: 10.1152/ajpheart.1991.261.6.H1693. [DOI] [PubMed] [Google Scholar]
- Segers P, Mynard J, Taelman L, Vermeersch S, Swillens A. Wave reflections: myth or reality? Artery Res. 2012;6:7–11. [Google Scholar]
- Tyberg JV. Late-systolic retrograde coronary flow: an old observation finally explained by a novel mechanism. J Appl Physiol. 2010;108:479–480. doi: 10.1152/japplphysiol.00021.2010. [DOI] [PubMed] [Google Scholar]
- Tyberg JV, Bouwmeester JC, Parker KH, Shrive NG, Wang JJ. The case for the reservoir-wave approach. Int J Cardiol. 2014;172:299–306. doi: 10.1016/j.ijcard.2013.12.178. [DOI] [PubMed] [Google Scholar]
- Tyberg JV, Bouwmeester JC, Shrive NG, Wang JJ. CrossTalk opposing view: forward and backward pressure waves in the arterial system do not represent reality. J Physiol. 2013;591:1171–1173. doi: 10.1113/jphysiol.2012.249557. discussion 1175. [DOI] [PMC free article] [PubMed] [Google Scholar]
- Wang JJ, Bouwmeester JC, Belenkie I, Shrive NG, Tyberg JV. Alterations in aortic wave reflection with vasodilatation and vasoconstriction in anaesthetized dogs. Can J Cardiol. 2013;29:243–253. doi: 10.1016/j.cjca.2012.03.001. [DOI] [PubMed] [Google Scholar]
- Wang JJ, Flewitt JA, Shrive NG, Parker KH, Tyberg JV. Systemic venous circulation. Waves propagating on a windkessel: relation of arterial and venous windkessels to systemic vascular resistance. Am J Physiol Heart Circ Physiol. 2006;290:H154–H162. doi: 10.1152/ajpheart.00494.2005. [DOI] [PubMed] [Google Scholar]
- Wang JJ, O'Brien AB, Shrive NG, Parker KH, Tyberg JV. Time-domain representation of ventricular–arterial coupling as a windkessel and wave system. Am J Physiol Heart Circ Physiol. 2003;284:H1358–H1368. doi: 10.1152/ajpheart.00175.2002. [DOI] [PubMed] [Google Scholar]
- Wang JJ, Shrive NG, Parker KH, Hughes AD, Tyberg JV. Wave propagation and reflection in the canine aorta: analysis using a reservoir-wave approach. Can J Cardiol. 2011;27:389.e1–10. doi: 10.1016/j.cjca.2010.12.072. [DOI] [PubMed] [Google Scholar]
- Wang JJ, Shrive NG, Parker KH, Tyberg JV. Effects of vasoconstriction and vasodilatation on LV and segmental circulatory energetics. Am J Physiol Heart Circ Physiol. 2008;294:H1216–H1225. doi: 10.1152/ajpheart.00983.2007. [DOI] [PubMed] [Google Scholar]
- Wang Z, Jalali F, Sun YH, Wang JJ, Parker KH, Tyberg JV. Assessment of left ventricular diastolic suction in dogs using wave-intensity analysis. Am J Physiol Heart Circ Physiol. 2005;288:H1641–H1651. doi: 10.1152/ajpheart.00181.2004. [DOI] [PubMed] [Google Scholar]
- Westerhof N, Sipkema P, van den Bos GC, Elzinga G. Forward and backward waves in the arterial system. Cardiovasc Res. 1972;6:648–656. doi: 10.1093/cvr/6.6.648. [DOI] [PubMed] [Google Scholar]
- Westerhof N, Westerhof BE. CrossTalk proposal: forward and backward pressure waves in the arterial system do represent reality. J Physiol. 2013;591:1167–1169. doi: 10.1113/jphysiol.2012.249763. discussion 1177. [DOI] [PMC free article] [PubMed] [Google Scholar]
- Wiener F, Morkin E, Skalak R, Fishman AP. Wave propagation in the pulmonary circulation. Circ Res. 1966;19:834–850. doi: 10.1161/01.res.19.4.834. [DOI] [PubMed] [Google Scholar]