

Abstract
Force generation in the muscle sarcomere is driven by the head domain of the myosin molecule extending from the thick filament to form cross-bridges with the actin-containing thin filament. Following attachment, a structural working stroke in the head pulls the thin filament towards the centre of the sarcomere, producing, under unloaded conditions, a filament sliding of ∼11 nm. The mechanism of force generation by the myosin head depends on the relationship between cross-bridge force and movement, which is determined by compliances of the cross-bridge (Ccb) and filaments. By measuring the force dependence of the spacing of the high-order myosin- and actin-based X-ray reflections from sartorius muscles of Rana esculenta we find a combined filament compliance (Cf) of 13.1 ± 1.2 nm MPa−1, close to recent estimates from single fibre mechanics (12.8 ± 0.5 nm MPa−1). Ccb calculated using these estimates is 0.37 ± 0.12 nm pN−1, a value fully accounted for by the compliance of the myosin head domain, 0.38 ± 0.06 nm pN−1, obtained from the intensity changes of the 14.5 nm myosin-based X-ray reflection in response to 3 kHz oscillations imposed on single muscle fibres in rigor. Thus, a significant contribution to Ccb from the myosin tail that joins the head to the thick filament is excluded. The low Ccb value indicates that the myosin head generates isometric force by a small sub-step of the 11 nm stroke that drives filament sliding at low load. The implications of these results for the mechanism of force generation by myosins have general relevance for cardiac and non-muscle myosins as well as for skeletal muscle.
Key points
Muscle contraction is driven at the molecular level by a structural working stroke in the head domain of the myosin cross-bridge linking the thick and thin filaments. Crystallographic models suggest that the working stroke corresponds to a relative movement of 11 nm between the attachments of the head domain to the thin and thick filaments.
The molecular mechanism of force generation depends on the relationship between cross-bridge force and movement, which is determined by cross-bridge and filament compliances.
Here we measured the compliance of the cross-bridges and of the thin and thick filaments by combining mechanical and X-ray diffraction experiments.
The results show that cross-bridge compliance is relatively low and fully accounted for by the elasticity of the myosin head, suggesting that the myosin cross-bridge generates isometric force by a small sub-step of the 11 nm stroke that drives filament sliding at low load.
Introduction
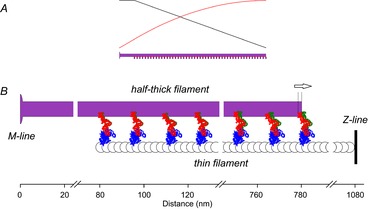
Muscle contraction is driven by arrays of the motor protein myosin II in the thick filaments, which pull the actin-containing thin filaments towards the centre of the sarcomere. At the molecular level, force and filament sliding are due to a structural working stroke in the globular region (variously described as the head domain, or motor domain, or Subfragment 1, S1) of the myosin molecule while it is attached to actin (Fig. 1A). In terms of the crystal structure of S1 (Fig. 1B; Rayment 1993b; Dominguez et al. 1998; Geeves & Holmes, 2005) the working stroke corresponds to a 70 deg tilting of the light chain domain (LCD) or ‘lever arm’ of the head about a fulcrum in the converter region of the actin-attached catalytic domain (CD), corresponding to an axial movement (d) of 11 nm between the CD and the C terminus of the LCD that is connected through the rod-like Subfragment 2 (S2) to the thick filament backbone. The mechanical energy of the working stroke is accounted for by ATP hydrolysis in the CD.
Figure 1. Connection of the myosin head to the filaments and its working stroke.

A, conformation of the myosin head attached to actin during isometric contraction. The myosin head (or subfragment 1, S1) is formed of a catalytic domain (blue) attached to actin (black and grey) according to Holmes et al. (2003) and a light chain domain (red) that has an average orientation of θ = 60 deg relative to the filament axis and is connected to the filament backbone (violet) via the coiled-coil subfragment 2 (S2, yellow). The partner head, assumed not to be attached during isometric contraction, and its S2 component are in light grey. B, the crystallographic model of the working stroke. The catalytic domain (CD, blue) of the myosin head is firmly attached to the actin filament, here represented by only three monomers (black and grey). The working stroke consists of an ∼70 deg rotation of the light chain domain (LCD) with the fulcrum near Cys707 (yellow circle). The orientation of the LCD is represented as the vector joining the fulcrum to the head–rod junction (residue Lys 843, grey circle). Red and green lines represent the pre- and post-working stroke conformations of the LCD, respectively (adapted from Irving et al. 2000).
Sarcomere-level mechanics and X-ray interferometry in single fibres from frog skeletal muscle have led to the following description of the function of the array of myosin motors in each thick filament, as they perform different physiological tasks: (i) in isometric contraction (force T0), 20–30% of the 294 myosin heads present in each half-thick filament are attached to actin and each motor bears a force of 5–6 pN, with an elastic strain of less than 2 nm (Decostre et al. 2005; Piazzesi et al. 2007); (ii) during steady shortening against high to moderate loads the number of motors decreases in proportion to the load and the size of the working stroke increases but remains limited to ∼6 nm (Piazzesi et al. 2007); and (iii) the full 11 nm stroke expected from crystallographic models is observed only during the early rapid shortening following a stepwise drop to near zero force (Reconditi et al. 2004).
An alternative view is that the isometric force is generated by a small fraction of the actin-attached motors executing a stochastic 11 nm stroke, and this fraction increases at lower loads. This view has been supported by Knupp et al. (2009), who claim that the X-ray interference data, for all the conditions described above, can be equally well explained by the all-or-none ∼11 nm lever arm tilting expected from crystallographic models, assuming that most of the cross-bridge compliance is in the S2 domain (Fig. 1A).
The mechanism of force generation critically depends on the value of the stiffness of the individual cross-bridge (ε) that links the thick and thin filaments, and therefore comprises both the head (S1) and S2. An upper limit to the value of ε that is compatible with a stochastic 11 nm working stroke is 1.5 pN nm−1; for ε values larger than 1.5 pN nm−1 the mechanical energy implied in the generation of isometric force (Em = ½ε·d2 > 90 zJ) becomes larger than the free energy released during the hydrolysis of one ATP molecule (83 zJ; Barclay et al. 2010 and references therein), making the force generating transition highly unlikely due to the low value of its equilibrium constant.
The stiffness of the individual cross-bridge in situ can be calculated from the compliances of the half-sarcomere (Chs) and of the filaments (Cf = CA + CM, where CA and CM are the contributions of the thin and thick filaments), using the simplified equation from appendix A of Ford et al. (1981) (see also Linari et al. 1998):
| (1) |
where e is the stiffness of the array of cross-bridges when all the myosin heads are attached to actin and β is the fraction of attached heads. Assuming that all myosin heads are attached in rigor (Cooke & Franks, 1980), β = 1 and e can be obtained from the rigor value of Chs. In single fibres of Rana temporaria Cf was estimated as ∼13 nm MPa−1 by combining X-ray diffraction and mechanical measurements (Piazzesi et al. 2007 and references therein). From this value of Cf, and given Chs = ∼15 nm MPa−1 in rigor (Piazzesi et al. 2007; Fusi et al. 2010), the cross-bridge stiffness ε can be calculated as ∼3 pN nm−1. A similar value of ε was obtained in single fibres of Rana esculenta, using a thermodynamic approach based on the effect of temperature on the isometric force (Decostre et al. 2005; Park-Holohan et al. 2012).
The estimates of ε reported above depend on the assumption that Cf is independent of force. The assumption of linear filament elasticity has been recently challenged (Edman, 2009; Mansson, 2010), although on the basis of indirect or contradictory evidence (Reconditi, 2010). Also, the use of eqn (1) has been criticized (Colombini et al. 2010) because, at forces <0.4T0 during the rise of an isometric tetanus, the half-sarcomere (hs) elasticity deviates from that of a linear system composed of filaments with constant compliance in series with an array of myosin cross-bridges with a stiffness that is proportional to the force (Brunello et al. 2006; Fusi et al. 2010). The deviation was attributed to an elastic element with constant stiffness in parallel with the cross-bridge array. It was claimed that ignoring this parallel element could cause an overestimate of up to 40% in values of motor stiffness calculated under the assumption that the half-sarcomere is a linear elastic system (Colombini et al. 2010). However, recent experiments, in which the analysis was extended to forces <0.2T0, indicate that the compliance of the parallel element is too large to affect the estimate of the motor stiffness based on the linear model (Fusi et al. 2014).
CA and CM can be estimated more directly using X-ray diffraction, but the existing data have some limitations: (i) the estimates were derived from relationships between the force and the axial periodicities along the actin and myosin filaments determined using X-ray diffraction from whole muscles (Huxley et al. 1994; Wakabayashi et al. 1994) – the cumulative filament compliance derived from those measurements ranged between 10 and 20 nm MPa−1 due to the large variation of force per cross-sectional area (CSA) reported in those papers, probably due to the intrinsic difficulty in measuring the CSA of muscle; and (ii) information on the thick filament periodicity from the strong M3 X-ray reflection on the meridional axis (parallel to the muscle axis) due to the 14.5 nm axial repeat of the myosin heads is not suitable for measuring thick filament compliance, because this reflection is influenced by the actin-attached myosin heads. The weaker, higher order myosin-based reflections, instead, originate mainly from the filament backbone and are the suitable signals for estimating filament compliance (Huxley et al. 2006; Piazzesi et al. 2007).
X-ray diffraction from single muscle fibres can overcome limitation (i), but not (ii), because of the low signal-to-noise ratio of the X-ray reflections of interest from this preparation. We have therefore used whole sartorius muscles of R. esculenta (sarcomere length ∼2.15 μm, temperature 4°C) to measure the spacing changes of both the actin-based meridional A13 reflection associated with the 2.73 nm axial repeat of the actin monomers and the higher-order myosin-based meridional reflections M11 and M15 produced by rapid length changes during isometric contraction. The force per CSA was determined using the wet weight of the muscle, and checked by parallel measurements of the force per CSA in single fibres from fast skeletal muscles of the same batch of frogs. We found that both filaments exhibit a linear elasticity for forces >0.4T0, and their cumulative compliance is consistent with that determined using recent stiffness measurements on single muscle fibres (Fusi et al. 2014). From the mean of these measurements a cross-bridge compliance of 0.37 nm pN−1 can be calculated, which is not significantly different from the compliance of the myosin head as determined by modelling the effect on the intensity of the M3 reflection of length oscillations imposed on a fibre in rigor (Dobbie et al. 1998). This excludes any significant contribution of S2 to cross-bridge compliance. Such a small cross-bridge compliance indicates that the isometric force is generated through an early sub-step of the 11 nm working stroke.
Methods
Ethical approval
Frogs (R. esculenta) were killed by decapitation and destruction of the brain and the spinal cord, following European Community Council Directive 86/609/EEC and in conformity with indications of the Institutional Animal Care and Use Committee of the University of Florence. Six frogs were used for these experiments.
Protocol and data collection
Sartorius muscles were dissected and mounted at rest length in a thermo-regulated aluminium/perspex trough containing Ringer solution (115 mm NaCl, 2.5 mm KCl, 1.8 mm CaCl2, 3 mm phosphate buffer, pH 7.1) at 4°C and bubbled with oxygen (99.9%). The trough was then mounted vertically at beamline ID02 of the European Synchrotron Radiation Facility (ESRF, Grenoble, France), which provided up to 6 × 10¹³ photons s−1 at 0.1 nm wavelength in a beam of size ∼300 μm (horizontal, full width at half maximum (FWHM)) and 150–250 μm (vertical) at the sample. Electrical stimuli were delivered by platinum strips running parallel to the muscle on either side at a frequency adequate to elicit fused tetani. The length of the muscles was adjusted to that at which isometric tetanic force was maximum (L0, corresponding to ∼2.15 μm sarcomere length). The length and force were measured/controlled using a muscle lever system type 300 C (Aurora Scientific, Richmond Hill, Ontario, Canada), driven by the computer used for data collection. Length changes of different amplitudes (−2 to +1% L0, negative for releases), complete in 3–4 ms, were superimposed on otherwise isometric contractions and reversed after 8 ms (Fig. 2A and B).
Figure 2. Protocol for mechanical and X-ray data collection.

A and B, force response (upper trace) to three release–restretch (A) and stretch–release (B) cycles (lower trace) superimposed on the steady force developed at the plateau of an isometric tetanus. Middle trace: X-ray exposure time windows. In the inset, one cycle on a faster time base. Time zero marks the start of stimulation. C, relationship between the force attained at the end of the first step in each cycle and the step amplitude (mean ± SEM from five muscles).
A fast electromagnetic shutter (Laser Products, Inc., Sunnyvale, CA, USA) was used to generate 1 ms windows to collect X-ray patterns at the tetanus plateau, just before the length change cycle, or at the end of the first step, when the force change had attained its maximum value (Fig. 2A and B). To accumulate photons, three cycles were repeated at intervals of 100 ms (releases) or 75 ms (stretches), to allow the isometric force value to be recovered. Three 1 ms exposure windows were also used to record patterns from the muscle at rest. The muscle was axially shifted by 200 μm between exposures to spread the radiation dose over a larger area and reduce radiation damage, which became evident as the appearance of resting features in diffraction patterns recorded during a tetanus. X-ray collection was repeated for a total of 9 ms exposure for each condition, for each of the five muscles used. X-ray diffraction patterns were collected with a high sensitivity fibre-optically coupled CCD detector (FReLoN) with active area 100 × 100 mm2, 2048 × 2048 pixels (Sztucki et al. 2010), mounted 1.8 m from the muscle.
In whole muscle the CSA can be calculated from length L0 and wet weight Ww, according to the formula Ww/(ρ·L0) (where ρ = 1.06 g cm–3 is the density of the muscle). The average force per CSA of the muscles calculated in this way was 205 ± 29 kPa. L0 must be corrected by a factor that takes into account the shape of the muscle. In sartorius muscle the average fibre length is about 5–10% less than the overall length of the muscle between tendons (Close, 1972), so the corrected force per CSA would be 184–195 kPa. The force at the plateau of the isometric tetanus at the same temperature and sarcomere length was also determined in single fibres isolated from the tibialis anterior muscle of frogs from the same batch, a preparation in which CSA can be determined directly under the microscope by measuring the width and the height of the fibre. The force per CSA in these fibres was 183 ± 6 kPa, in good agreement with the value calculated for the muscles. Because of the uncertainties about the correction factor for muscle shape, the value of force per CSA from the single fibres was used for the calculation of compliance in SI units described below.
Data analysis
X-ray diffraction data were analysed using Fit2D (A. Hammersley, ESRF) and Sigmaplot (Systat Software, Inc., Chicago, IL). For each of the five muscles two-dimensional patterns were collected at rest and during isometric contraction just before each step and at each level of force attained at the end of the step. The patterns were then centred and aligned using the M3 reflections along the meridional axis on either side of the equatorial axis (perpendicular to the meridian), and then mirrored across both axes. The distribution of diffracted intensity along the meridional axis was calculated by integrating from 0.012 nm−1 on either side of the meridian for the myosin-based reflections, and 0.025 nm−1 for the A13 actin-based reflection (Bordas et al. 1999). The background intensity distribution was fitted using a smooth convex hull algorithm and subtracted. The intensity and spacing for each reflection were determined from a Gaussian fit on the pixels with more than half the counts of that with the maximum intensity (Huxley et al. 1994).
All data are expressed as mean ± SEM.
Determination of filament compliance from X-ray spacing changes
The compliances of the thin and thick filaments were calculated from the spacing changes of the actin- and myosin-based reflections, respectively, taking into account the local force changes in the filament. The compliance per unit length of the thick filament (cM) was determined from the average spacing changes of the M11 and M15 myosin-based reflections, considering that in the region from which these reflections originate, from the end of the bare zone to the end of the thick filament (Oshima et al. 2007), the average isometric force is 0.5T0. These two reflections were selected from all the meridional myosin-based reflections recorded here, for two reasons: (i) they are the farthest from the centre of the pattern, and thus the relative error on their spacing measurements is the lowest; (ii) the possible influence of the attached myosin heads on M11 and M15 is the lowest, as indicated by the smaller intensity change following a length step (Fig. 3A). The compliance per unit length of the thin filament (cA) was calculated from the spacing changes of the A13 reflection. This reflection originates from the region of the thin filament from the Z-line to the beginning of overlap with thick filaments (0.275 μm long at 2.15 μm sarcomere length), in which the isometric force is T0, from the overlap region (0.700 μm long), in which the average isometric force is 0.5T0, and from the short region (0.025 μm at 2.15 μm sarcomere length) beyond the overlap zone towards M-line, in which force is zero. Thus, the average isometric force in the thin filament to be used for calculating its compliance is (0.275 + 0.700/2) = 0.625T0. The observed 92% increase in intensity of the A13 reflection (IA13) from rest to the tetanus plateau was taken into account as follows. Let L1 and L2 be the non-overlap and overlap regions of the thin filament, respectively, and A and B be the intensity contribution per unit length of the thin filament from the regions with no attached heads and from those with attached heads, respectively. The total contributions to IA13 at rest and at the tetanus plateau are then A· (L1 + L2) and (A·L1 + B·L2), and these are related by the factor 1.92, so A·L1 + B·L2 = 1.92·A·(L1 + L2), which gives B = A·(0.92·L1 + 1.92·L2)/L2. At sarcomere length = 2.15 μm, L1 = 0.3, L2 = 0.7 and B = A·2.31. These values were used in the equation of Wakabayashi et al. (1994, p. 2431), to find the relationship between the observed spacing changes (ΔS/S) and the relative length change of the thin filament (ΔL/L): ΔL/L = ΔS/S·0.65·(L1·A+L2·B)/(L1·A+L2·B/2) =ΔS/S·1.124. cA was calculated by dividing the relative length change of the thin filament by the average force on the filament.
Figure 3. Relationship between the intensities (A and B) and spacings (C and D) of the meridional reflections and the force at the end of the step.

The two values at T/T0 = 1 refer to the exposure either during a tetanus (T0, open circle) or just before each cycle in the step protocol (Ti, filled circle). The second axis scales under C and D are expressed in SI units taking T0 as 183 kPa. Open triangles indicate the intensity and spacing values at rest. Data from five muscles. A, intensities of the myosin-based meridional reflections M3 (violet), M6 (blue), M9 (green), M11 (red) and M15 (black). M9 is not detectable at rest. B, intensity of the actin-based meridional reflection A13. All intensities are normalised by the mean of their values at T0 and Ti (dashed line). C, spacing changes of the myosin-based meridional reflections M6, M9, M11 and M15 with the same colour code as in A (circles); blue crosses are the spacing changes of M6 measured in R. temporaria (from fig S1C in Piazzesi et al. (2007); force values are scaled for the 1.3 times larger T0 (240 kPa) in R. temporaria with respect to R. esculenta, and thus the rightmost cross corresponds to T0). D, spacing changes of the actin-based meridional reflection A13. All spacing changes are calculated as a percentage of the mean between their values at T0 and Ti. Continuous lines are the linear fits to data for T > 0.4T0.
CA and CM, the contributions of the thin and thick filaments to the half-sarcomere compliance, were calculated from cA and cM using the equations CA = cA·(lA − 2ζ/3) and CM = cM·(lM − 2ζ/3), where lA and lM are the length of thin and thick filaments under stress, and ζ is the length of the overlap region (Ford et al. 1981); at sarcomere length 2.15 μm, lA = 0.975 μm, lM = 0.800 μm and ζ = 0.700 μm.
Determination of myosin motor compliance from length oscillations in rigor
The compliance CS1 of the myosin head (S1) was determined from the intensity changes of the M3 reflection induced by 3 kHz length oscillations applied to the fibre in rigor (Fig. 4A and B, reproduced from fig. 2b of Dobbie et al. 1998). The original IM3 data, recorded with 16 μs time frames (Fig. 4B), were binned by 2, to reduce the noise, and then plotted against force as percentage change relative to the value at force 0.5T0 (circles in Fig. 4C). The linear fit to the data (continuous line in Fig. 4C) has a slope of 25 ± 4%/T0. The IM3 changes were interpreted in terms of tilting of the light chain domain of S1 induced by the length oscillations, using the crystallographic model of S1 (Rayment et al. 1993b). We assumed that in rigor the two heads of each myosin molecule sharing the head–rod junction have their catalytic domains attached to adjacent monomers on the same strand of the double-stranded actin filament with axial separation 5.46 nm (Reconditi et al. 2003). During the imposed oscillations the orientations of the LCDs change in relation to the axial displacement Δz of the head–rod junction relative to the catalytic domains of the two heads. IM3 changes were calculated from the Fourier transform of the axial mass projection of the head pair at the level of the M3 reflection (at 14.44 nm (Reconditi et al. 2003); see Appendix B) for different values of Δz.
Figure 4. Changes in force and IM3 produced by 3 kHz oscillations imposed on a single fibre of R. temporaria in rigor.

A, motor position (upper trace), length change of the fibre segment illuminated by the X-ray beam (middle trace) and force (lower trace). B, IM3 changes (filled circles) sampled at 16 μs intervals and superposed on force changes (continuous line). Dashed line: IM3 value in rigor at a steady force 0.5T0. A and B are from fig. 1 of Dobbie et al. (1998). C, relationship between the change in IM3 and force. Open circles are data from B binned by 2 giving a 32 μs exposure time and expressed as a percentage of the steady value at 0.5T0 (filled circle). The continuous line is the linear fit with slope 25 ± 4%/T0. D, relationship between IM3 changes and Δz calculated from the structural model of myosin heads in rigor (circles) as described in the text. The line is the linear fit, and has a slope 37% nm–1.
Results
Compliances of the thin and thick filaments
Filament compliances were measured by imposing step length changes (ΔL) of different amplitudes (−2 to +1% of muscle length, L0) complete in 3–4 ms at the plateau of an otherwise isometric contraction. The length change was reversed after 8 ms, and three cycles of steps were imposed in each tetanus; the three equivalent time frames were added to improve the signal to noise ratio. Figure 2A shows the force response (upper trace) to a cycle starting with a release of ∼1.1% L0 (lower trace). The force drops to a minimum during the release and overshoots the plateau value after the subsequent stretch, but recovers the plateau value before the next cycle. The middle trace shows the 1 ms X-ray exposure when the release has attained the set value, and the force is at a minimum. The responses to a cycle starting with a stretch of ∼1.1% L0 are shown in Fig. 2B. The time of the 1 ms X-ray exposure corresponds to the time at which the stretch has just attained the set value. The force at the end of the length step has a non-linear dependence on step size (Fig. 2C), due to the increase in both the tendon compliance and the rate of cross-bridge detachment at low force (see Discussion).
The intensities of the 3rd order myosin-based reflection (IM3, violet), the 6th (IM6, blue), the 9th (IM9, green), the 11th (IM11, red) and the 15th (IM15, black) at the end of length steps of different sizes are plotted against the force at the end of the step in Fig. 3A. IM3 reduces for both releases and stretches, as shown previously (Huxley et al. 1983, 2006; Irving et al. 2000), in contrast to the intensities of the higher-order reflections, which increase following a release and decrease following a stretch. For example, following the 1.1% L0 release, force falls to ca. 100 kPa (∼0.5 T0), IM6 increases by 50%, IM9 increases by 25%, and IM11 and IM15 increase by only 10%. Thus, a mechanical manoeuvre that is expected to change the axial mass distribution of the attached myosin heads, as demonstrated by the IM3 changes, is progressively less effective in changing the intensities of the higher order reflections. This is expected if the higher order reflections have a progressively smaller relative contribution from the axial periodicity of the myosin heads and a correspondingly larger contribution from that of the thick filament backbone (Huxley et al. 2006). Moreover, in isolated muscle fibres, IM6 during isometric contraction is independent of the overlap between thick and thin filaments, in contrast to IM3 which is proportional to filament overlap (Reconditi et al. 2014). However, IM6 appears to be more sensitive to applied length changes, and to the number of attached myosin heads, in whole muscle (Huxley et al. 2006) than in single fibre experiments (Reconditi et al. 2004). Finally, note that the M9 is not detectable at rest, and its intensity increase following step releases is larger than that of the M11 and M15, which were therefore selected as the most suitable for estimating the thick filament compliance.
The intensity of the 13th order actin-based reflection (IA13), corresponding to the 2.73 nm periodicity of the actin monomers along the thin filaments, showed relatively small changes following length steps (Fig. 3B). IA13 increases following a release and becomes about 20% higher for the 1.1% L0 release associated with a force decrease to 100 kPa (∼ 0.5T0). IA13 almost doubles from rest (open triangle) to T0 (open circle), indicating that attachment of the myosin heads to thin filaments enhances the 2.73 nm periodicity. This effect is mainly due to the CD of S1 sampling the repeat of the actin monomers, with little contribution from the LCD, which partially retains the thick filament periodicity. Thus, the spacing of the A13 reflection (SA13) is not significantly influenced by the compliance of the thick filament (see Appendix A), and SA13 gives a reliable measure of thin filament periodicity both during isometric contraction and following length steps.
The spacings of the higher order myosin-based reflections (Fig. 3C) and the actin-based A13 reflection (Fig. 3D) increase on stretch and decrease on release, with a dependence on the force at the end of the length step (T) that, for forces >100 kPa (or 0.5 T0), is well fitted by a straight line. The slopes of the linear part of the relationships are similar for SA13 (0.15 ± 0.02%/T0 or 0.80 ± 0.11%/MPa) and the mean of SM11 and SM15 (0.16 ± 0.01%/T0 or 0.88 ± 0.09%/MPa) (Table 1). At forces < 0.5T0 the relationships show a downward deviation, i.e. the spacing–force relationship deviates from linearity in this region. A similar non-linearity was reported previously for SM6 measured in single fibres a few milliseconds after a stepwise drop in force from T0 (see supplementary fig. S1C of Piazzesi et al. (2007)). At this time myosin heads that were attached during isometric contraction start to detach at a rate that is faster at lower forces or following larger releases (Reconditi et al. 2004). In the present experiments the length step takes ∼4 ms, and force responses for large releases are probably contaminated by head detachment. The non-linearity of the reduction in spacing can be explained by an increase in the number of detached heads at forces < 0.5T0, assuming that the same process that is responsible for the 1.5% smaller spacing at rest can take place. Detachment of myosin heads also contributes to the non-linearity of the T–ΔL relationship in this force range (Fig. 2C).
Table 1.
Slopes of the linear regressions on the data in Fig. 3
| Reflection | Spacing change (%·T0−1) | Spacing change (%·MPa−1) |
|---|---|---|
| A13 | 0.146 ± 0.019 | 0.80 ± 0.11 |
| M15 | 0.143 ± 0.024 | 0.78 ± 0.13 |
| M11 | 0.178 ± 0.017 | 0.97 ± 0.10 |
| M9 | 0.117 ± 0.032 | 0.64 ± 0.18 |
| M6 | 0.200 ± 0.023 | 1.09 ± 0.13 |
| M6* | 0.26 ± 0.04 | 1.08 ± 0.17 |
Values are mean ± SEM (five muscles). Isometric force was T0 = 183 ± 6 kPa. The mean of the spacing changes for the myosin-based reflections M11 and M15 is: ΔS/S = 0.160 ± 0.015%/T0 or 0.88 ± 0.09%/MPa.
Data from fig. S1C in Piazzesi et al. (2007), measured during phase 3 of steady shortening. T0 in this case was 240 kPa.
The compliances of the thick and thin filaments can be derived from the spacing changes of the associated reflections, taking into account the average force in the region of the filaments that contributes to the reflections and the fact that the increase in the intensity of the A13 reflection on activation is probably associated with the filament overlap region (see Methods). The contribution of the myofilaments to the hs compliance is given by Ford et al. (1981):
| (2) |
where cA, lA and cM, lM are the compliance per unit length and length of thin and thick filaments respectively, and ζ is the length of the overlap region (Ford et al. 1981). At sarcomere length 2.15 μm, lA = 0.975 μm, lM = 0.800 μm, ζ = 0.700 μm, cA = 14.3 ± 1.9 nm MPa−1 μm−1 and cM = 17.5 ± 1.7 nm MPa−1 μm−1, giving Cf = 13.1 ± 1.2 nm MPa−1.
The magnitude and location of the myosin cross-bridge compliance
IM3 is sensitive to axial movements of the myosin heads and can be used as an independent tool to measure their compliance, provided that the mechanical protocol isolates the elastic response of attached myosin heads from changes in their number or conformational disorder, which also would affect IM3. This condition is realised when high frequency oscillations are applied to single muscle fibres in the absence of ATP (in rigor), as all the heads are attached to actin and respond elastically to the perturbation. In this case, IM3 changes can be interpreted in terms of changes of the mass projection accompanying the axial displacement (Δz) of the head–rod junction relative to the actin-attached CD, using the crystallographic structure of the myosin head (Rayment et al. 1993b). The IM3 measurements do not distinguish between tilting and bending of the lever arm (Dobbie et al. 1998; Irving et al. 2000), and it is assumed for simplicity that tilting of the lever arm is the relevant structural change.
Figure 4A and B reports the IM3 changes in response to 3 kHz length oscillations applied to a single fibre from the tibialis anterior muscle of R. temporaria in rigor (data from fig. 2 of Dobbie et al. (1998)). The relationship between IM3 changes and force (open circles in Fig. 4C) can be fitted with a straight line (continuous line) with slope 25 ± 4%/T0. In these fibres T0 was 275 kPa and thus the slope of the IM3–force relationship in SI units is 91 ± 15%/MPa.
Δz is calculated from the observed IM3 using the crystallographic structure of S1 (Rayment et al. 1993b) under the following conditions (see Appendix B): (i) in rigor at low force the two heads of the same myosin molecule (which share a head–rod junction) are assumed to bind two consecutive actin monomers in the same strand of the thin filament with LCD angles of 92 and 127 deg with respect to the filament axis (Reconditi et al. 2003); and (ii) 3 kHz oscillations are superimposed on a steady force of 0.5T0, for which the LCD angles of the two heads are calculated to be 86 and 121 deg (Reconditi et al. (2003) and Appendix B). The increase in IM3 during the stretch phase of the oscillation (Fig. 4B) is explained by tilting of the LCDs towards the perpendicular to the filament axis. The relationship between IM3 and Δz calculated from the model (Fig. 4D) is almost linear and has a slope of 37% nm–1.
The compliance of the array of rigor heads can be calculated as the slope of the IM3–force relationship divided by that of the IM3–Δz relationship, and is (91 ± 15% MPa–1/37% nm–1) = 2.5 ± 0.4 nm MPa−1. This value multiplied by the number of heads working in parallel in the half-sarcomere per m2 of unit CSA (153 × 1015 in frog fibres, calculated from lattice geometry (Mobley & Eisenberg, 1975)) gives an estimate of the compliance of a single head (CS1), which is 0.38 ± 0.06 nm pN−1.
This estimate of the compliance of the myosin head (CS1) can be compared with that of the whole cross-bridge (composed of both S1 and S2, Fig. 1) estimated from the half-sarcomere and filament compliances using eqn (1): 1/βe = (Chs – Cf). In rigor β = 1 and Chs is 15.4 ± 0.4 nm MPa−1 (Piazzesi et al. 2007), while Cf, as estimated in the previous section, is 13.1 ± 1.2 nm MPa−1. Thus, 1/e = (15.4–13.1) = 2.3 ± 1.2 nm MPa−1. The compliance of the single cross-bridge (Ccb) can then be calculated from the lattice geometry as 0.35 ± 0.19 nm pN−1. This value is not significantly different from CS1 estimated above, indicating that the compliance of the cross-bridge is accounted for by the compliance of the S1 alone, with no significant contribution from S2. However, Ccb has an error that is 50% of its value, as its calculation derives from the difference between two numbers that are almost one order of magnitude larger than the result of the subtraction in eqn (1), and this limits the strength of the conclusion.
Discussion
The elasticity of the thick and thin filaments
In this study the compliances of the thick and thin filaments in active muscle have been determined using time-resolved X-ray diffraction from whole muscle of R. esculenta to measure the spacing changes of the high order myosin- and actin-based meridional reflections in response to rapid length changes imposed during isometric contraction.
Measurements of filament compliance using length perturbations in whole muscle have several limitations. Tendons introduce a series compliance that varies between the fibres of each muscle and is on average considerably larger than that of isolated fibres. This is evident from the abscissa intercept of the linear extrapolation from the high force points in Fig. 2C, which is ∼0.02L0 (almost four times larger than that in isolated fibres). Moreover, the frequency response of the actuator used for whole muscle mechanics limits the rise time of the step to 3–4 ms. Consequently, the force change at the end of such a step is reduced, as it is a mixture of three phases (Huxley & Simmons, 1971): the elastic response (phase 1), the quick force recovery due to the working stroke in the myosin heads (phase 2) and the ensuing detachment from actin (phase 3). The contribution of phases 2 and 3 is larger for larger releases because the rate constants of these phases increase with the size of the release and the reduction of force (Ford et al. 1977; Piazzesi et al. 2002a; Reconditi et al. 2004). This explains the deviation from a straight line of the T–ΔL relationship in Fig. 2C, which is particularly marked for the largest release.
The relationship between the spacing changes of the actin- and myosin-based reflections and force (Fig. 3C and D) is also markedly non-linear at forces <100 kPa (∼ 0.5T0), associated with the largest releases. The force dependence of SM6 (blue circles) is similar to that measured in single muscle fibres during phase 3 of the velocity transient following a force drop from T0 (blue crosses from fig. S1C of Piazzesi et al. 2007). Phase 3 marks the time when myosin heads that were originally attached to actin have gone through the working stroke and detach at a rate that is faster at lower loads (Reconditi et al. 2004). We conclude that the apparent deviation from linear elastic behaviour of the thick and thin filaments at loads below 0.5T0 is a consequence of the detachment of myosin heads, and is likely to be due to the same mechanism as that responsible for the lower spacings observed in resting muscles (Fig. 3C and D, triangles, and see below). The changes in SA13, SM11 and SM15 measured 3–4 ms after the start of the length change at forces >0.5 are much less influenced by detachment, and indicate the elasticity of the thin and thick filaments, respectively. The compliances per unit length of thin (cA) and thick (cM) filaments calculated from the slopes of the spacing/force relationships in this region of force are 14.3 ± 1.9 and 17.5 ± 1.7 nm MPa−1 μm−1, respectively. The total equivalent filament compliance (Cf) is 13.1 ± 1.2 nm MPa−1, a value in quite good agreement with the estimates from mechanical experiments in single muscle fibres (Piazzesi et al. 2007; Fusi et al. 2010, 2014).
Non-elastic changes in the periodicities of the thick and thin filaments
In agreement with previous reports, the spacing changes of the actin- and myosin-based meridional reflections between the resting state and the plateau of an isometric contraction (T0) are larger than those following a step perturbation in length or force imposed during isometric contraction and scaled for the relative force change (Huxley et al. 1994, 2006; Wakabayashi et al. 1994; Dobbie et al. 1998; Bordas et al. 1999; Reconditi et al. 2004; Piazzesi et al. 2007).
Here we find that SA13 increases by 0.22% from rest to T0, whereas following a length step the change is 0.15%/T0 in the linear region (Fig. 3D). Huxley et al. (1994) found that SA13 increases by 0.31% from rest to T0, and by 0.23%/T0 during slow stretches. Thus, the relative changes in the two protocols are similar in the two studies, and the higher absolute values reported by Huxley et al. (1994) are probably due to a higher value of T0, associated with differences in species (Rana catesbeiana vs. R. esculenta) and temperature (10 vs. 4°C). Wakabayashi et al. (1994) did not find a difference between the SA13 changes in the two protocols, but inferred SA13 in the slow stretch protocol from the spacings of the actin layer lines at 5.1 and 5.9 nm, respectively, which is problematic (Huxley et al. 1994; Tsaturyan et al. 2005). Bordas et al. (1999) reported that SA13 increases by 0.30% from rest to T0 and decreases by 0.42% from T0 to zero force, obtained with rapid shortening. In the present work, following the step that reduces the force from T0 to ∼0.25T0, SA13 decreases by 0.23%/T0, about 50% more than expected from the extrapolation of the fit to the data above 0.5T0 (Fig. 3D). A force-dependent structural transition, associated with detachment of cross-bridges on the millisecond time scale at forces <0.5T0, is likely to be responsible for the non-linear response of the thin filament in these conditions.
SM11 and SM15, like SM3 and SM6, increase by ∼1.5% from rest to T0 (Huxley & Brown, 1967; Brunello et al. 2006), as a consequence of structural changes in the thick filament upon activation and force generation (Reconditi et al. 2011). If the force of an active muscle is dropped and kept at zero by imposing shortening at the maximum velocity SM3 and SM6 decrease progressively toward the resting value by an amount much more than that expected from filament elasticity (Brunello et al. 2006), indicating a reversal of the process responsible for the increase of periodicity on activation. This same mechanism is probably responsible for the downward deviation of the thick filament spacing–force relationship below 0.5T0 (Fig. 3C).
Compliance and isometric force of the myosin cross-bridge
Rapid stretches and releases imposed during isometric contraction that produce force changes in the range 1.5–0.5T0 are accompanied by changes in the spacings of the higher order actin- and myosin-based meridional X-ray reflections that are linearly related to the force change, and allow the compliance of the thick and thin filaments to be measured. These contribute to a total filament compliance of 13.1 ± 1.2 nm MPa−1, a value in agreement with previous estimates from muscles of both R. temporaria and R. esculenta (Piazzesi et al. 2007; Brunello et al. 2009; Fusi et al. 2010, 2014). In particular, stiffness measurements in single fibres of R. esculenta with a recent refined protocol that estimates the compliance of the elastic element in parallel with the array of myosin cross-bridges, provide a value for Cf of 12.8 ± 0.5 nm MPa−1 (Fusi et al. 2014). The mean of the two estimates (13.0 ± 0.7 nm MPa−1) is used hereafter to minimise the associated errors. Comparing this value with the hs compliance during isometric contraction found with single fibre mechanics in R. esculenta (24.1 ± 0.3 nm MPa−1, Table 2), we conclude that the contribution of filaments to the hs compliance is ∼54%. Thus, according to eqn (1), the contribution of the array of cross-bridges (1/βe) to the hs compliance is 46% (11.1 ± 0.8 nm MPa−1). The hs compliance in rigor is 15.4 ± 0.4 nm MPa−1 (Table 2), so in this case the filament compliance (13 nm MPa−1) represents 84% of the total, because all the myosin heads are attached to actin and the total cross-bridge compliance (1/e) is correspondingly reduced to 2.4 ± 0.8 nm MPa−1 (Table 2). The compliance of the single cross-bridge (Ccb) can then be calculated from the lattice geometry, and is 0.37 ± 0.12 nm pN−1. The compliance of the cross-bridge array during isometric contraction (1/βe) is (11.1/2.4 =) 4.6 times larger than that in rigor. Under the assumption, supported by previous work (Linari et al. 2007), that the elasticity of the individual cross-bridge is the same in isometric contraction and in rigor, the ratio of the compliance of the cross-bridges in rigor to that in isometric contraction indicates that in R. esculenta the fraction of myosin heads that are attached to actin in isometric contraction (β) is 0.22 (Table 2).
Table 2.
Summary of mechanical parameters for Rana esculenta and Rana temporaria
| R. esculenta | R. temporaria | |
|---|---|---|
| T0 (kPa) | 160 ± 4 | 256 ± 17 |
| Chs at T0 (nm MPa−1) | 24.1 ± 0.3 | 19.7 ± 0.9 |
| Chs in rigor (nm MPa−1) | 15.4 ± 0.4 | |
| Cf (nm MPa−1) | 13.0 ± 0.7 | |
| 1/βe (nm MPa−1) | 11.1 ± 0.8 | 6.7 ± 1.1 |
| 1/e (nm MPa−1) | 2.4 ± 0.8 | |
| Ccb (nm pN−1) | 0.37 ± 0.12 | |
| ε (pN nm−1) | 2.7 ± 0.9 | |
| Fraction attached | 0.22 ± 0.06 | 0.36 ± 0.10 |
Data for T0 and Chs at T0 are mean ± SEM of the values reported in the literature. R. esculenta: (Piazzesi et al. 2002a, 2003; Decostre et al. 2005; Brunello et al. 2009; Fusi et al. 2010). R. temporaria: (Piazzesi et al. 2002b, 2007; Reconditi et al. 2004; Brunello et al. 2006; Linari et al. 2009). Chs in rigor is the same in R. esculenta (Fusi et al. 2010) as in R. temporaria (Piazzesi et al. 2007). The value of Cf is the mean of X-ray (this work) and mechanical (Fusi et al. 2014) estimates (see text for details).
When the same analysis is applied to single fibres from R. temporaria, in which the hs compliance in isometric contraction is somewhat smaller (19.7 ± 0.9 nm MPa−1, Table 2), the contribution of the filaments to the hs compliance is (13.0/19.7 =) ∼65%, leaving 35% (6.7 ± 1.1 nm MPa−1) in the array of cross-bridges. As the compliance of the array of cross-bridges in rigor is independent of species (2.4 nm MPa−1, Table 2), the compliance of the cross-bridges in isometric contraction in R. temporaria is (6.7/2.4 =) 2.8 times larger than that in rigor. This indicates that in this species the fraction of myosin heads attached to actin at the plateau of the isometric contraction is 0.36. Within the limits of experimental error, which becomes large in the calculation of compliance of cross-bridges using eqn (1), the comparison of mechanical parameters in the two species (Table 2) leads to the conclusion that the lower isometric force in R. esculenta (160 kPa, ∼60% of that in R. temporaria at the same 4°C temperature) is accounted for by a corresponding reduction in the fraction of actin-attached heads. In fact, when the difference in the attached fraction is taken into account, the force per attached head is ∼5 pN, independent of the species.
The above analysis, by integrating X-ray and stiffness measurements, provides an estimate of cross-bridge compliance (0.37 ± 0.12 nm pN−1) with a reduced error. A further demonstration of the reliability of the results is the finding that rigor data from the two species converge to give the same estimate of Ccb. Finally, note that these conclusions are in full agreement with the finding from mechanical experiments that the strain of the myosin cross-bridge in isometric contraction is ∼1.7 nm independently of the species (Brunello et al. 2006, 2009; Fusi et al. 2010, 2014).
The source of the cross-bridge compliance and the mechanism of force generation
During 3 kHz oscillations imposed on a muscle fibre in rigor, the myosin cross-bridges remain attached to actin and undergo cyclical elastic distortions that appear as changes in the intensity of the M3 reflection. Using the crystallographic structure of the myosin head (S1), the IM3 changes can be interpreted in terms of tilting of the LCD that accompanies the axial displacement (Δz) of the S1–S2 junction relative to the actin-attached CD of the myosin head during the elastic response (Fig. 1). This analysis gives an estimate of the compliance of the single myosin head (CS1) of 0.38 ± 0.06 nm pN−1. The compliance Ccb of the myosin cross-bridge (i.e. the S1 head plus the S2 domain that joins the head to the thick filament), determined by integrating X-ray and mechanical measurements in contracting fibres, was 0.37 ± 0.12 nm pN−1. Thus, the value of the compliance of S2 (CS2 = Ccb − CS1) determined from the structural simulation of IM3 changes in rigor is −0.01 ± 0.13 nm pN−1 and not significantly different from zero, providing evidence that the elastic distortion of the myosin head accounts for the entire cross-bridge compliance.
This analysis is based on the assumption that the S2 domains of all the cross-bridges exhibit linear elasticity. The presence of a fraction of cross-bridges with a slack S2 (Kaya & Higuchi, 2010, 2013) in our rigor experiments is likely to be prevented by the procedure used for rigor induction (Dobbie et al. 1998; Linari et al. 1998; Piazzesi et al. 2007). Moreover, myosin cross-bridges are unlikely to have become slack during the shortening phase of the rigor oscillations (Dobbie et al. 1998) because the oscillations were superimposed on a steady force of ∼0.5T0. A further argument against the presence of slack S2 in some cross-bridges in the conditions of our experiments is that it would have led to an overestimate of Ccb from mechanical measurements but an underestimate of CS1 (because not all heads contribute to the observed IM3 changes during the oscillations in rigor), which, given the present result that Ccb and CS1 have the same value, could only occur if S2 had a negative compliance.
Our conclusion that the compliance of S2 is negligible compared with that of S1 confirms that of earlier studies on the IM3 changes following step stretches and releases superimposed on isometric contraction in single muscle fibres (Irving et al. 2000; Piazzesi et al. 2002b) and is consistent with the coiled-coil structure of S2, which indicates a stretching stiffness of 60–80 pN nm−1 (Adamovic et al. 2008), more than one order of magnitude larger than that found for the myosin head. The very low compliance of S2 makes even more unlikely the idea of Knupp et al. (2009) that force can be generated by stochastic 11 nm lever arm tiltings in isometric conditions.
The source of the compliance within the myosin head cannot be determined by X-ray diffraction studies of muscle fibres. Calculation of the flexural rigidity of the LCD provides an estimate of its stiffness in the expected range (2 pN nm−1; Howard & Spudich, 1996) to account for the head compliance. However, the recent finding that mutations in the β isoform of the myosin heavy chain located in the converter region of the myosin head modulate the compliance of the cross-bridge (Seebohm et al. 2009) gives strong support to the idea that the compliance is concentrated in the converter region within the head (Houdusse et al. 2000).
The cross-bridge stiffness found here, (1/Ccb = ) 2.7 ± 0.9 pN nm−1, is consistent with values reported in previous studies using single fibre mechanics (Decostre et al. 2005; Piazzesi et al. 2007) and solidifies the energetics-based argument that isometric force is generated by a structural change in the actin-attached myosin heads that is a small fraction of the crystallographic working stroke. This conclusion supports the X-ray diffraction evidence that the conformational dispersion of attached myosin heads in isometric contraction is limited to a narrow distribution of LCD angles corresponding to an early sub-step of the working stroke (Irving et al. 2000; Reconditi et al. 2004; Huxley et al. 2006; Piazzesi et al. 2007).
A kinetic model of the working stroke in which actin-attached myosin heads are distributed between five sub-states (m1–m5), separated by 2.75 nm steps, has been recently put forward to explain the kinetics of the early phases of the response to step changes in length or force (Linari et al. 2009; Piazzesi et al. 2014). According to that model (Fig. 5, middle panel), only states m1, m2 and m3 are populated in isometric contraction, with m1 and m2 states sharing the larger fractional occupancy, to account for an average strain of 1.7 nm. Larger degrees of LCD tilting occur following step releases or a reduction of the load below T0 (Fig. 5, lower panel).
Figure 5. Myosin head sub-states in the working stroke and their occupancy in isometric contraction and following a release.

Upper panel: five different states (m1–m5) of the myosin head characterised by orientations of the LCD separated by angles corresponding to an axial displacement of 2.75 nm of the tip of the LCD, under zero force. Middle panel: fractional occupancy of the different states in isometric contraction according to Linari et al. (2009); the weighted mean of the LCD tilting is 60 deg, in accordance with Fig. 1A. Lower panel: fractional occupancy of states at the end of the quick force recovery following a step release of 3 nm.
The model provides an independent estimate of the filament compliance as the value that is required to reproduce the rate of quick force recovery following a step release, given rate functions obtained by fitting the early isotonic shortening following a stepwise drop in force. This estimate of filament compliance was 12.1–13.2 nm MPa−1 (Piazzesi et al. 2014), in good agreement with the present results. This value was obtained by determining the compliance that is required to fit the rate of quick force recovery following a step release with the rate functions for state transitions selected to fit the early isotonic shortening following a stepwise drop in force.
If completion of the ATP hydrolysis cycle is tightly coupled to the 11 nm tilting of the LCD, the conclusion in this work that the high stiffness prevents such tilting in isometric contraction appears to be inconsistent with the relatively high isometric rate of ATP splitting (∼1/4 of the maximum rate observed during shortening; Woledge et al. 1985 and references therein). The apparent contradiction is resolved if the biochemical and mechanical cycles are not tightly coupled. This view is supported by recent demonstrations that (i) in isometric contraction orthophosphate (Pi) can also be released from the catalytic site of the myosin head following early detachment of the force-generating cross-bridge (Caremani et al. 2008; Linari et al. 2010) and (ii) during shortening the release of hydrolysis products (Pi and ADP) and the termination of the ATPase cycle can occur at any stage of the working stroke (Caremani et al. 2013).
Relationship to in vitro structural and mechanical studies
X-ray crystallographic and electron microscopy studies on the structural correlates of the four relevant states of the myosin–actin ATPase cycle (Lymn & Taylor, 1971) have been successful in defining two main structural states (the pre-working stroke state and the rigor-like state at the end of the working stroke). In the pre-working stroke state the actin binding cleft is open, the nucleotide binding pocket is closed and contains the hydrolysis products Pi and ADP, and the LCD is in the ‘up’ conformation; in the rigor-like state the actin binding cleft is closed, the nucleotide binding pocket is open, the catalytic site has released the hydrolysis products and the LCD is in the ‘down’ conformation. The transition from the up to the down conformation accounts for the 11 nm working stroke (Rayment et al. 1993b; Dominguez et al. 1998; Geeves & Holmes, 2005). Thus, release of the ATP hydrolysis products, ADP and Pi, produces a stroke of the same size as that observed in situ when the motor load is suddenly reduced to zero (Piazzesi et al. 2002a; Reconditi et al. 2004). Intermediate states of the actin-attached myosin head under strain, such as those depicted in Fig. 5 on the basis of mechanical and structural studies in situ, cannot be reproduced in crystallographic studies of myosin head fragments in the absence of actin.
The molecular flexibility of S1 in the ATP-free state has recently been detected by negative stain electron microscopy (Billington et al. 2014). The large range of angles between the LCD and the CD in these images was interpreted in terms of an apparent stiffness of 0.37 pN nm−1, one order of magnitude smaller than that measured in situ when the CD is attached to actin. Although the results of this electron microscopy study are consistent with flexibility within the myosin head near the junction between the CD and the LCD in a given nucleotide state, it also demonstrates the limits of current in vitro structural techniques to detect the states of the actin-attached myosin head under strain.
The orientation of the LCD, determined in situ by attaching fluorescent probes to light chains in skinned muscle fibres, shows in general a quite broad distribution in isometric contraction (Baker et al. 1998; Burghardt et al. 2011). The association of such a broad distribution with actin-attached myosin heads would not be consistent with a motor stiffness of ∼3 pN nm−1 according to the energetics argument above, but is more likely to be associated with the large fraction of detached heads during isometric contraction. Electron paramagnetic resonance spectroscopy evidence that detachment of up to 50% of rigor heads in skinned fibres by ATP analogues was accompanied by only a small reduction in the fibre stiffness (Pate & Cooke, 1988) was interpreted as showing that only one of the two attached heads in each myosin molecule is stiff. However, when the contribution of filament and series compliance is taken into account, the electron paramagnetic resonance and stiffness data are consistent with the conclusion that the stiffness of a myosin with two attached heads is twice that of a single head (Linari et al. 2007). This further supports the X-ray evidence reported here that the source of elasticity of the myosin motor is in the head and not in S2.
Current single-molecule techniques using laser trapping are also unable to resolve the relevant structural and mechanical states of skeletal muscle myosin II, as this motor protein is designed to work in an ensemble and has evolved towards very short-lived interactions with actin, so that it is detached from actin for most of the ATP hydrolysis cycle. Single actin–myosin interactions can be detected if their lifetime is increased by reducing ATP concentration down to a few tens of micromolar. In this way single working strokes of 5–10 nm at low load have been measured (Finer et al. 1994; Molloy et al. 1995; Tyska et al. 1999). However, due to the large series compliance intrinsic to these single molecule mechanical measurements, neither the high load stroke nor the isometric force have been reliably measured for single molecules of myosin II. The reported values of isometric force are in general smaller (0.5–3 pN) than the values determined with fibre mechanics and reported here. A force of 9 pN (80% larger than that from fibre mechanics) was measured by simulating nominally isometric conditions using a sophisticated dynamic force feedback (Takagi et al. 2006). However, the time constant of the feedback was too large to prevent transient shortening, so that the original actin filament position was recovered by applying a stretch. A faster force feedback has recently been realised (Capitanio et al. 2012) that allows the force-generating event to be resolved within the first millisecond following the attachment. In this way, in agreement with fibre mechanics (Piazzesi et al. 2007), the working stroke of a single interaction has been found to be ∼5 nm independently of the load. However, neither of these experiments directly determined the size of the stroke that generates the isometric force, and the necessity to keep the ATP concentration low prevented measurement of the interaction kinetics under physiological conditions. Using a preparation in which myosin II molecules are part of a synthetic co-filament (Kaya & Higuchi, 2010) and a quantum dot on the actin filament, it has been possible to overcome the limits imposed by the compliance of the link between the actin filament and the trapped bead and to estimate the stiffness of the myosin cross-bridge in rigor. Under pulling forces comparable to those in situ, the measured stiffness was 2.6–2.9 pN nm−1, similar to that reported here. However, also in this case, the compliance of the links prevented the measurement of the force and the strain of the myosin heads under isometric conditions.
The organisation of myosin II molecules into an ordered array of parallel elements in each half-sarcomere of the muscle fibre, combined with fast sarcomere level mechanics and X-ray diffraction, makes the cell-based approach the only one that is able to define the relationship between the force and strain in the individual myosin head domain. Integrating the data with the X-ray structural information on filament compliance from whole muscle, we define the mechanical properties of all the mechanically relevant elements of the half-sarcomere and we find that the 0.37 nm pN−1 compliance of the myosin cross-bridge is accounted for by the compliance in the head itself. The resulting high stiffness of the myosin head (∼3 pN nm−1) reinforces the evidence from X-ray diffraction experiments (Reconditi et al. 2004; Huxley et al. 2006) that actin-attached myosin heads generate isometric force with a narrow distribution of LCD angles, corresponding to an early sub-step of the crystallographic working stroke.
Acknowledgments
We thank E. Taylor for critical reading of the manuscript and M. Dolfi (University of Florence), J. Gorini (ESRF) and the mechanical workshop of the Department of Physics and Astronomy (University of Florence) for electronic and mechanical engineering support.
Glossary
- A13
13th order actin-based meridional reflection
- β
fraction of attached myosin heads
- cA
compliance per unit length of the thin filament
- CA
contribution of the thin filament to half-sarcomere compliance
- Ccb
compliance of the individual cross-bridge
- Cf
cumulative contribution of filament compliance to half-sarcomere compliance
- Chs
compliance of the half-sarcomere
- cM
compliance per unit length of the thick filament
- CM
contribution of the thick filament to half-sarcomere compliance
- CS1
compliance of the myosin head
- CS2
compliance of the S2 portion of the myosin molecule
- CD
catalytic domain of the myosin head
- CSA
cross-sectional area
- d
size of the working stroke
- ΔL
step length change
- Δz
axial displacement of the head–rod junction relative to the actin-attached CD
- e
stiffness of the array of cross-bridges when all the myosin heads are attached to actin
- ESRF
European Synchrotron Radiation Facility
- ε
stiffness of the individual cross-bridge
- FWHM
full width at half maximum
- ζ
length of the overlap region
- hs
half-sarcomere
- IA13
intensity of the A13 reflection
- IM3
intensity of the M3 reflection
- IM6
intensity of the M6 reflection
- IM9
intensity of the M9 reflection
- IM11
intensity of the M11 reflection
- IM15
intensity of the M15 reflection
- lA
length of the thin filament
- lM
length of the thick filament
- L0
muscle length
- L1
length of the non-overlap region of the thin filament
- L2
length of the overlap region of the thin filament
- LCD
light chain domain of the myosin head
- m1–m5
sub-states of the attached myosin heads
- M3
3rd order myosin-based meridional reflection
- M6
6th order myosin-based meridional reflection
- M9
9th order myosin-based meridional reflection
- M11
11th order myosin-based meridional reflection
- M15
15th order myosin-based meridional reflection
- Pi
inorganic phosphate
- SA13
spacing of the A13 reflection
- SM3
spacing of the M3 reflection
- SM6
spacing of the M6 reflection
- SM11
spacing of the M11 reflection
- SM15
spacing of the M15 reflection
- S1
head domain of myosin
- S2
rod-like fragment of the myosin molecule that joins S1 to the thick filament
- T
force
- T0
steady isometric force during tetanic stimulation
Appendix A: spacing of the A13 reflection is not sensitive to the thick filament compliance
The intensity of the actin-based A13 reflection, due to the axial 2.73 nm repeat of the actin monomers along the thin filament, almost doubles from rest to the plateau of an isometric contraction (Fig. 3B), probably as a consequence of the attachment of the myosin head domains to actin. In principle this could imply that the spacing changes of the A13 reflection accompanying the elastic response of the half-sarcomere depend not only on the compliance of the thin filament but also, through the cross-bridge links, on that of the thick filament. To check this possibility, we built a simplified 1D model of thin and thick filaments interacting through the attached myosin heads. In the model, the ∼1000 nm long thin filament is represented by 367 actin monomers with axial periodicity 2.73 nm. The ∼700 nm overlap region of one half of a thick filament is represented by 49 myosin heads facing the thin filament, the S1–S2 junctions (myosin heavy chain residue Lys843) of which have an axial periodicity of 14.56 nm, the spacing of the M3 reflection at T0. The CD of the heads attaches to actin monomers in the conformation defined by the electron density map of the nucleotide-free actin–S1 complex (Holmes et al. 2003). Starting from the M-line, the first head attaches to the first actin monomer at the free end of the actin filament with an orientation of its LCD (defined in Fig. 1B by the angle θ between the vector joining the head–rod junction (Lys843, grey circle) with the fulcrum between the CD and LCD (Cys707, yellow circle) and the filament axis) of 60 deg, which corresponds to the average value for isometric contraction (Irving et al. 2000). The other heads attach to the actin monomer that gives the value of θ closest to 60 deg. The mismatch between the periodicities along the actin and the myosin filament introduces a dispersion in θ of ±8 deg, about half the ±17 deg dispersion determined experimentally (Reconditi et al. 2004; Huxley et al. 2006). The ratio of heads to actin monomers in the model is (49/367 =) 0.13, while the ratio between heads and actin monomers in the half sarcomere is ((49·6)/(367·2) =) 0.40, and thus the model described here implies that the fraction of attached heads is 0.13/0.4 = 0.33, which is close to that reported in previous studies for isometric contraction (Park-Holohan et al. 2012, and references therein).
To test the influence of thick filament compliance on the change in the spacing of the A13 reflection following an elastic force change we assumed a rigid thin filament (cA = 0) and a compliant thick filament (cM = 3.2 nm/T0/μm), and simulated the effect of a force increase to T0. Assuming a half bare zone of ∼80 nm (Linari et al. 2000), the S1–S2 junction of the first head moves away from the mid-point of the thick filament by (80·0.0032 =) 0.26 nm, and the 48 segments of half-thick filament between the S1 and S2 junctions of the LCDs of the 49 heads elongate by 14.56·0.0032·(49 − m)/49 nm, where m = 1, 2, …, 48 is the order of the segment starting from that closest to the M-line (Fig. 6). This reflects the fact that the force on the various segments is transmitted from the end of the half-sarcomere through the cross-bridges, so the force decreases linearly along the half thick filament (black line) from T0 at the bare zone to zero at the end farthest from the bare zone. θ for each LCD was adjusted to accommodate the shift between the S1–S2 junction and actin binding site introduced by this value of thick filament compliance.
Figure 6. Distribution of force and strain along the half-thick filament and conformations of the attached myosin heads.
A, distribution of the force (black) and of the strain (red) along the half-thick filament (violet) normalised by their maximum values. B, conformations of the myosin heads attached to actin monomers (white spheres, separated by 2.73 nm) every 14.56 nm according to the model described in the text. CD are blue and LCD are red and green. Assuming that the thin filament compliance is zero, a force increase by T0 increases the strain only in the thick filament (violet), as shown by the changes in the orientation of the LCDs (green), while the actin monomers and the CDs do not move. The arrow at the right end indicates the direction of strain and the two vertical lines measure the cumulative strain at the distal tip of the thick filament.
The Fourier transform of the axial mass distribution of the actin monomers and the myosin heads in the region of the A13 reflection was calculated (i) without thick filament compliance (grey trace in Fig. 7) and (ii) with thick filament compliance (black) produced by an increase in the half-sarcomere force of T0. The simulation indicates that the spacing change of the A13 reflection induced by thick filament compliance is ∼0.0005%. Thus, the compliance of the thick filament has a negligible effect on the spacing of the A13 reflection, which depends solely on the compliance of the thin filament.
Figure 7. Axial profiles of the A13 reflection.

The profiles are calculated as described in the text. Grey, without strain in the thick filament; black, with strain due to a force T0.
Appendix B: relationship between IM3 and axial movement of the myosin heads in rigor
IM3 changes induced by imposing 3 kHz oscillations on a muscle fibre in rigor (Dobbie et al. 1998) were related to the axial movement of the myosin heads by assuming that the elastic distortion of the attached rigor heads can be represented by tilting of the LCD, with no change in the conformation of the actin-attached CD, using the crystallographic model of S1 (Rayment et al. 1993a). We assume that in rigor the two heads of each myosin molecule that share the S1–S2 junction have their CDs attached to adjacent monomers on the same strand of the actin filament with an axial separation of 5.46 nm (Reconditi et al. 2003), in the conformation defined by the electron density map of the nucleotide-free actin–S1 complex (Holmes et al. 2003). With this constraint the tilt of the two LCDs is not independent and the distortion of the head pair can be conveniently defined by the axial displacement Δz of the shared S1–S2 junction relative to the CD (Fig. 8), with Δz = 0 in the absence of strain. IM3 is calculated as the Fourier transform of the axial mass distribution of the head pair at the periodicity of the M3 reflection (14.44 nm; Reconditi et al. 2003) for different values of Δz (Fig. 9). The relationship between IM3 and Δz depends on the orientation of the LCDs with respect to the filament axis, expressed as the angle θ defined above, in the absence of strain. In rigor conditions at low force (<0.05T0) the θ values for the two LCDs of each myosin molecule are 126 and 91 deg (Reconditi et al. 2003), with a mean value of 108.5 deg corresponding to that for the in vitro actin–S1 complex in the absence of ATP (Holmes et al. 2003). When a fibre in rigor is stretched to a force of about 0.45T0, IM3 increases by 37% (Reconditi et al. 2003). From the relationship between IM3 and Δz (Fig. 9), the corresponding Δz is ∼0.8 nm (grey circle), and the two θ values become 121 and 86 deg, respectively. The average force level during the imposition of 3 kHz oscillations in rigor in the experiment in Fig. 4 was 0.5T0 (Dobbie et al. 1998), corresponding to Δz ∼0.8 nm. With this starting point for the head conformation, the model predicts that during the imposed oscillations the relationship ΔIM3 vs. Δz is linear for Δz < 0.5 nm to a very good approximation, and has a slope of ∼37% nm–1 (Fig. 4D).
Figure 8. Structural model used to simulate the IM3 changes that accompany length changes imposed in rigor.
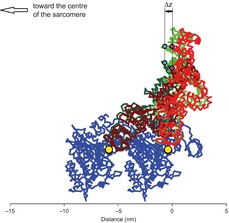
The two CDs of each myosin molecule (blue) are separated axially by 5.46 nm; LCDs in rigor at low force (light and dark red) have θ values of 91 and 126 deg, respectively. Under a force of 0.5T0 the corresponding values are 86 deg (light green) and 121 deg (dark green), respectively. Yellow circles are the fulcra (Cys 707) for rotation of the LCDs with respect to their CDs; magenta circles are the S1–S2 junctions (Lys 843) at low force; cyan circles are the S1–S2 junctions at 0.5T0. The black arrow indicates the force-induced axial displacement Δz of the S1–S2 junctions relative to the CDs.
Figure 9. Predicted relationships between the intensity of the M3 reflection (IM3) and the displacement Δz of the shared S1–S2 junction of the two myosin heads relative to the CD.
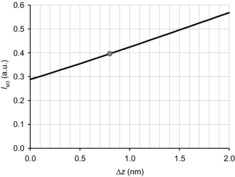
Here Δz = 0 corresponds to the conformation of the two heads in low force rigor as described in the text and in Fig. 6. The grey dot indicates the starting point (Δz = 0.8 nm) for the length oscillations imposed on a steady force of 0.5T0. Δz is positive for the stretch corresponding to a movement of the CD towards the Z-line relative to the S1–S2 junction.
Additional Information
Competing interests
None declared.
Author contributions
The experiments were performed at the ESRF. E.B., M.C., L.M., M.L., M.I., G.P., V.L. and M.R. contributed to the conception and design of the experiments, the collection, analysis and interpretation of data, and drafting the article or revising it critically for important intellectual content. M.F.M. and T.N. contributed to data collection and analysis. All authors approved the final version of the manuscript, all persons designated as authors qualify for authorship and all those who qualify for authorship are listed.
Funding
Financial support was provided by Ente Cassa di Risparmio di Firenze 2010.1402, FIRB-Futuro in Ricerca project RBFR08JAMZ, MIUR-PRIN project 2010R8JK2X and CNISM Progetto d’Innesco della Ricerca Esplorativa 2007 (Italy), MRC (UK) and ESRF.
Author's present address
L. Melli: Laboratory of Molecular Physiology, National Heart, Lung and Blood Institute, National Institutes of Health, Bethesda, MD 20892, USA.
References
- Adamovic I, Mijailovich SM, Karplus M. The elastic properties of the structurally characterized myosin II S2 subdomain: a molecular dynamics and normal mode analysis. Biophys J. 2008;94:3779–3789. doi: 10.1529/biophysj.107.122028. [DOI] [PMC free article] [PubMed] [Google Scholar]
- Baker JE, Brust-Mascher I, Ramachandran S, LaConte LE, Thomas DD. A large and distinct rotation of the myosin light chain domain occurs upon muscle contraction. Proc Natl Acad Sci U S A. 1998;95:2944–2949. doi: 10.1073/pnas.95.6.2944. [DOI] [PMC free article] [PubMed] [Google Scholar]
- Barclay CJ, Woledge RC, Curtin NA. Inferring crossbridge properties from skeletal muscle energetics. Prog Biophys Mol Biol. 2010;102:53–71. doi: 10.1016/j.pbiomolbio.2009.10.003. [DOI] [PubMed] [Google Scholar]
- Billington N, Revill DJ, Burgess SA, Chantler PD, Knight PJ. Flexibility within the heads of muscle myosin-2 molecules. J Mol Biol. 2014;426:894–907. doi: 10.1016/j.jmb.2013.11.028. [DOI] [PMC free article] [PubMed] [Google Scholar]
- Bordas J, Svensson A, Rothery M, Lowy J, Diakun GP, Boesecke P. Extensibility and symmetry of actin filaments in contracting muscles. Biophys J. 1999;77:3197–3207. doi: 10.1016/S0006-3495(99)77150-X. [DOI] [PMC free article] [PubMed] [Google Scholar]
- Brunello E, Bianco P, Piazzesi G, Linari M, Reconditi M, Panine P, Narayanan T, Helsby WI, Irving M, Lombardi V. Structural changes in the myosin filament and cross-bridges during active force development in single intact frog muscle fibres: stiffness and X-ray diffraction measurements. J Physiol. 2006;577:971–984. doi: 10.1113/jphysiol.2006.115394. [DOI] [PMC free article] [PubMed] [Google Scholar]
- Brunello E, Fusi L, Reconditi M, Linari M, Bianco P, Panine P, Narayanan T, Piazzesi G, Lombardi V, Irving M. Structural changes in myosin motors and filaments during relaxation of skeletal muscle. J Physiol. 2009;587:4509–4521. doi: 10.1113/jphysiol.2009.176222. [DOI] [PMC free article] [PubMed] [Google Scholar]
- Burghardt TP, Josephson MP, Ajtai K. Single myosin cross-bridge orientation in cardiac papillary muscle detects lever-arm shear strain in transduction. Biochemistry. 2011;50:7809–7821. doi: 10.1021/bi2008992. [DOI] [PMC free article] [PubMed] [Google Scholar]
- Capitanio M, Canepari M, Maffei M, Beneventi D, Monico C, Vanzi F, Bottinelli R, Pavone FS. Ultrafast force-clamp spectroscopy of single molecules reveals load dependence of myosin working stroke. Nat Methods. 2012;9:1013–1019. doi: 10.1038/nmeth.2152. [DOI] [PubMed] [Google Scholar]
- Caremani M, Dantzig J, Goldman YE, Lombardi V, Linari M. Effect of inorganic phosphate on the force and number of myosin cross-bridges during the isometric contraction of permeabilized muscle fibers from rabbit psoas. Biophys J. 2008;95:5798–5808. doi: 10.1529/biophysj.108.130435. [DOI] [PMC free article] [PubMed] [Google Scholar]
- Caremani M, Melli L, Dolfi M, Lombardi V, Linari M. The working stroke of the myosin II motor in muscle is not tightly coupled to release of orthophosphate from its active site. J Physiol. 2013;591:5187–5205. doi: 10.1113/jphysiol.2013.257410. [DOI] [PMC free article] [PubMed] [Google Scholar]
- Close RI. Dynamic properties of mammalian skeletal muscles. Physiol Rev. 1972;52:138–197. doi: 10.1152/physrev.1972.52.1.129. [DOI] [PubMed] [Google Scholar]
- Colombini B, Nocella M, Bagni MA, Griffiths PJ, Cecchi G. Is the cross-bridge stiffness proportional to tension during muscle fibre activation? Biophys J. 2010;98:2582–2590. doi: 10.1016/j.bpj.2010.02.014. [DOI] [PMC free article] [PubMed] [Google Scholar]
- Cooke R, Franks K. All myosin heads form bonds with actin in rigor rabbit skeletal muscle. Biochemistry. 1980;19:2265–2269. doi: 10.1021/bi00551a042. [DOI] [PubMed] [Google Scholar]
- Decostre V, Bianco P, Lombardi V, Piazzesi G. Effect of temperature on the working stroke of muscle myosin. Proc Natl Acad Sci U S A. 2005;102:13927–13932. doi: 10.1073/pnas.0506795102. [DOI] [PMC free article] [PubMed] [Google Scholar]
- Dobbie I, Linari M, Piazzesi G, Reconditi M, Koubassova N, Ferenczi MA, Lombardi V, Irving M. Elastic bending and active tilting of myosin heads during muscle contraction. Nature. 1998;396:383–387. doi: 10.1038/24647. [DOI] [PubMed] [Google Scholar]
- Dominguez R, Freyzon Y, Trybus KM, Cohen C. Crystal structure of a vertebrate smooth muscle myosin motor domain and its complex with the essential light chain: visualization of the pre-power stroke state. Cell. 1998;94:559–571. doi: 10.1016/s0092-8674(00)81598-6. [DOI] [PubMed] [Google Scholar]
- Edman KA. Non-linear myofilament elasticity in frog intact muscle fibres. J Exp Biol. 2009;212:1115–1119. doi: 10.1242/jeb.020982. [DOI] [PubMed] [Google Scholar]
- Finer JT, Simmons RM, Spudich JA. Single myosin molecule mechanics: piconewton forces and nanometre steps. Nature. 1994;368:113–119. doi: 10.1038/368113a0. [DOI] [PubMed] [Google Scholar]
- Ford LE, Huxley AF, Simmons RM. Tension responses to sudden length change in stimulated frog muscle fibres near slack length. J Physiol. 1977;269:441–515. doi: 10.1113/jphysiol.1977.sp011911. [DOI] [PMC free article] [PubMed] [Google Scholar]
- Ford LE, Huxley AF, Simmons RM. The relation between stiffness and filament overlap in stimulated frog muscle fibres. J Physiol. 1981;311:219–249. doi: 10.1113/jphysiol.1981.sp013582. [DOI] [PMC free article] [PubMed] [Google Scholar]
- Fusi L, Brunello E, Reconditi M, Piazzesi G, Lombardi V. The non-linear elasticity of the muscle sarcomere and the compliance of myosin motors. J Physiol. 2014;592:1109–1118. doi: 10.1113/jphysiol.2013.265983. [DOI] [PMC free article] [PubMed] [Google Scholar]
- Fusi L, Reconditi M, Linari M, Brunello E, Elangovan R, Lombardi V, Piazzesi G. The mechanism of the resistance to stretch of isometrically contracting single muscle fibres. J Physiol. 2010;588:495–510. doi: 10.1113/jphysiol.2009.178137. [DOI] [PMC free article] [PubMed] [Google Scholar]
- Geeves MA, Holmes KC. The molecular mechanism of muscle contraction. Adv Protein Chem. 2005;71:161–193. doi: 10.1016/S0065-3233(04)71005-0. [DOI] [PubMed] [Google Scholar]
- Holmes KC, Angert I, Kull FJ, Jahn W, Schroder RR. Electron cryo-microscopy shows how strong binding of myosin to actin releases nucleotide. Nature. 2003;425:423–427. doi: 10.1038/nature02005. [DOI] [PubMed] [Google Scholar]
- Houdusse A, Szent-Gyorgyi AG, Cohen C. Three conformational states of scallop myosin S1. Proc Natl Acad Sci U S A. 2000;97:11238–11243. doi: 10.1073/pnas.200376897. [DOI] [PMC free article] [PubMed] [Google Scholar]
- Howard J, Spudich JA. Is the lever arm of myosin a molecular elastic element. Proc Natl Acad Sci U S A. 1996;93:4462–4464. [PubMed] [Google Scholar]
- Huxley AF, Simmons RM. Proposed mechanism of force generation in striated muscle. Nature. 1971;233:533–538. doi: 10.1038/233533a0. [DOI] [PubMed] [Google Scholar]
- Huxley HE, Brown W. The low-angle x-ray diagram of vertebrate striated muscle and its behaviour during contraction and rigor. J Mol Biol. 1967;30:383–434. doi: 10.1016/s0022-2836(67)80046-9. [DOI] [PubMed] [Google Scholar]
- Huxley HE, Reconditi M, Stewart A, Irving T. X-ray interference studies of crossbridge action in muscle contraction: evidence from quick releases. J Mol Biol. 2006;363:743–761. doi: 10.1016/j.jmb.2006.08.075. [DOI] [PubMed] [Google Scholar]
- Huxley HE, Simmons RM, Faruqi AR, Kress M, Bordas J, Koch MH. Changes in the X-ray reflections from contracting muscle during rapid mechanical transients and their structural implications. J Mol Biol. 1983;169:469–506. doi: 10.1016/s0022-2836(83)80062-x. [DOI] [PubMed] [Google Scholar]
- Huxley HE, Stewart A, Sosa H, Irving T. X-ray diffraction measurements of the extensibility of actin and myosin filaments in contracting muscle. Biophys J. 1994;67:2411–2421. doi: 10.1016/S0006-3495(94)80728-3. [DOI] [PMC free article] [PubMed] [Google Scholar]
- Irving M, Piazzesi G, Lucii L, Sun YB, Harford JJ, Dobbie IM, Ferenczi MA, Reconditi M, Lombardi V. Conformation of the myosin motor during force generation in skeletal muscle. Nat Struct Biol. 2000;7:482–485. doi: 10.1038/75890. [DOI] [PMC free article] [PubMed] [Google Scholar]
- Kaya M, Higuchi H. Nonlinear elasticity and an 8-nm working stroke of single myosin molecules in myofilaments. Science. 2010;329:686–689. doi: 10.1126/science.1191484. [DOI] [PubMed] [Google Scholar]
- Kaya M, Higuchi H. Stiffness, working stroke, and force of single-myosin molecules in skeletal muscle: elucidation of these mechanical properties via nonlinear elasticity evaluation. Cell Mol Life Sci. 2013;70:4275–4292. doi: 10.1007/s00018-013-1353-x. [DOI] [PMC free article] [PubMed] [Google Scholar]
- Knupp C, Offer G, Ranatunga KW, Squire JM. Probing muscle myosin motor action: x-ray (m3 and m6) interference measurements report motor domain not lever arm movement. J Mol Biol. 2009;390:168–181. doi: 10.1016/j.jmb.2009.04.047. [DOI] [PubMed] [Google Scholar]
- Linari M, Caremani M, Lombardi V. A kinetic model that explains the effect of inorganic phosphate on the mechanics and energetics of isometric contraction of fast skeletal muscle. Proc R Soc B. 2010;277:19–27. doi: 10.1098/rspb.2009.1498. [DOI] [PMC free article] [PubMed] [Google Scholar]
- Linari M, Caremani M, Piperio C, Brandt P, Lombardi V. Stiffness and fraction of myosin motors responsible for active force in permeabilized muscle fibers from rabbit psoas. Biophys J. 2007;92:2476–2490. doi: 10.1529/biophysj.106.099549. [DOI] [PMC free article] [PubMed] [Google Scholar]
- Linari M, Dobbie I, Reconditi M, Koubassova N, Irving M, Piazzesi G, Lombardi V. The stiffness of skeletal muscle in isometric contraction and rigor: the fraction of myosin heads bound to actin. Biophys J. 1998;74:2459–2473. doi: 10.1016/S0006-3495(98)77954-8. [DOI] [PMC free article] [PubMed] [Google Scholar]
- Linari M, Piazzesi G, Dobbie I, Koubassova N, Reconditi M, Narayanan T, Diat O, Irving M, Lombardi V. Interference fine structure and sarcomere length dependence of the axial x-ray pattern from active single muscle fibers. Proc Natl Acad Sci U S A. 2000;97:7226–7231. doi: 10.1073/pnas.97.13.7226. [DOI] [PMC free article] [PubMed] [Google Scholar]
- Linari M, Piazzesi G, Lombardi V. The effect of myofilament compliance on kinetics of force generation by myosin motors in muscle. Biophys J. 2009;96:583–592. doi: 10.1016/j.bpj.2008.09.026. [DOI] [PMC free article] [PubMed] [Google Scholar]
- Lymn RW, Taylor EW. Mechanism of adenosine triphosphate hydrolysis by actomyosin. Biochemistry. 1971;10:4617–4624. doi: 10.1021/bi00801a004. [DOI] [PubMed] [Google Scholar]
- Mansson A. Significant impact on muscle mechanics of small nonlinearities in myofilament elasticity. Biophys J. 2010;99:1869–1875. doi: 10.1016/j.bpj.2010.07.029. [DOI] [PMC free article] [PubMed] [Google Scholar]
- Mobley BA, Eisenberg BR. Sizes of components in frog skeletal muscle measured by methods of stereology. J Gen Physiol. 1975;66:31–45. doi: 10.1085/jgp.66.1.31. [DOI] [PMC free article] [PubMed] [Google Scholar]
- Molloy JE, Burns JE, Kendrick-Jones J, Tregear RT, White DC. Movement and force produced by a single myosin head. Nature. 1995;378:209–212. doi: 10.1038/378209a0. [DOI] [PubMed] [Google Scholar]
- Oshima K, Takezawa Y, Sugimoto Y, Kobayashi T, Irving TC, Wakabayashi K. Axial dispositions and conformations of myosin crossbridges along thick filaments in relaxed and contracting states of vertebrate striated muscles by X-ray fibre diffraction. J Mol Biol. 2007;367:275–301. doi: 10.1016/j.jmb.2006.12.036. [DOI] [PubMed] [Google Scholar]
- Park-Holohan S, Linari M, Reconditi M, Fusi L, Brunello E, Irving M, Dolfi M, Lombardi V, West TG, Curtin NA, Woledge RC, Piazzesi G. Mechanics of myosin function in white muscle fibres of the dogfish, Scyliorhinus canicula. J Physiol. 2012;590:1973–1988. doi: 10.1113/jphysiol.2011.217133. [DOI] [PMC free article] [PubMed] [Google Scholar]
- Pate E, Cooke R. Energetics of the actomyosin bond in the filament array of muscle fibers. Biophys J. 1988;53:561–573. doi: 10.1016/S0006-3495(88)83136-9. [DOI] [PMC free article] [PubMed] [Google Scholar]
- Piazzesi G, Dolfi M, Brunello E, Fusi L, Reconditi M, Bianco P, Linari M, Lombardi V. The myofilament elasticity and its effect on kinetics of force generation by the myosin motor. Arch Biochem Biophys. 2014;552:108–116. doi: 10.1016/j.abb.2014.02.017. [DOI] [PubMed] [Google Scholar]
- Piazzesi G, Lucii L, Lombardi V. The size and the speed of the working stroke of muscle myosin and its dependence on the force. J Physiol. 2002a;545:145–151. doi: 10.1113/jphysiol.2002.028969. [DOI] [PMC free article] [PubMed] [Google Scholar]
- Piazzesi G, Reconditi M, Koubassova N, Decostre V, Linari M, Lucii L, Lombardi V. Temperature dependence of the force-generating process in single fibres from frog skeletal muscle. J Physiol. 2003;549:93–106. doi: 10.1113/jphysiol.2002.038703. [DOI] [PMC free article] [PubMed] [Google Scholar]
- Piazzesi G, Reconditi M, Linari M, Lucii L, Bianco P, Brunello E, Decostre V, Stewart A, Gore DB, Irving TC, Irving M, Lombardi V. Skeletal muscle performance determined by modulation of number of myosin motors rather than motor force or stroke size. Cell. 2007;131:784–795. doi: 10.1016/j.cell.2007.09.045. [DOI] [PubMed] [Google Scholar]
- Piazzesi G, Reconditi M, Linari M, Lucii L, Sun YB, Narayanan T, Boesecke P, Lombardi V, Irving M. Mechanism of force generation by myosin heads in skeletal muscle. Nature. 2002b;415:659–662. doi: 10.1038/415659a. [DOI] [PubMed] [Google Scholar]
- Rayment I, Holden HM, Whittaker M, Yohn CB, Lorenz M, Holmes KC, Milligan RA. Structure of the actin–myosin complex and its implications for muscle contraction. Science. 1993a;261:58–65. doi: 10.1126/science.8316858. [DOI] [PubMed] [Google Scholar]
- Rayment I, Rypniewski WR, Schmidt-Base K, Smith R, Tomchick DR, Benning MM, Winkelmann DA, Wesenberg G, Holden HM. Three-dimensional structure of myosin subfragment-1: a molecular motor. Science. 1993b;261:50–58. doi: 10.1126/science.8316857. [DOI] [PubMed] [Google Scholar]
- Reconditi M. There is no experimental evidence for non-linear myofilament elasticity in skeletal muscle. J Exp Biol. 2010;213:658–659. doi: 10.1242/jeb.038067. author reply 659. [DOI] [PubMed] [Google Scholar]
- Reconditi M, Brunello E, Fusi L, Linari M, Martinez MF, Lombardi V, Irving M, Piazzesi G. Sarcomere-length dependence of myosin filament structure in skeletal muscle fibres of the frog. J Physiol. 2014;592:1119–1137. doi: 10.1113/jphysiol.2013.267849. [DOI] [PMC free article] [PubMed] [Google Scholar]
- Reconditi M, Brunello E, Linari M, Bianco P, Narayanan T, Panine P, Piazzesi G, Lombardi V, Irving M. Motion of myosin head domains during activation and force development in skeletal muscle. Proc Natl Acad Sci U S A. 2011;108:7236–7240. doi: 10.1073/pnas.1018330108. [DOI] [PMC free article] [PubMed] [Google Scholar]
- Reconditi M, Koubassova N, Linari M, Dobbie I, Narayanan T, Diat O, Piazzesi G, Lombardi V, Irving M. The conformation of myosin head domains in rigor muscle determined by X-ray interference. Biophys J. 2003;85:1098–1110. doi: 10.1016/S0006-3495(03)74547-0. [DOI] [PMC free article] [PubMed] [Google Scholar]
- Reconditi M, Linari M, Lucii L, Stewart A, Sun YB, Boesecke P, Narayanan T, Fischetti RF, Irving T, Piazzesi G, Irving M, Lombardi V. The myosin motor in muscle generates a smaller and slower working stroke at higher load. Nature. 2004;428:578–581. doi: 10.1038/nature02380. [DOI] [PubMed] [Google Scholar]
- Seebohm B, Matinmehr F, Kohler J, Francino A, Navarro-Lopez F, Perrot A, Ozcelik C, McKenna WJ, Brenner B, Kraft T. Cardiomyopathy mutations reveal variable region of myosin converter as major element of cross-bridge compliance. Biophys J. 2009;97:806–824. doi: 10.1016/j.bpj.2009.05.023. [DOI] [PMC free article] [PubMed] [Google Scholar]
- Sztucki M, Di Cola E, Narayanan T. Instrumental developments for anomalous small-angle X-ray scattering from soft matter systems. J Appl Crystallogr. 2010;43:1479–1487. [Google Scholar]
- Takagi Y, Homsher EE, Goldman YE, Shuman H. Force generation in single conventional actomyosin complexes under high dynamic load. Biophys J. 2006;90:1295–1307. doi: 10.1529/biophysj.105.068429. [DOI] [PMC free article] [PubMed] [Google Scholar]
- Tsaturyan AK, Koubassova N, Ferenczi MA, Narayanan T, Roessle M, Bershitsky SY. Strong binding of myosin heads stretches and twists the actin helix. Biophys J. 2005;88:1902–1910. doi: 10.1529/biophysj.104.050047. [DOI] [PMC free article] [PubMed] [Google Scholar]
- Tyska MJ, Dupuis DE, Guilford WH, Patlak JB, Waller GS, Trybus KM, Warshaw DM, Lowey S. Two heads of myosin are better than one for generating force and motion. Proc Natl Acad Sci U S A. 1999;96:4402–4407. doi: 10.1073/pnas.96.8.4402. [DOI] [PMC free article] [PubMed] [Google Scholar]
- Wakabayashi K, Sugimoto Y, Tanaka H, Ueno Y, Takezawa Y, Amemiya Y. X-ray diffraction evidence for the extensibility of actin and myosin filaments during muscle contraction. Biophys J. 1994;67:2422–2435. doi: 10.1016/S0006-3495(94)80729-5. [DOI] [PMC free article] [PubMed] [Google Scholar]
- Woledge RC, Curtin NA, Homsher E. Energetic Aspects of Muscle Contraction. London: Academic Press; 1985. [PubMed] [Google Scholar]