Abstract
Few medical issues have been as controversial—or as political, at least in the United States—as the role of mammographic screening for breast cancer. The advantages of finding a cancer early seem obvious. Indeed, randomized trials evaluating screening mammography demonstrate a reduction in breast cancer mortality, but the benefits are less than one would hope. Moreover, the randomized trials are themselves subject to criticism, including that they are irrelevant in the modern era because most were conducted before chemotherapy and hormonal therapy became widely used. In this article I chronicle the evidence and controversies regarding mammographic screening, including attempts to assess the relative contributions of screening and therapy in the substantial decreases in breast cancer mortality that have been observed in many countries over the last 20 to 25 years. I emphasize the trade-off between harms and benefits depending on the woman’s age and other risk factors. I also discuss ways for communicating the associated risks to women who have to decide whether screening (and what screening strategy) is right for them.
Keywords: Breast cancer detection, Screening mammography, Biases in screening studies, Randomized screening trials, Modeling population breast cancer mortality
Introduction
Few medical questions have been as controversial—or as political, at least in the United States—as the role of mammographic screening for breast cancer. Even breast cancer advocacy groups are at loggerheads. Some arguments on both sides of the question have been more vitriolic than enlightened. An extreme example is a Harvard professor’s argumentum ad hominem criticism of the U.S. Preventive Services Task Force as cited in the Washington Post: "Tens of thousands of lives are being saved by mammography screening, and these idiots want to do away with it.” “It's crazy— unethical, really." [1] A recent monograph from the opposite perspective is titled Mammography Screening: Truth, Lies and Controversy.[2]
To many people the benefit of finding a cancer early seems so obvious as to defy the need for the empirical confirmation. Some researchers attempt empirical confirmation by conducting observational studies comparing survival of patients whose cancers were detected by screening versus not. Such analyses are easy to make, whether within or across programs or databases. And they show substantial benefits for screening. But they are fatally flawed. Hundreds if not thousands of such observational studies have been published. These studies are worthless, individually and in total. But believers tout them as evidence.
The principal fatal flaws in these studies are lead-time and length biases.[3] Lead-time bias should be easy to recognize and to understand. Suppose a screening mammogram detects a tumor in a 50-year-old woman. Had she not been screened the tumor might have become symptomatic at age 55, say. The lead time due to screening is 5 years. She would have lived for 5 years longer with her cancer had she been screened, even with no screening benefit.
Length bias is more subtle than lead-time bias, but its impact is even greater. Breast tumors are heterogeneous. Some grow fast and others are indolent. The ones that grow fast have a short sojourn time, the period between when it is detectable by mammography but is not yet symptomatic. On the other hand, indolent tumors by definition have long sojourn times. Mammography preferentially detects indolent tumors simply because they are detectable for a longer period. Length bias results because indolent tumors are less likely to recur and they are less likely to be lethal.
Overdiagnosis is an extreme form of length bias, a subject I return to below. Some tumors grow so slowly that they would never be found during the woman’s lifetime were it not for screening.
The resolution of lead-time and length biases in comparing cancer survival is to identify and start following individuals before they have cancer rather than considering individuals after their cancers have been detected. Ideally, patient assignment to be screened or not should be randomized.
Role of Women’s Age in the Randomized Trials
There have been 10 randomized breast screening trials (although the count depends on which trials are regarded as distinct).[4]. The earliest trial was the Health Insurance Plan (HIP) of New York, initiated in 196x.[5] None of the trials is immune to criticism,[6] including that they are not relevant for the modern era of chemotherapy and hormonal therapy. The HIP trial and the Edinburgh trial[7] are sufficiently flawed that I shall not consider them further.
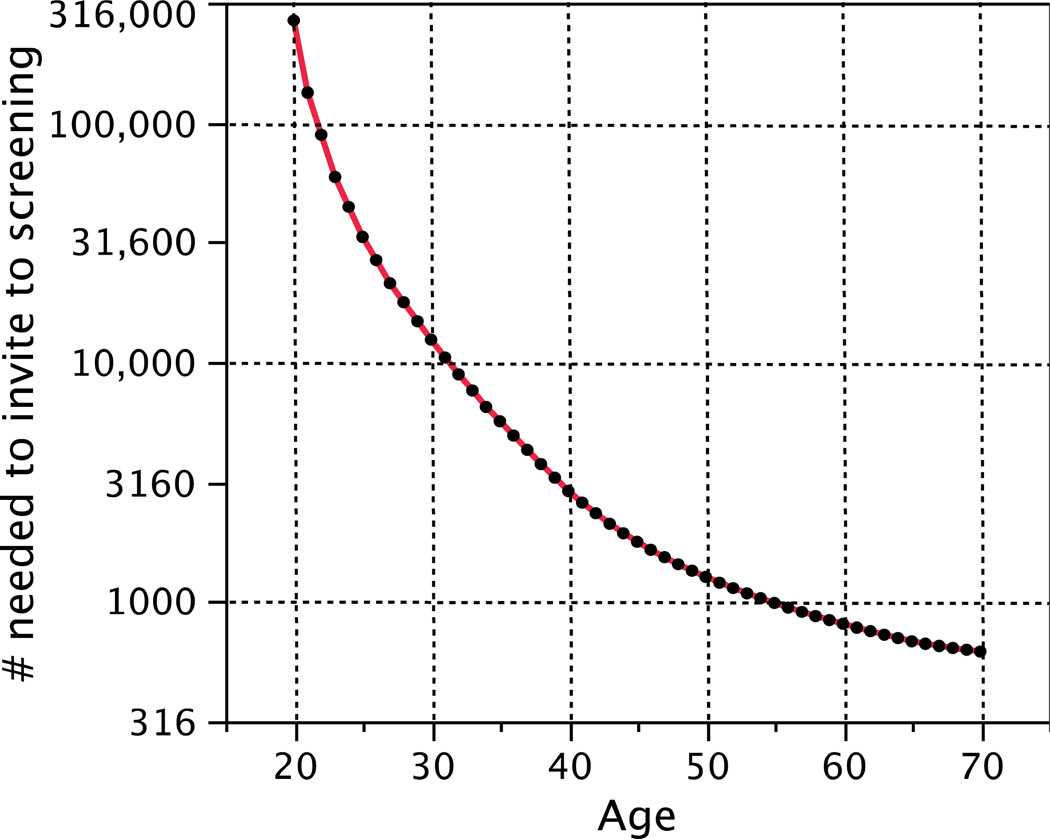
A principal focus of the analyses of the randomized trials has been the age to start screening. The 2009 U.S. Preventive Services Task Force (USPSTF) publication concluded that the “’number needed to invite for screening to extend one woman’s life’ [is] 1904 for women aged 40 to 49 years and 1339 for women aged 50 to 59 years.”[4] There is no abrupt change at age 50 in either incidence or lethality of the disease. So these numbers are not constant over their respective intervals. In Figure 1 I have interpolated within age intervals and extrapolated outside them assuming only breast cancer incidence matters and based on incidence statistics from the U.S. (This figure does not show estimation uncertainty, which is substantial; see below.)
Figure 1.
Number needed to invite to screening to save one life as reported by the USPSTF, but with my interpolations and extrapolations based on U.S. breast cancer incidence statistics. In particular, the USPSTF estimated the number needed to invite for screening to avoid on death over a 20-year period is 1904, 1339, and 377 for women ages 39 to 49, ages 50 to 59, and 60 to 74, respectively. The smooth curve in the plot has these averages over the intervals in question.
One USPSTF conclusion was that “Screening mammography should not be done routinely for all women age 40 to 49 years.” This conclusion was highly controversial in the U.S. Curiously, the basis of the controversy was never the evidence used but the fact that the task force decided on the cutpoint at age 50. The USPSTF conclusion was essentially the same as that of an NIH Consensus Development Conference,[8] largely because the randomized evidence had changed little over the intervening years.
No organization of any repute recommends screening women younger than age 40 at normal risk of breast cancer (although the American Cancer Society once promoted having a “baseline mammogram” at age 35). The USPSTF chose the cutpoint age of 50 by weighing harms and benefits. They conclude that “Women and their doctors should base the decision to start mammography before age 50 years on the risk for breast cancer and preferences about the benefits and harms.”[4]
The largest and most important set of randomized trials is from Sweden. These trials were updated most recently in 2002.[9] The Swedish trials utilized a mammogram in the control group. The control mammogram was to occur at the time of the final mammogram in the group invited to screening. The “evaluation model” compares breast cancer mortality based on those cancers detected up until the time of and including at the last mammogram. Unfortunately, the timing of the “last mammogram” slipped, by as much as 14 months.[10] Therefore, Nystrom also provides a “follow-up model,” which is not subject to this “evaluation bias.” The follow-up model compares all breast cancer deaths in both groups, with follow-up truncated in all trials and groups at the same calendar date. The results of this follow-up model are shown in Table 1.
Table 1.
| Country | Age at entry |
Women years (1000s) |
Number of deaths |
RR | RR 95% CI |
Deaths avoided/ 1000 yrs |
||
|---|---|---|---|---|---|---|---|---|
| IG | CG | IG | CG | |||||
| 40–44 | 320 | 281 | 85 | 88 | 0.85 | 0.64–1.13 | 0.048 | |
| 45–49 | 377 | 338 | 135 | 128 | 0.95 | 0.75–1.21 | 0.021 | |
| 50–54 | 341 | 320 | 144 | 146 | 0.92 | 0.73–1.16 | 0.034 | |
| Sweden[8] | 55–59 | 368 | 357 | 177 | 201 | 0.86 | 0.70–1.05 | 0.082 |
| 60–64 | 260 | 201 | 128 | 129 | 0.79 | 0.62–1.01 | 0.149 | |
| 65–69 | 137 | 131 | 84 | 119 | 0.68 | 0.52–0.89 | 0.295 | |
| 70–74 | 62 | 59 | 42 | 36 | 1.12 | 0.73–1.72 | −0.067 | |
| Canada[10] | 40–49 | 328* | 328* | 105 | 108 | 0.97 | 0.74–1.27 | 0.009 |
| Canada[11] | 50–59 | 216 | 216 | 107 | 105 | 1.02 | 0.78–1.33 | −0.009 |
| U.K.[12] | 40 | 578 | 1149 | 105 | 251 | 0.83 | 0.66–1.04 | 0.037 |
Table 1 also shows the results of the Canadian NBSS trials,[11,12] and the U.K. trial.[13]
The rightmost column in Table 1 is the difference between the number of deaths per 1000 women years in control minus the corresponding number in the screened group. The number needed to screen to avoid one death per 1000 woman years is the inverse of the table entry, discussed further below.
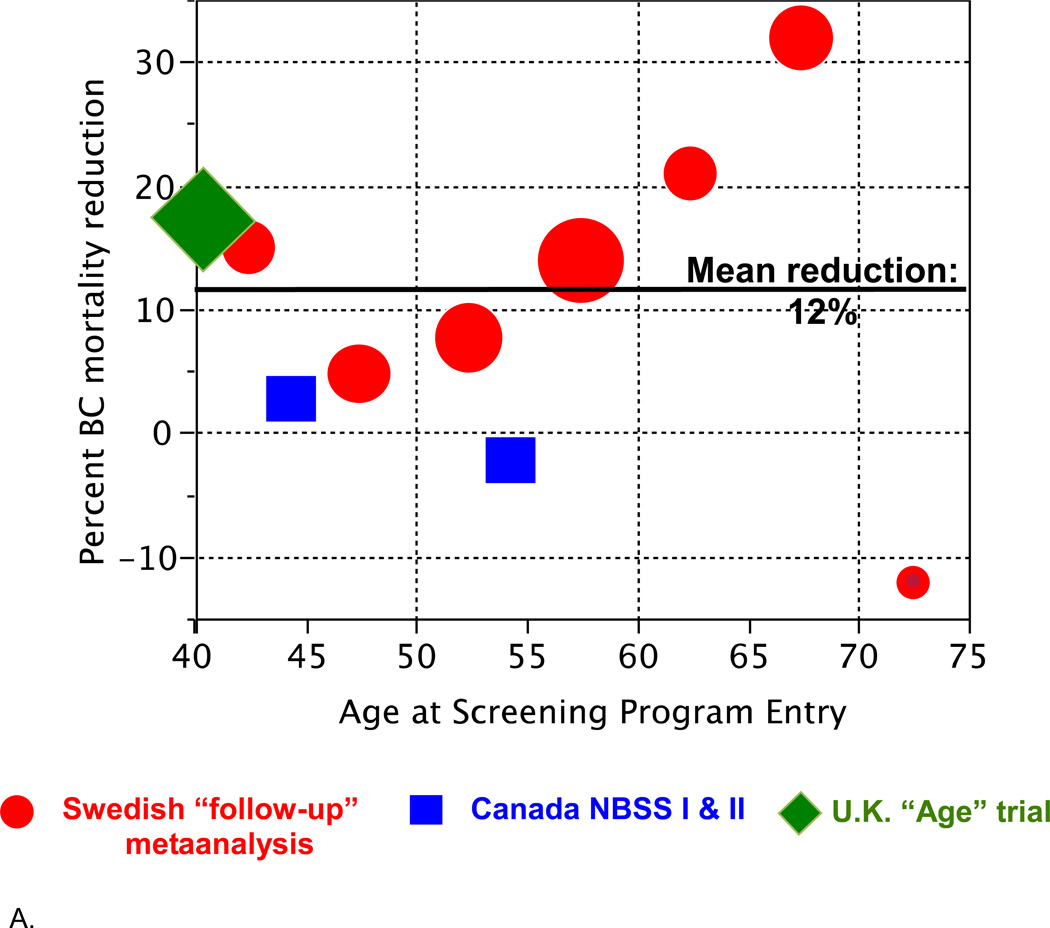
Figure 2 shows the results from Table 1 in graphical form. Figure 2A shows reduction in breast cancer mortality as it depends on age at entry into a screening program. There is a suggestion of an age effect, especially in the Swedish trials.
Figure 2.
A. Reduction in breast cancer mortality from Table 1 as it depends on age at entry into a screening program, plotted by age groups (5- or 10-year intervals). The areas of the symbols are proportional to the numbers of deaths in the corresponding control group.
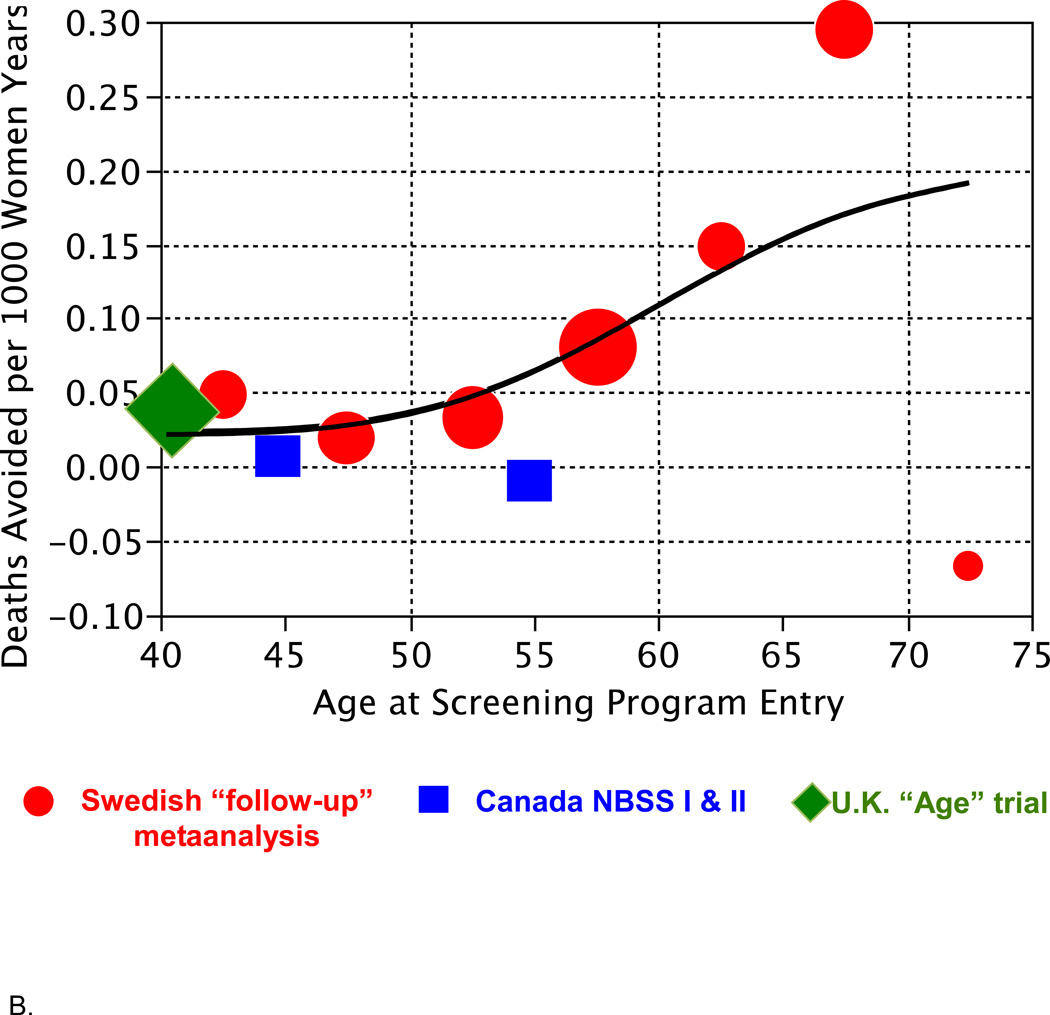
B. Deaths avoided per 1000 women years depending on age (rightmost column in Table 1). The smooth curve shown is a spline fitted to these data. The fitted values at ages 45, 55, and 65 are 0.026, 0.064, and 0.156, respectively.
Figure 2B shows the number of deaths avoided per 1000 women years. There are several important aspects of this plot and the fitted spline. One is the similarity of the results across countries within age groups. In particular, despite arguments regarding the anomalous nature of the Canadian trials,[14] the results in the Canadian and Swedish trials (when using the follow-up model) are quite comparable. Another important aspect of Figure 2B is the continuity of the results as a function of age. Still another is the small estimated benefit for women in their 40s and even into their 50s.
In calculating the number needed to invite to screening to avoid one death, the USPSTF referred to a 20-year period. Assuming a risk reduction for screening that is constant over time and persisting over a 20-year period, the analogous number is the inverse of the number indicated in Figure 2B times 50 (the number of 20-year periods in 1000 women years). Using the spline estimates at ages 45, 55, and 65, these are approximately 1900, 800, and 300, respectively. For comparison, the USPSTF calculations (cf. Figure 1) for women younger than 50 was 1904 (95% CI, 929 to 6378), for women in their 50s it was 1339 (CI, 322 to 7455), and for women 60 and older it was 377 (CI, 230 to 1050). The results of the two approaches are very similar, with the discrepancy between the two calculations for women in their 50s being due to fitting the trial results as a function of age in Figure 2B—in effect, partially interpolating between the younger and older age groups—whereas the USPSTF calculation regarded women in their 50s to be an entity separate from other women.
Role of Modeling in Assessing Screening Effects
Recognizing the limitations of the randomized trials in evaluating the effects of screening on cancer mortality, in 2000 the U.S. National Cancer Institute established a consortium called the Cancer Intervention and Surveillance Modeling Network (CISNET).[15] The original breast cancer CISNET included seven modeling groups.[16] The goal was to assess the contribution of the various possible interventions in explaining the drop of breast cancer mortality that occurred in the U.S. between 1990 and 2000. These interventions included adjuvant tamoxifen and polychemotherapy as well as screening mammography. Information used in the models included patterns of use of these interventions and the evidence from clinical trials concerning the benefits of treatment.
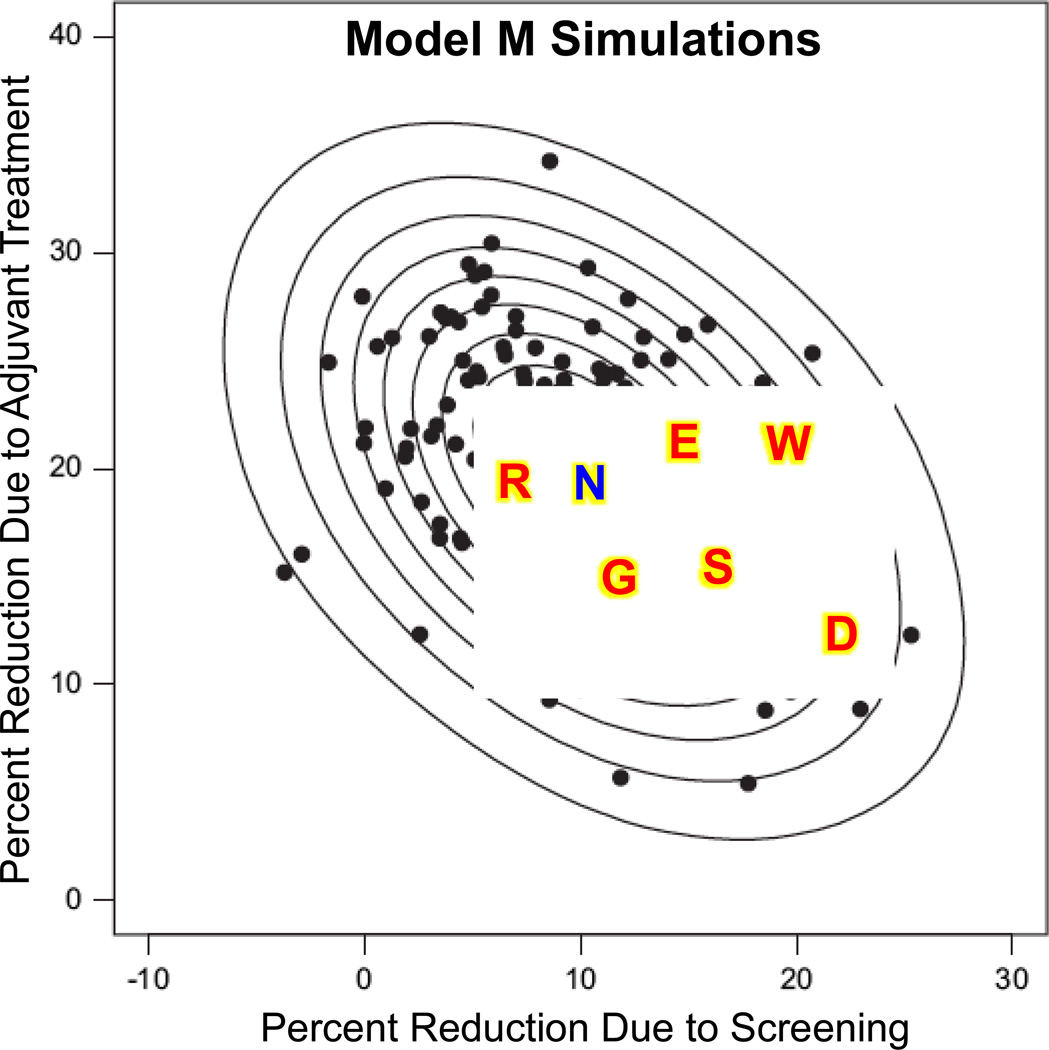
One of the models that was funded by the NCI was Model M.[17,18] This was a Bayesian model that used simulations to produce joint posterior distributions of the effects of the various interventions. Figure 3 shows a sample from the posterior distribution of the contributions to the reduction in breast cancer mortality due to adjuvant therapy (tamoxifen plus polychemotherapy) and screening. The ellipses are contours of the distribution. Also shown on this plot are the estimates of the seven models from Figure 3 of Berry et al.[16] The best estimate from Model M is of course at the center of the posterior distribution derived using Model M. The best Model M estimate is 10 percent reduction due to screening and 20 percent due to treatment, although there is substantial uncertainty as indicated by the full posterior distribution.
Figure 3.
Each of the black dots is the result of a simulation of CISNET Model M. the format of the figure is similar to that of Figure 3 in Berry et al.[Berry]. The earlier figure was based symmetrically on the seven models while the present figure is based on many simulated models produced by Model M. All seven CISNET model estimates are shown here using the same symbols as in the earlier figure. The uncertainty present in Model M, which is reflected in these simulations, actually encompasses the other six models. The blue symbol “N” is described in the text.
There is an evident negative correlation between the two factors in the posterior distribution shown in Figure 3. This reflects the fact that there was about a 30 percent reduction in comparison with what breast cancer mortality would have been in the absence of both screening and adjuvant therapy. This reduction could have been achieved by either treatment or screening, and hence the negative correlation. The substantial uncertainty present in the distribution is an indication that the data available to the models was not sufficient to completely settle the question.
The other six model estimates are contained within the posterior distribution of Model M. So the variability across the models was actually comparable to the variability within the simulations of Model M.
The symbol “N” in Figure 3 stands for Norway and refers to one of the few studies that attempted to separate the benefits of treatment from those of screening. Using a Norwegian registry, Kalager et al.[18] estimated a 10 percent reduction due to screening and a 20 percent reduction due to treatment.
The CISNET models were used by the USPSTF in their 2009 recommendations.[19] The models were used to address the benefits of biennial versus annual screening and concluded that little was lost using the former. They also confirmed what is at best a modest reduction in breast cancer mortality for women in their 40s, at the expense of a high rate of false positives. And they affirmed that the qualitative benefits of screening in the randomized trials held even in the modern era of adjuvant therapy.
Overdiagnosis
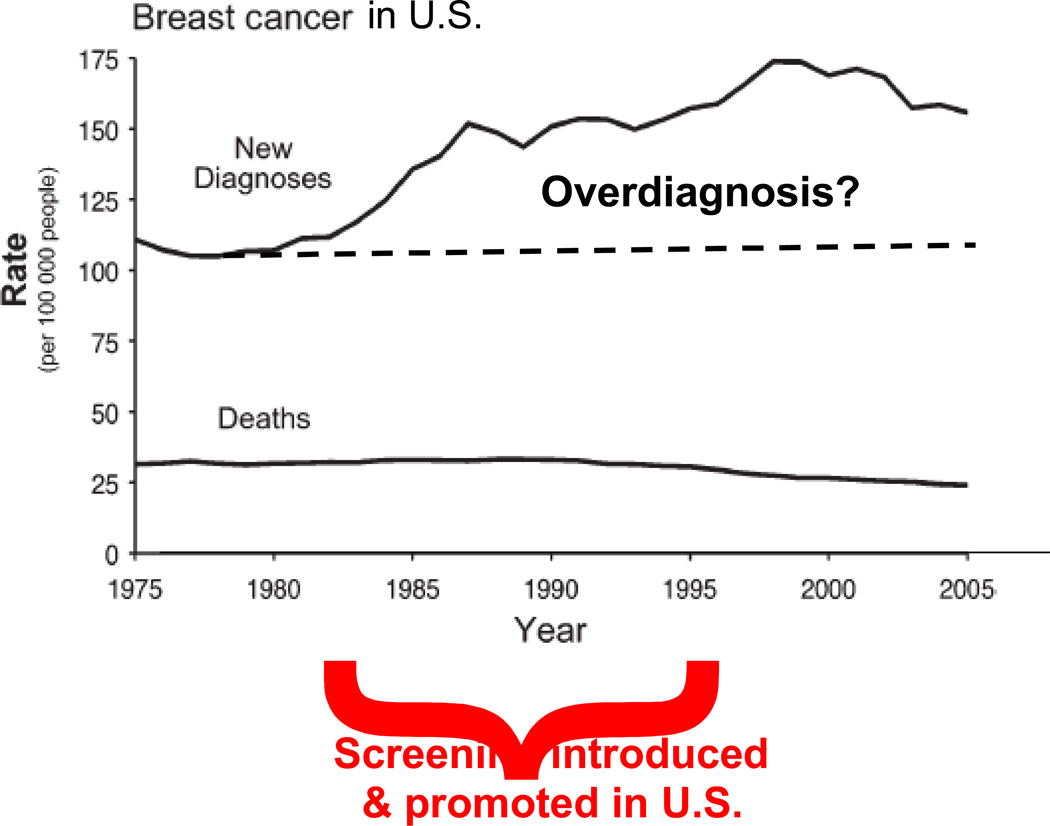
As I have indicated above, a principal controversy in mammographic screening is the trade-off between the benefits and harms. Most harms—including false positives—are well understood and are relatively easy to quantify. One important harm that is the focus of much current research and is difficult to quantify is overdiagnosis. Most researchers agree that some screen-detected cancers are overdiagnosed, but estimates range from 0 to 50%. For example, Figure 4 shows an increase in breast cancer incidence in the U.S. that is mostly due to the introduction of screening mammography. Breast cancer mortality over the same period is less. Some of the increase is presumably overdiagnosis, but drawing a credible quantitative conclusion is not easy. One study used the randomized trials to estimate that the magnitude of overdiagnosis resulting from mammography is about 25%.[20]
Figure 4.
The increase is breast cancer incidence in the U.S. was largely a consequence of screening mammography. Some of this increase is overdiagnosis, but quantifying the amount overdiagnosis is fraught with difficulty.
Acknowledgments
Conflict of interest statement: Partially funded by the National Cancer Institute under grant 1U01CA152958-01. Don Berry has worked for Berry Consultants LLC.
Footnotes
Publisher's Disclaimer: This is a PDF file of an unedited manuscript that has been accepted for publication. As a service to our customers we are providing this early version of the manuscript. The manuscript will undergo copyediting, typesetting, and review of the resulting proof before it is published in its final citable form. Please note that during the production process errors may be discovered which could affect the content, and all legal disclaimers that apply to the journal pertain.
References
- 1.<http://articles.washingtonpost.com/2009-11-17/news/36877178_1_annual-mammograms-biopsies-and-unneeded-treatment-routine-mammograms>[“Breast exam guidelines now call for less testing.” By Rob Stein, November 17, 2009]
- 2.Gotzsche PC. Mammography Screening: Truth, Lies and Controversy. London: Radcliffe Publishing; 2012. [DOI] [PubMed] [Google Scholar]
- 3.Berry DA. The screening mammography paradox: Better when found, perhaps better not to find. British Journal of Cancer. 2008;98:1729–1730. doi: 10.1038/sj.bjc.6604349. [DOI] [PMC free article] [PubMed] [Google Scholar]
- 4.U.S. Preventive Services Task Force. Screening for breast cancer: U.S. Preventive Services Task Force recommendation statement. Annals of Internal Medicine. 2009;151:716–726. doi: 10.7326/0003-4819-151-10-200911170-00008. [DOI] [PubMed] [Google Scholar]
- 5.Shapiro S, Venet W, Strax P, Venet L. Periodic Screening for Breast Cancer: The Health Insurance Plan Project and Its Sequelae, 1963–1986. Baltimore: Johns Hopkins University Press; 1988. [Google Scholar]
- 6.Götzsche PC, Olsen O. Is screening for breast cancer with mammography justifiable? Lancet. 2000;355:129–134. doi: 10.1016/S0140-6736(99)06065-1. [DOI] [PubMed] [Google Scholar]
- 7.Roberts MM, Alexander FE, Anderson TJ, et al. Edinburgh trial of screening for breast cancer: mortality at seven years. Lancet. 1990;335(8684):241–246. doi: 10.1016/0140-6736(90)90066-e. [DOI] [PubMed] [Google Scholar]
- 8.Gordis L, Berry DA, Chu SY, Fajardo LL, Hoel DG, Laufman LR, Rufenbarger CA, Scott JR, Sullivan DC, Wasson JH, Westhoff CL, Zern RT. Breast cancer screening for women ages 40–49. Journal of the National Cancer Institute. 1997;89:1015–1026. doi: 10.1093/jnci/89.14.1015. (Reprinted in Monograph of the Journal of the National Cancer Institute (1997) 22:viixii.)] [DOI] [PubMed] [Google Scholar]
- 9.Nyström L, Andersson I, Bjurstam N, Frisell J, Nordenskjöld B, Rutqvist LE. Long-term effects of mammography screening: updated overview of the Swedish randomised trials [published erratum appears in Lancet 2002;360: 724. The Lancet. 2002;359(9310):909–919. doi: 10.1016/S0140-6736(02)08020-0. [DOI] [PubMed] [Google Scholar]
- 10.Berry DA. Benefits and risks of screening mammography for women in their forties: a statistical appraisal. Journal of the National Cancer Institute. 1998;90:1431–1439. doi: 10.1093/jnci/90.19.1431. [DOI] [PubMed] [Google Scholar]
- 11.Miller AB, To T, Baines CJ, Wall C. The Canadian National Breast Screening Study-1: breast cancer mortality after 11 to 16 years of follow-up. A randomized screening trial of mammography in women age 40 to 49 years. Ann Intern Med. 2002;137(5 Part 1):305–312. doi: 10.7326/0003-4819-137-5_part_1-200209030-00005. [DOI] [PubMed] [Google Scholar]
- 12.Miller AB, To T, Baines CJ, Wall C. Canadian National Breast Screening Study-2: 13-year results of a randomized trial in women aged 50–59 years. J Natl Cancer Inst. 2000;92:1490–1499. doi: 10.1093/jnci/92.18.1490. [DOI] [PubMed] [Google Scholar]
- 13.Moss SM, Cuckle H, Evans A, Johns L, Waller M, Bobrow L. Effect of mammographic screening from age 40 years on breast cancer mortality at 10 years’ follow-up: a randomised controlled trial. Lancet. 2006;368:2053–2060. doi: 10.1016/S0140-6736(06)69834-6. [DOI] [PubMed] [Google Scholar]
- 14.Kopans DB, Halpern E. Re: Benefits and Risks of Screening Mammography for Women in Their Forties: a Statistical Appraisal. J Natl Cancer Inst. 1999;91(4):382–384. doi: 10.1093/jnci/91.4.382. [DOI] [PubMed] [Google Scholar]
- 15. [Accessed 2 April 2013]; < http://cisnet.cancer.gov>.
- 16.Berry DA, Cronin KA, Plevritis SK, Fryback DG, Clarke L, Zelen M, Mandelblatt JS, Yakovlev AY, Habbema JDF, Feuer EJ for the Cancer Intervention and Surveillance Modeling Network (CISNET) Effect of screening and adjuvant therapy on mortality from breast cancer. New England Journal of Medicine. 2005;353:1784–1792. doi: 10.1056/NEJMoa050518. [DOI] [PubMed] [Google Scholar]
- 17.Berry DA, Inoue L, Shen Y, Venier J, Cohen D, Bondy M, Theriault R, Munsell MF. Modeling the Impact of Treatment and Screening on Breast Cancer Mortality: A Bayesian Approach. Monograph of the Journal of the National Cancer Institute. 2006:30–36. doi: 10.1093/jncimonographs/lgj006. Number 36. [DOI] [PubMed] [Google Scholar]
- 18.Kalager M, Zelen M, Langmark F, Adami H-O. Effect of Screening Mammography on Breast-Cancer Mortality in Norway. N Engl J Med. 2010;363:1203–1210. doi: 10.1056/NEJMoa1000727. [DOI] [PubMed] [Google Scholar]
- 19.Mandelblatt JS, Cronin KA, Bailey S, Berry DA, de Koning HJ, Draisma G, Huang H, Lee SJ, Munsell M, Plevritis SK, Ravdin P, Schechter CB, Sigal B, Stoto MA, Stout NK, van Ravesteyn NT, Venier J, Zelen M, Feuer EJ for the Breast Cancer Working Group of the Cancer Intervention and Surveillance Modeling Network (CISNET) Effects of mammographic screening under different screening schedules: Model estimates of potential benefits and harms. Annals of Internal Medicine. 2009;151:738–747. doi: 10.1059/0003-4819-151-10-200911170-00010. [DOI] [PMC free article] [PubMed] [Google Scholar]
- 20.Welch HG, Black WC. Overdiagnosis in cancer. J Natl Cancer Inst. 2010;102(9):605–613. doi: 10.1093/jnci/djq099. [DOI] [PubMed] [Google Scholar]


