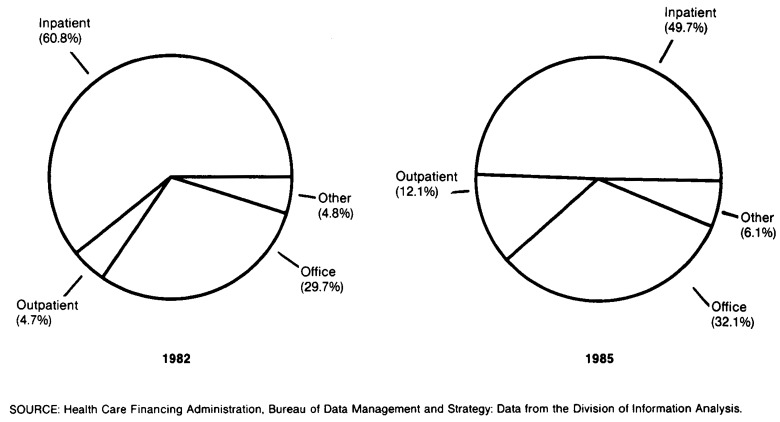
The onset of the prospective payment system (PPS) has profoundly changed the structure of physician charges under Medicare. The proportion of allowed physician charges originating in an inpatient hospital setting was drastically reduced. In 1982, more than three-fifths of physician charges were related to inpatient services. By 1985, less than one-half derived from inpatient care (Figure 1). The decrease in the inpatient share of physician charges was mostly offset by increases in shares for physician services in outpatient hospitals. Two-thirds of the loss in physicians inpatient shares was shifted to outpatient hospital settings and one-third to physician office and other settings (Figure 1). Two major changes resulting from PPS appear to account for these changes in shares:
Figure 1. Distribution of Medicare allowed physician charges, by place of service: 1982 and 1985.
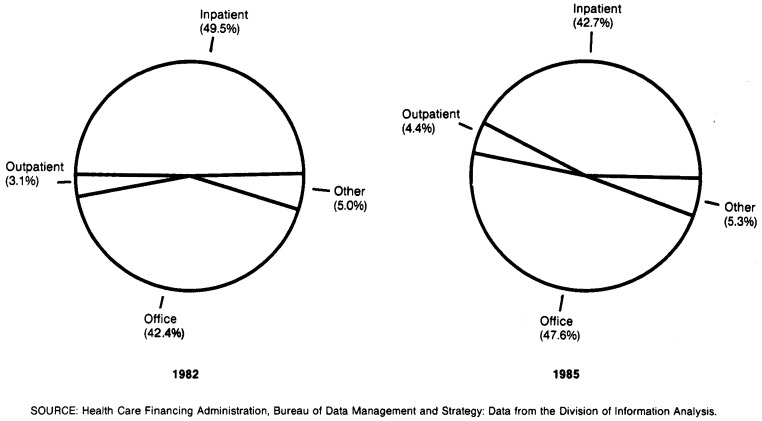
Sharp reductions in hospital lengths of stay and admission rates reduced the number of inpatient hospital days that provide opportunities for medical services, mainly hospital visits (Figure 2).
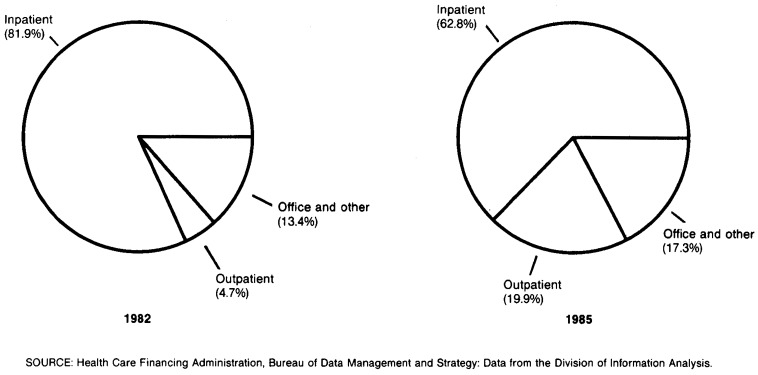
Surgical services shifted from inpatient settings to other settings, particularly in 1985. Thus, the proportion of physician allowed charges deriving from inpatient surgery was reduced (Figure 3).
Figure 2. Distribution of Medicare allowed physician medical service charges, by place of service: 1982 and 1985.
Figure 3. Distribution of Medicare allowed physician surgical charges, by place of service: 1982 and 1985.
Distributions of allowed charges by type and place of service (Table 1) do not necessarily reflect the corresponding distribution of Medicare Supplementary Medical Insurance (SMI) Trust Fund payments by type and place of service because patient liabilities for SMI deductibles are usually incurred during initial contacts with physicians in a calendar year. Thus, the proportion of charges for physician office services paid from the SMI Trust Fund is smaller than the proportion of charges for physician inpatient services paid from the SMI Trust Fund. The estimated rate of increase in physician allowed charges steadily diminished from 1982 to 1985 (Table 2).
Table 1. Percent distribution of Medicare physician allowed charges, by type and place of service: Calendar years 1982-851.
| Place of service | Type of service | |||||
|---|---|---|---|---|---|---|
|
| ||||||
| Total | Medical | Surgical | Diagnostic X-ray | Clinical lab | Other2 | |
| 1982 | ||||||
| Total | 100.0 | 38.9 | 32.7 | 8.0 | 9.3 | 11.1 |
| Office | 29.7 | 16.5 | 4.1 | 3.2 | 4.8 | 1.1 |
| Inpatient hospital | 60.8 | 19.3 | 26.8 | 3.5 | 2.1 | 9.1 |
| Outpatient hospital | 4.7 | 1.2 | 1.6 | 1.0 | .3 | .6 |
| Other3 | 4.8 | 1.9 | .2 | .3 | 2.1 | .3 |
| 1983 | ||||||
| Total | 100.0 | 37.6 | 33.2 | 8.5 | 9.6 | 11.1 |
| Office | 29.7 | 16.0 | 4.3 | 3.3 | 4.9 | 1.2 |
| Inpatient hospital | 60.0 | 18.5 | 26.5 | 3.8 | 2.2 | 9.0 |
| Outpatient hospital | 5.4 | 1.2 | 2.2 | 1.2 | .3 | .5 |
| Other3 | 4.9 | 1.9 | .2 | .2 | 2.2 | .4 |
| 1984 | ||||||
| Total | 100.0 | 36.2 | 33.7 | 8.8 | 10.0 | 11.3 |
| Office | 29.9 | 15.9 | 4.6 | 3.3 | 4.9 | 1.2 |
| Inpatient hospital | 56.5 | 16.9 | 25.0 | 3.8 | 2.2 | 8.6 |
| Outpatient hospital | 8.3 | 1.5 | 3.8 | 1.4 | .5 | 1.1 |
| Other3 | 5.3 | 1.9 | .3 | .3 | 2.4 | .4 |
| 1985 | ||||||
| Total | 100.0 | 34.9 | 34.1 | 9.4 | 10.6 | 11.0 |
| Office | 32.1 | 16.6 | 5.5 | 3.8 | 4.8 | 1.4 |
| Inpatient hospital | 49.7 | 14.9 | 21.5 | 3.6 | 2.0 | 7.7 |
| Outpatient hospital | 12.1 | 1.5 | 6.8 | 1.6 | .6 | 1.6 |
| Other3 | 6.1 | 1.9 | .3 | .4 | 3.2 | .3 |
Excludes charges for ambulance, durable medical equipment, purchases and rentals, and supplies. Includes charges for independent laboratory services.
Includes consultation, assistance at surgery, anesthesiology, radiology, and other types of service.
Includes home, nursing home, and other places of service.
Table 2. Amount of Medicare physician allowed charges and percent change: 1982-85.
| Calendar year | Amount of allowed charges in billions | Percent change |
|---|---|---|
| 1982 | $15.0 | — |
| 1983 | 17.4 | 11.6 |
| 1984 | 19.2 | 10.3 |
| 1985 | 20.8 | 8.3 |


