

Abstract
Voxel-based morphometry has been used in the study of alterations in brain structure in type 1 diabetes mellitus patients. These changes are associated with clinical indices. The age at onset, pathogenesis, and treatment of type 1 diabetes mellitus are different from those for type 2 diabetes mellitus. Thus, type 1 and type 2 diabetes mellitus may have different impacts on brain structure. Only a few studies of the alterations in brain structure in type 2 diabetes mellitus patients using voxel-based morphometry have been conducted, with inconsistent results. We detected subtle changes in the brain structure of 23 cases of type 2 diabetes mellitus, and demonstrated that there was no significant difference between the total volume of gray and white matter of the brain of type 2 diabetes mellitus patients and that in controls. Regional atrophy of gray matter mainly occurred in the right temporal and left occipital cortex, while regional atrophy of white matter involved the right temporal lobe and the right cerebellar hemisphere. The ankle-brachial index in patients with type 2 diabetes mellitus strongly correlated with the volume of brain regions in the default mode network. The ankle-brachial index, followed by the level of glycosylated hemoglobin, most strongly correlated with the volume of gray matter in the right temporal lobe. These data suggest that voxel-based morphometry could detect small structural changes in patients with type 2 diabetes mellitus. Early macrovascular atherosclerosis may play a crucial role in subtle brain atrophy in type 2 diabetes mellitus patients, with chronic hyperglycemia playing a lesser role.
Keywords: nerve regeneration, diabetes mellitus, ankle-brachial index, albuminuria, neural regeneration
Introduction
The risk of cognitive impairment, vascular dementia and Alzheimer's disease is increased in patients with type 2 diabetes mellitus (Cheng et al., 2012; McCrimmon et al., 2012; Vagelatos and Eslick, 2013). It may be related to atherosclerotic cerebrovascular disease and/or neurodegeneration (Biessels et al., 2008). Small vessel disease revealed by conventional MRI is associated with type 2 diabetes mellitus (Prins et al., 2005; van Dijk et al., 2008), and with cognitive decline in type 2 diabetes mellitus (Bruehl et al., 2009). Moreover, patients with type 2 diabetes mellitus may show brain atrophy (Gold et al., 2007; van Harten et al., 2007b; Bruehl et al., 2011).
The previous methods for the study of brain atrophy in patients with type 2 diabetes mellitus have been mainly visual assessment (van Harten et al., 2007b), semi-automated measurement (Gold et al., 2007), and manual measurement (Bruehl et al., 2011). These methods have great bias, poor repeatability, require prior knowledge, and are often operator-dependent. Moreover, they are not sensitive to subtle microstructural changes. Voxel-based morphometry is characterized by complete automation, standardization, sensitivity, accuracy, and reliability (Ashburner and Friston, 2000). Voxel-based morphometry has been applied to study the changes in brain structure of patients with type 1 diabetes mellitus (Musen et al., 2006; Wessels et al., 2006; Perantie et al., 2007). Detectable brain structure changes were associated with clinical indices of patients with type 1 diabetes mellitus (Musen et al., 2006). Age at onset, pathogenesis, and treatment differ between type 1 diabetes mellitus and type 2 diabetes mellitus. In particular, the pathogenesis of type 2 diabetes mellitus is strongly associated with metabolic syndrome, and various effects on the brain might be expected (van Harten et al., 2007a). A few studies have addressed the application of voxel-based morphometry to characterizing the changes in brain structure of patients with type 2 diabetes mellitus (Chen et al., 2012; Moran et al., 2013), but their findings were discrepant in some aspects. Currently, any relationship between structural changes and clinical indices of diabetes mellitus, vascular disease, and cognitive function remains poorly elucidated.
We used voxel-based morphometry to detect changes in brain structure in type 2 diabetes mellitus patients, and evaluated the relationship of these alterations with clinical variables of diabetes mellitus, atherosclerotic vascular disease, and cognitive function.
Subjects and Methods
Study subjects
Right-handed patients with type 2 diabetes mellitus, aged 35–70 years, were recruited from the Outpatient Clinic of the Department of Endocrinology of the Second Hospital of Hebei Medical University in China. They had had diabetes mellitus for at least 1 year. Type 2 diabetes mellitus was in accordance with the diagnostic criteria of WHO (Alberti and Zimmet, 1998). None of them had used insulin secretagogues, such as nateglinide. None of them had a history of severe hypoglycemic episodes as defined by seizures, loss of consciousness, or the need for another person to help treat the symptoms of low blood glucose. Healthy controls were recruited from communities in Shijiazhuang City of China by advertisement. Cases and controls were matched according to gender, age, educational level, body mass index, smoking history, hypertension, and lipid levels. Controls whose fasting glucose was > 6.1 mmol/L or postprandial glucose was > 7.8 mmol/L were excluded. Exclusion criteria also included a score of < 26 on the Mini Mental State Examination, history of stroke, alcohol abuse, head trauma, Parkinson's disease, psychiatric illness (by clinical assessment and history taking) history of serious medical illness (tumor, anemia, chronic kidney disease), autoimmune diseases, endocrine disease, severe insomnia, or hearing loss. The subjects with contraindications for MRI were excluded. All patients and volunteers understood the study objective and signed informed consent. This study was approved by the Medical Ethics Inspection Committee of the Second Hospital of Hebei Medical University in China.
Clinical data and cognitive tests
Clinical data were collected, including height, weight, body mass index, years of education, dominant hand, smoking, drinking, history of hypertension, lipid status, and any use of antihypertensives or lipid-lowering agents. The subjects whose blood pressure was > 140/90 mmHg at three time points in a day, or who took antihypertensives, were categorized as hypertension patients. Blood was collected twice by venipuncture: fasting in the morning, and 2 hours after breakfast. Fasting glucose, triglycerides, total cholesterol, low-density lipoprotein cholesterol, high-density lipoprotein cholesterol, fasting serum C-peptide (only patients with type 2 diabetes mellitus), glycosylated hemoglobin (only patients with type 2 diabetes mellitus), and postprandial blood glucose were measured. Subjects were judged to have lipid abnormalities for any of the following: triglycerides ≥ 1.65 mmol/L, total cholesterol ≥ 6.20 mmol/L, low-density lipoprotein cholesterol ≥ 4.10 mmol/L, high-density lipoprotein cholesterol < 1.04 mmol/L, or if they were taking lipid-lowering drugs. Midstream urine of patients with type 2 diabetes mellitus was collected in the morning to measure urinary albumin, creatinine, and urinary albumin/creatinine ratio (mg/mmol). All subjects underwent cognitive tests, including the Mini-Mental State Examination, Montreal Cognitive Assessment and Clock Drawing Test, which were selected in accordance with previous studies (Reijmer et al., 2010; Zhou et al., 2010). No subjects had disorders of hearing or movement coordination, and could finish all tests. All tests took about 30 minutes. A homeostasis model assessment of insulin sensitivity was done using Homeostasis model assessment version 2 software, from the Diabetes Trials Unit website (http://www.dtu.ox.ac.uk), and fasting glucose and fasting C-peptide were used for calculation (Levy et al., 1998; Wallace et al., 2004).
For the type 2 diabetes mellitus group, measurement and calculation of the ankle-brachial index was done with an 8 MHz movable Doppler device (Huntleigh Diagnostics, Cardiff, UK). Ankle-brachial index was calculated as the ratio of the systolic arterial pressure of the ipsilateral ankle artery and posterior tibial artery to the systolic arterial pressure of the brachial artery. The lowest value of both sides was employed. Peripheral arterial disease was diagnosed if the ankle-brachial index was less than 0.9 (Guerchet et al., 2011) or < 1.0 (Laurin et al., 2007).
Scanning technique and parameters
An Achieva 3.0 T scanner (Phillips Achieva 3.0T, Best, the Netherlands) with an eight-channel head coil was used. Routine examination consisted of axial T1WI: Turbo Spin Echo (TSE) sequence, repetition time/echo time/inversion time, 3,056/7.6/860 ms, flip angle 90°; axial T2WI: TSE sequence, repetition time/echo time 2,000/80 ms, flip angle 90°; axial T2FLAIR: repetition time/echo time/inversion time, 10,002/130.4/2,400 ms, flip angle 90°; 5.0 mm thickness; spacing, 1.0 mm; matrix, 256 × 256; field of view, 24 × 24 cm2; average number of excitations, 1.
For three-dimensional T1 structural imaging: in a supine position, the subject was stationary in the gantry. A T1-TFE sequence was used to scan sagittal, high-resolution, three-dimensional structural images parallel to the line of the anterior-posterior commissure. Scanning parameters: repetition time/echo time 7.7/3.8 ms, flip angle 8°, thickness 1 mm, spacing 0 mm, voxel = 1 × 1 × 1 mm3, matrix 252 × 227, field of view 250 × 250 ×180 mm3, scan slices 180, and scan time 2.97 minutes.
Evaluation of microvascular lesions revealed on conventional MRI
T2FLAIR images and T2WI images were used to evaluate white matter lesions in accordance with the Wahlund scale (Wahlund et al., 2001). The highest possible score of white matter lesions was 30. The cerebral hemispheres were each divided into five regions by two readers blinded to the subjects’ history. The sum of scores of each region was the total score of white matter lesions. Lacunar infarctions were also evaluated for both groups. For inconsistent score, after separate evaluation, the two readers consulted and reached agreement.
Preprocessing of MRI images
MRI data were collected from a postprocessing workstation (Philips). Original images were transformed into NIFTI format through MRIcron. Statistical Parametric Mapping 8 software (www.fil.ion.ucl.ac.uk/spm/) and voxel-based morphometry 8 (dbm.neuro.uni-jena.de/vbm/) were employed to analyze image data. MATLAB R2012b (MathWorks, Natick, MA, USA) was used to provide the operating ambient.
At the beginning of the procedure, the quality of original images was checked. The images were oriented to the anterior commissure; subsequently, the structural images of the brains of different subjects were registered in 3D-space using the High-dimension Diffeomorphic Anatomical Registration Through Exponentiated Lie Algebra (DARTEL). The DARTEL template had been derived from 550 healthy controls in an IXI-database (http://www.brain-development.org), and placed in MNI space. This method avoids the need for additional registration in MNI space, and increases the accuracy of registration (Ashburner, 2007). The voxel size was re-sampled to 1.5 × 1.5 × 1.5 mm3. Standardization modulated the difference in brain size induced by affine transformation and nonlinear transformation. (3) Cluster analysis was used to perform image segmentation into gray matter, white matter and cerebrospinal fluid. The segmented data were smoothed (8 mm full width at half maximum). This smoothing eliminated intersubject differences in brain structure and compensated errors in space standardization. The resulting smoothed gray and white matter data were statistically analyzed.
The TD Lobes atlas of WFU Pickatlas software (www.ansir.wfubmc.edu) (operating ambient: MATLAB and Statistical Parametric Mapping 8 software) was used (Maldjian et al., 2003, 2004) to outline regions of interest for the right temporal lobe and left occipital lobe. The image data were re-sampled to 1.5 × 1.5 × 1.5 mm3. The volumes of gray and white matter in the whole brain and each region of interest were measured using Easy Volume software (http://www.sbirc.ed.ac.uk/cyril/index.html).
Correlation analysis of clinical data, intergroup differences in gray and white matter volume, and clinical variables
Data were analyzed using SPSS 17.0 software (SPSS, Chicago, IL, USA). The Shapiro-Walker method was used to test normality in measurement data. Body mass index, urinary albumin/creatinine ratio, glycosylated hemoglobin, and duration of disease followed a non-normal distribution. After logarithmic transformation, these data followed a normal distribution. Normally distributed demographic data, clinical data and cognitive data were analyzed using Student's t-test. Data that were non-normally distributed after logarithmic transformation were analyzed using the Wilcoxon rank sum test. Numeration data were analyzed using the chi-square test. The comparison of data from cognitive testing was corrected for age, gender, and educational level (analysis of covariance). Intergroup analysis of the volume of whole-brain and region of interest-based gray and white matter was performed using analysis of covariance, taking age, body mass index, and hypertension as covariates. The relationship of the volume of whole brain and regions of interest with clinical variables (age, duration of disease, body mass index, glycosylated hemoglobin, urinary albumin/creatinine ratio and ankle-brachial index) was analyzed using multiple linear regression in the type 2 diabetes mellitus subjects. Correlation with cognition was analyzed using partial correlation analysis taking educational level, age, body mass index, and hypertension as controlling elements. A two-sided P < 0.05 was considered statistically significant in the above tests.
Voxel-based intergroup analysis of regional differences in whole-brain gray and white matter volume
Since we considered hypertension to be a risk factor for brain atrophy (Gianaros et al., 2006), we established a model of two-way analysis of variance using diabetes mellitus and hypertension as main factors. Age, body mass index, and whole brain volume were used as covariates to correct their impacts and statistical parameter images were calculated. Differences in brain regions were observed when type 2 diabetes mellitus served as the main effect (P < 0.001, no correction, expectation values of 50 voxels in each cluster). The results were checked and the anatomical positions were identified using Xjview software (http://www.alivelearn.net/xjview).
Voxel-based correlation analysis of clinical variables and brain volume in the type 2 diabetes mellitus group
Correlation of gray and white matter volume with diabetes-associated clinical variables (such as age, duration of disease, glycosylated hemoglobin level, ankle-brachial index, and urinary albumin/creatinine ratio) in the type 2 diabetes mellitus group was analyzed using multiple regression in Statistical Parametric Mapping software. Brain volume was used as a dependent variable and the above clinical variables as independent variables (with one of them serving as an independent variable and the others as covariates). A statistical model was established by taking age as a covariate, and underwent correlation analysis.
Results
Demographic and clinical characteristics of subjects
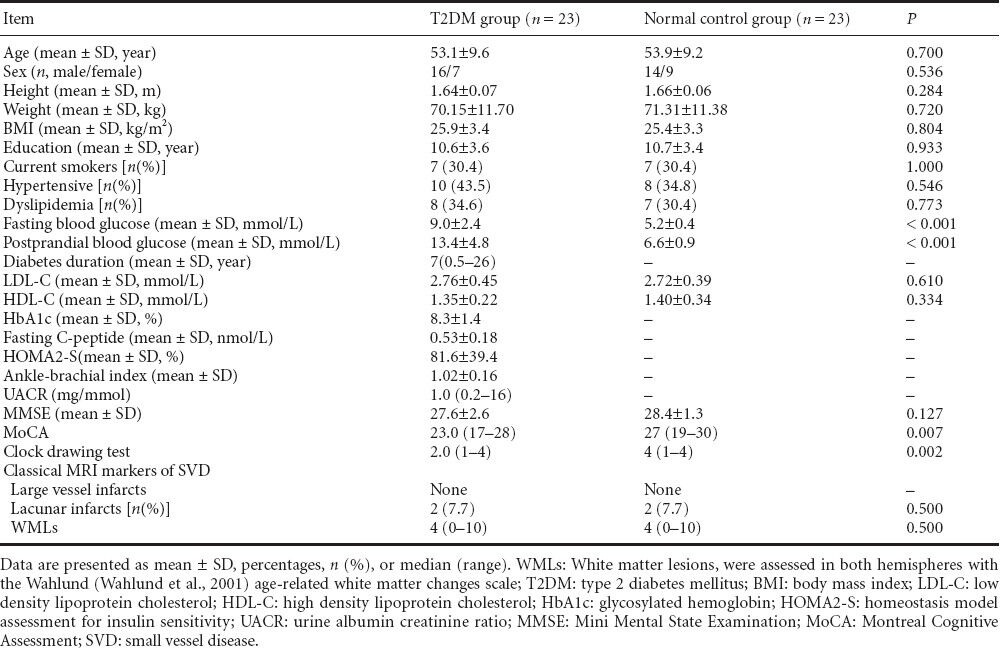
Gender, age, hypertension, lipid abnormalities, body mass index, educational level, and smoking status were closely matched between the type 2 diabetes mellitus and normal control groups (P = 0.536, 0.700, 0.546, 0.773, 0.804, 0.933, 1.000, respectively). Fasting blood glucose and postprandial blood glucose were significantly higher in the type 2 diabetes mellitus group than the normal control group (both P < 0.001). No significant difference in Mini-Mental State Examination score was detectable between the two groups (P = 0.127). Montreal Cognitive Assessment and Clock Drawing Test scores were significantly lower in the type 2 diabetes mellitus group than the normal control group (P = 0.007 and 0.002 respectively). No significant differences in white matter lesions or lacunar infarction grade on conventional MRI were revealed between the two groups (both P = 0.500). The details of the above data are listed in Table 1.
Table 1.
Demographic, clinical, and cognitive characteristics between T2DM and normal control groups
Vascular disease in subjects
No infarcts in the major vascular territories were observed in the type 2 diabetes mellitus and normal control groups on conventional MRI. No significant differences in white matter lesions and lacunar infarctions were revealed between the two groups (both P = 0.500).
The prevalence of peripheral arterial disease (using ankle-brachial index < 0.9 as the threshold) was 30% (7/23) in type 2 diabetes mellitus patients. Using an ankle-brachial index threshold of < 1.0 (Laurin et al., 2007), the prevalence of peripheral arterial disease was 52% (12/23) in the type 2 diabetes mellitus group.
Albuminuria was used as a sign of microvascular disease. It was diagnosed in accordance with USA criteria (National Kidney Foundation, 2002). No patients with macroalbuminuria (urinary albumin/creatinine ratio > 33.9 mg/mmol) were detected in the type 2 diabetes mellitus group. Urinary albumin/creatinine ratio > 1.92 g/mol for males and urinary albumin/creatinine ratio > 2.83 g/mol for females were considered the thresholds above which microalbuminuria was diagnosed; the incidence of microalbuminuria was 17.39% (4/23) in the type 2 diabetes mellitus group (Table 1).
Intergroup differences in total gray and white matter volumes and volumes within different regions
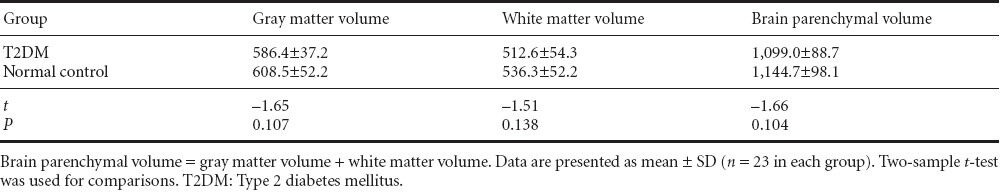
The total gray and white matter, and parenchymal volumes, trended lower in the type 2 diabetes mellitus group than in the normal control group, but not to a significant extent (P = 0.107, 0.138, 0.104, respectively; Table 2).
Table 2.
Comparison of the brain tissue volume (mL) in T2DM patients and normal controls
Voxel-based morphometry analysis revealed that, compared with normal controls, regional gray matter loss was visible in the right superior temporal gyrus, left inferior occipital gyrus, and right inferior temporal gyrus in patients with type 2 diabetes mellitus (P < 0.001; no correction; depends on expectation values of 53 voxels in each cluster (Figure 1; Table 3).
Figure 1.
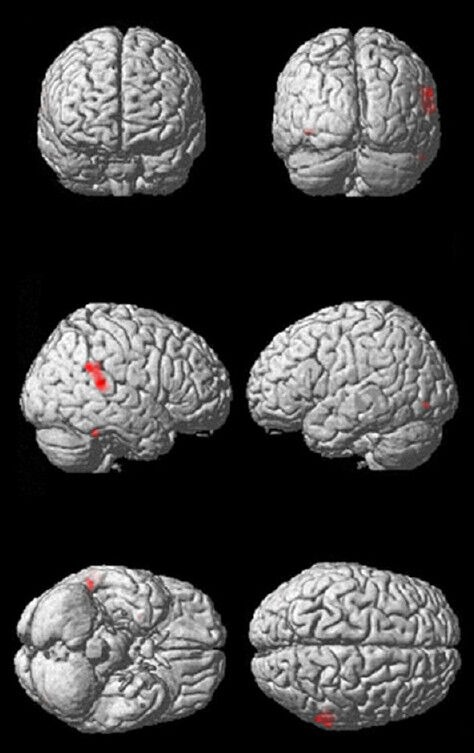
Three-dimensional reconstruction of the brain indicating gray matter loss in type 2 diabetes compared with control.
The regions of gray matter loss are shown from anterior, posterior, right lateral, left lateral, inferior and superior view, respectively, and the red region represents the region of gray matter loss.
Table 3.
Decreased regions of gray and white matter volume in type 2 diabetes mellitus patients compared with normal controls
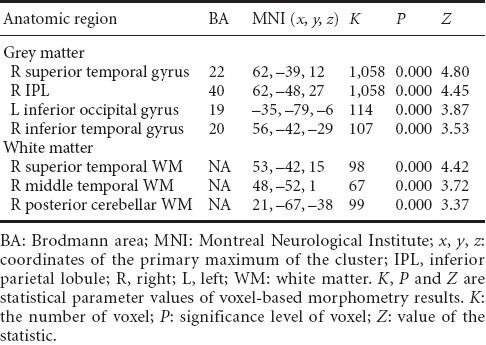
Voxel-based morphometry revealed that, compared with normal controls, regional white matter loss was visible in the right superior temporal gyrus, the right middle temporal gyrus, and the right posterior lobe of the cerebellum (P < 0.001; no correction; depends on expectation values of 50 voxels in each cluster (Figure 2, Table 3).
Figure 2.
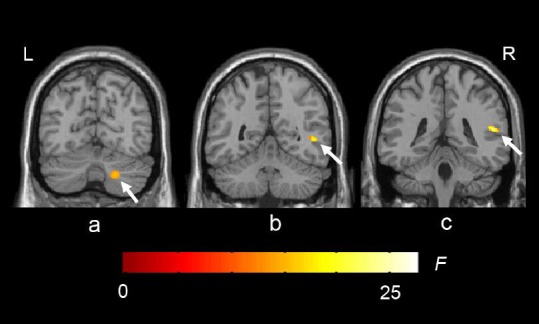
White matter loss in type 2 diabetes patients compared with normal controls.
The colored regions represent the regions of white matter loss. Arrows indicate right posterior cerebellar white matter loss (a), right middle temporal white matter loss (b) and right superior temporal white matter loss (c). R: Right; L: left. The underlying structure image is Ch2 image.
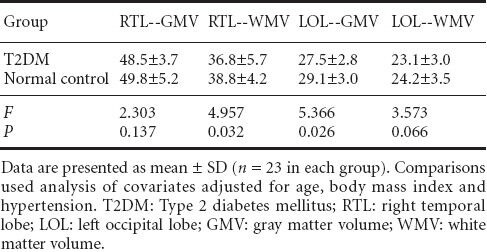
As voxel-based morphometry analysis demonstrated that regional volume changes were mainly found in the right temporal lobe and left occipital lobe, region of interest analyses for the right temporal lobe and the left occipital lobe were conducted, correcting for confounding factors including age, body mass index, and hypertension. The volumes of gray and white matter in each lobe were extracted and analyzed, and the results showed that the volumes of white matter in the right temporal lobe and gray matter in the left occipital lobe were significantly lower in the type 2 diabetes mellitus patients than in normal controls (P = 0.032 and 0.026, respectively). Conversely, no significant differences in the volumes of gray matter in the right temporal lobe and white matter in the left occipital lobe were detected between diabetes mellitus and normal subjects (P = 0.137 and 0.066, respectively; Table 4).
Table 4.
Region of interest analysis for gray and white matter volume (mL) of right temporal and left occipital lobes in T2DM patients compared with normal controls
Effects of clinical variables and vascular disease on brain volume in patients with type 2 diabetes mellitus
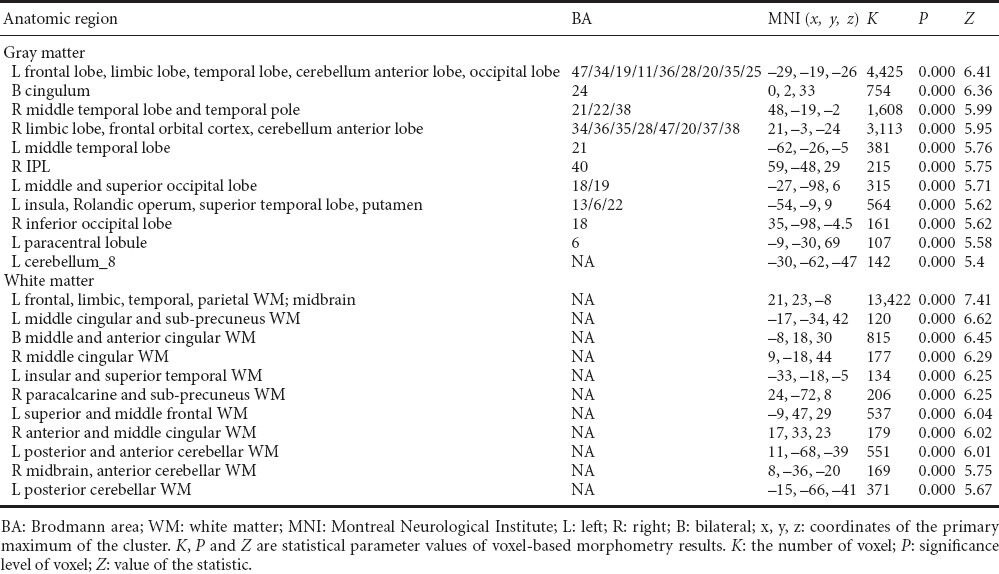
Correlation analysis showed that gray matter volumes in many brain regions correlated with ankle-brachial index in the type 2 diabetes mellitus group. These brain regions are mainly located in the default mode network, including the anterior and middle parts of the cingulate gyrus, the orbital cortex of the frontal lobes, both temporal lobes, both limbic lobes (hippocampus, parahippocampal gyrus, and amygdaloid body), both occipital lobes, the left paracentral lobule, and the left cerebellar cortex (4, 5, 6, 8) (one-sided P < 0.05; family-wise error correction) (Figure 3). The correlation analysis of white matter and clinical variables revealed that white matter volumes in many brain regions also correlated with ankle-brachial index, including both frontal lobes, both temporal lobes, the precuneus, the limbic lobe (containing hippocampus, cingulum, parahippocampal and insular lobes), the midbrain, and both cerebellar hemispheres (one-sided P < 0.05; family-wise error correction) (Figure 4). These data are displayed in Table 5.
Figure 3.
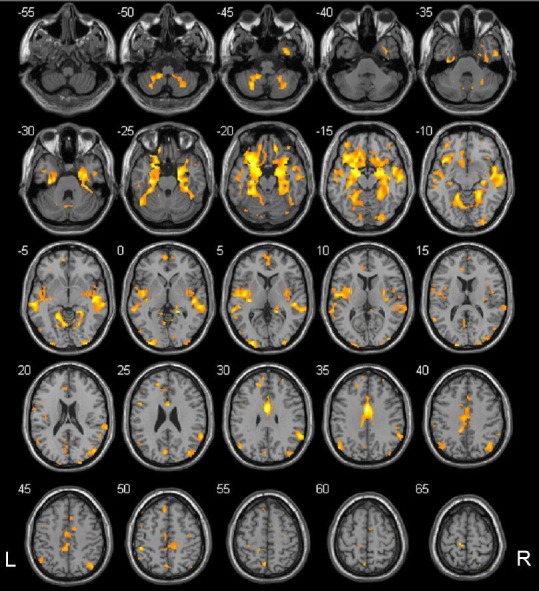
Regions where gray matter volumes positively correlated with ankle-brachial index in type 2 diabetes mellitus patients.
The colored regions represent the regions whose gray matter volumes correlated with ankle-brachial index. These regions were largely consistent with those in the default mode network. The underlying structure image is Ch2 image. The number at the left-top corner of each image represents the Montreal Neurological Institute (MNI) coordinate. R: Right; L: left.
Figure 4.
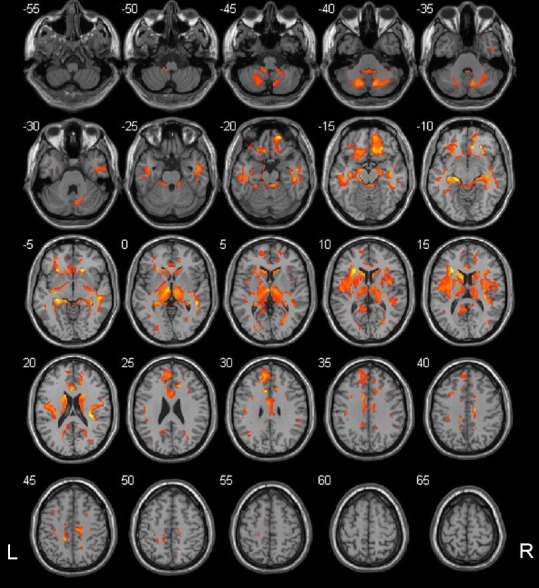
Regions where white matter volumes positively correlated with ankle-brachial index in type 2 diabetes mellitus patients.
The colored regions represent the regions whose white matter volumes correlated with ankle-brachial index. These regions were mainly subcortical regions of the default mode network. The underlying structure image is Ch2 image. The number at the left-top corner of each image represents the Montreal Neurological Institute (MNI) coordinate. R: Right; L: left.
Table 5.
Regions of grey and white matter volume correlated with ankle-brachial index for type 2 diabetes mellitus patients
There was no brain region whose volume of white matter or gray matter correlated with duration of disease, glycosylated hemoglobin, or urinary albumin/creatinine ratio.
Correlation of gray and white matter volume with clinical variables and cognition in type 2 diabetes mellitus group
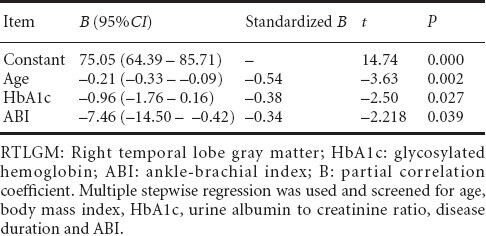
Taking clinical variables such as age, body mass index, duration of disease, glycosylated hemoglobin, ankle-brachial index and urinary albumin/creatinine ratio were considered as independent variables; and total gray and white matter volume, right temporal lobe and left occipital lobe gray and white matter volumes as dependent variables, multiple linear regression demonstrated that gray matter volume in the right temporal lobe was most strongly associated with ankle-brachial index (B = −7.457), followed by glycosylated hemoglobin (B = 0.96) and age (B = 0.21; Table 6). No significant differences between other clinical variables and brain volumes were detected. After correction for age, educational level, body mass index and hypertension, white matter volume and brain parenchymal volume were positively correlated with the Montreal Cognitive Assessment score (r = 0.433, P = 0.032; r = 0.394, P = 0.047). After an additional correction for total gray matter volume, this correlation became insignificant (r = 0.364, P = 0.137; r = 0.364, P = 0.137). However, there was no significant correlation between the volumes of gray matter or white matter in the right temporal lobe or in the left occipital lobe and Montreal Cognitive Assessment scores (P = 0.414, 0.314, 0.497 and 0.209 respectively).
Table 6.
Associations between RTLGM volume and clinical variables in type 2 diabetes mellitus patients
Discussion
In this study, voxel-based morphometry detected differences in volumes of gray and white matter in the right temporal lobe in the absence of obvious decrease in total gray and white matter volume between type 2 diabetes mellitus patients and controls. These regional volume changes were correlated with macrovascular disease (ankle-brachial index) and chronic hyperglycemia (glycosylated hemoglobin). In addition, we examined the relationship between cognition and volume changes, but found that these changes could not explain the decreased cognition in type 2 diabetes mellitus patients.
In previous studies, voxel-based morphometry showed regional gray matter atrophy in the hippocampus, anterior cingulate gyrus, and medial prefrontal lobe in type 2 diabetes mellitus patients (Kamiyama et al., 2010; Moran et al., 2013), which differs with our results. Kamiyama et al. (2010) confirmed that severe atrophy was observed in the hippocampus and the whole brain of type 2 diabetes mellitus patients. These differences may be explained by different experimental methodology. Voxel-based morphometry analysis was used by Kamiyama et al., but they generated an atrophy index after comparing the brain of type 2 diabetes mellitus and control groups with the self-contained template with their software. We directly obtained results after performing voxel-by-voxel comparisons of type 2 diabetes mellitus and control groups. Another likely reason was the differences in the experimental populations. The average age of their patients was 70.7 years, but ours was 53.1 years. Moran et al. (2013) demonstrated that anterior cingulate and medial prefrontal cortical atrophy were found in addition to gray matter atrophy in the medial temporal lobe. Again, these differences may be due to different methodology and study populations. Moran et al. used regression analysis using type 2 diabetes mellitus as a main effect. Conversely, we considered the confounding factor, hypertension, and conducted analysis of variance in the two groups. We believe that our direct voxel-based morphometry analysis might be more sensitive than indirect comparison and regression analysis. However, this needs to be confirmed by further studies.
Findings concerning the relationship between type 2 diabetes mellitus and white matter lesions are controversial (Korf et al., 2006; Manschot et al., 2006; van Harten et al., 2007a). It remains poorly understood whether type 2 diabetes mellitus induces the atrophy of white matter. We found the regions with regional white matter loss, i.e., right middle temporal gyrus, right superior temporal gyrus, and right posterior lobe of cerebellum, after matching the white matter lesions between type 2 diabetes mellitus and control groups, which was not completely consistent with the results of a previous study (Chen et al., 2012). The reasons again might be the population difference and methodology. On the basis of region of interest analysis, we verified that white matter volume in the right temporal lobe was lower in the type 2 diabetes mellitus group than in the control group, which was consistent with the results of Chen et al. These results indicate that white mater atrophy in the right temporal lobe probably is a marker of early brain structural changes in type 2 diabetes mellitus.
The precise mechanism of neuropathology of diabetes mellitus-induced brain injury remains unclear. However, it is believed that vascular factors play an important role (Manschot et al., 2007; Exalto et al., 2012; McCrimmon et al., 2012). Peripheral arterial disease is one of the complications of diabetes mellitus, not only characterized by lower extremity vascular disease, but by generalized atherosclerosis. Peripheral arterial disease is a strong predictor of cerebrovascular disease (Rafnsson et al., 2009). The ankle-brachial index is the most sensitive and exact method to detect peripheral arterial disease (Baumgartner et al., 2005). Therefore, the ankle-brachial index also could alert the physician to central nervous system lesions before they caused infarction and hemorrhage. Based on the regression model of voxel-based morphometry, we found that the volume of gray matter in the default mode network and associated white matter positively correlated with ankle-brachial index. The default mode network mainly consists of the posterior cingulate cortex, precuneus, prefrontal cortex, and limbic lobe. The cerebral blood flow in these regions is higher than the average value of the whole brain in the resting state (Raichle et al., 2001), but apparently decreases when cognitive tasks are performed (Shulman et al., 1997; Mazoyer et al., 2001). Our results suggest that, before causing conventional MRI-revealed sequelae (infarction and hemorrhage), early macrovascular atherosclerotic disease could induce volume reduction in the brain regions with abundant blood supply in the resting state. However, voxel-based morphometry correlation analysis of other indices such as duration of disease, glycosylated hemoglobin, and urinary albumin/creatinine ratio did not show significant correlation with volume of any brain regions. The reason may be that compared with ankle-brachial index, the effects of the other indices were relatively weak, or because of the relatively good clinical status of our type 2 diabetes mellitus patients (median duration of disease, 7.0 years; glycosylated hemoglobin, 8.3 ± 1.4%; incidence of microalbuminuria, 17.39%). Future studies should follow up these patients, and assess for any longitudinal changes of these indices and their effect on brain volume.
Based on region of interest analysis of brain volume, we further verified the effects of macrovascular atherosclerosis on brain volume. That is, regression analysis found that ankle-brachial index had the greatest effect on gray matter volume in the right temporal lobe, followed by glycosylated hemoglobin, which was consistent with previous studies (Enzinger et al., 2005; Carmichael et al., 2007). For example, Carmichael et al. (2007) confirmed that the ratio of brain ventricle to parenchyma longitudinally increased in diabetes mellitus patients with vascular disease. Furthermore, Enzinger et al. (2005) demonstrated that an increased atrophy rate over time correlated with high levels of glycosylated hemoglobin. The previous two methods for measuring brain volume were inexact. Our voxel-based morphometry analysis results further confirm that macrovascular disease and chronic hyperglycemia are associated with subtle changes in brain volume.
A few previous studies examined the effects of whole brain and circumscribed atrophy in type 2 diabetes mellitus on cognitive function, but most of them did not use voxel-based morphometry and their results were not identical (Akisaki et al., 2006; Manschot et al., 2006; van Harten et al., 2007b; Moran et al., 2013). In this study, the poorer performance on the Montreal Cognitive Assessment and Clock Drawing Test in type 2 diabetes mellitus patients suggested that cognitive decline might be induced by alterations in any gray and white matter region (Mendez et al., 1992; Alagiakrishnan et al., 2013; Paula et al., 2013). This could explain the absence of correlation between regional volume and global cognition. Because our cognitive test was not detailed and specific enough, non-correlation between a single region of interest volume and whole-brain cognition may not necessarily exclude its effects in specific cognitive domains. Future studies should examine cognitive function strongly related to specific brain regions to judge the effects of the changes in these regions on corresponding cognitive functions.
In summary, subtle focal brain atrophy can occur in the right temporal lobe in non-demented type 2 diabetes mellitus patients with no conventional MRI evidence of sequelae of large vessel disease (infarction or hemorrhage). Early macrovascular atherosclerotic disease may play a key role in the structural changes in type 2 diabetes mellitus, and chronic hyperglycemia might be the other primary etiology.
Footnotes
Conflicts of interest: None declared.
Copyedited by McCarty W, Robens J, Yu J, Qiu Y, Li CH, Song LP, Zhao M
References
- 1.Akisaki T, Sakurai T, Takata T, Umegaki H, Araki A, Mizuno S, Tanaka S, Ohashi Y, Iguchi A, Yokono K, Ito H. Cognitive dysfunction associates with white matter hyperintensities and subcortical atrophy on magnetic resonance imaging of the elderly diabetes mellitus Japanese elderly diabetes intervention trial (J-EDIT) Diabetes Metab Res Rev. 2006;22:376–384. doi: 10.1002/dmrr.632. [DOI] [PubMed] [Google Scholar]
- 2.Alagiakrishnan K, Zhao N, Mereu L, Senior P, Senthilselvan A. Montreal Cognitive Assessment is superior to Standardized Mini-Mental Status Exam in detecting mild cognitive impairment in the middle-aged and elderly patients with type 2 diabetes mellitus. BioMed Res Int 2013. 2013:186106. doi: 10.1155/2013/186106. [DOI] [PMC free article] [PubMed] [Google Scholar]
- 3.Alberti KG, Zimmet PZ. Definition, diagnosis and classification of diabetes mellitus and its complications. Part 1: diagnosis and classification of diabetes mellitus provisional report of a WHO consultation. Diabet Med. 1998;15:539–553. doi: 10.1002/(SICI)1096-9136(199807)15:7<539::AID-DIA668>3.0.CO;2-S. [DOI] [PubMed] [Google Scholar]
- 4.Ashburner J. A fast diffeomorphic image registration algorithm. Neuroimage. 2007;38:95–113. doi: 10.1016/j.neuroimage.2007.07.007. [DOI] [PubMed] [Google Scholar]
- 5.Ashburner J, Friston KJ. Voxel-based morphometry--the methods. Neuroimage. 2000;11:805–821. doi: 10.1006/nimg.2000.0582. [DOI] [PubMed] [Google Scholar]
- 6.Baumgartner I, Schainfeld R, Graziani L. Management of peripheral vascular disease. Annu Rev Med. 2005;56:249–272. doi: 10.1146/annurev.med.56.082103.104649. [DOI] [PubMed] [Google Scholar]
- 7.Biessels GJ, Deary IJ, Ryan CM. Cognition and diabetes: a lifespan perspective. Lancet Neurol. 2008;7:184–190. doi: 10.1016/S1474-4422(08)70021-8. [DOI] [PubMed] [Google Scholar]
- 8.Bruehl H, Sweat V, Tirsi A, Shah B, Convit A. Obese adolescents with type 2 diabetes mellitus have hippocampal and frontal lobe volume reductions. Neurosci Med. 2011;2:34–42. doi: 10.4236/nm.2011.21005. [DOI] [PMC free article] [PubMed] [Google Scholar]
- 9.Bruehl H, Wolf OT, Sweat V, Tirsi A, Richardson S, Convit A. Modifiers of cognitive function and brain structure in middle-aged and elderly individuals with type 2 diabetes mellitus. Brain Res. 2009;1280:186–194. doi: 10.1016/j.brainres.2009.05.032. [DOI] [PMC free article] [PubMed] [Google Scholar]
- 10.Carmichael OT, Kuller LH, Lopez OL, Thompson PM, Dutton RA, Lu A, Lee SE, Lee JY, Aizenstein HJ, Meltzer CC, Liu Y, Toga AW, Becker JT. Cerebral ventricular changes associated with transitions between normal cognitive function, mild cognitive impairment, and dementia. Alzheimer Dis Assoc Disord. 2007;21:14–24. doi: 10.1097/WAD.0b013e318032d2b1. [DOI] [PMC free article] [PubMed] [Google Scholar]
- 11.Chen Z, Li L, Sun J, Ma L. Mapping the brain in type II diabetes: Voxel-based morphometry using DARTEL. Euro J Radiol. 2012;81:1870–1876. doi: 10.1016/j.ejrad.2011.04.025. [DOI] [PubMed] [Google Scholar]
- 12.Cheng G, Huang C, Deng H, Wang H. Diabetes as a risk factor for dementia and mild cognitive impairment: a meta-analysis of longitudinal studies. Intern Med J. 2012;42:484–491. doi: 10.1111/j.1445-5994.2012.02758.x. [DOI] [PubMed] [Google Scholar]
- 13.Enzinger C, Fazekas F, Matthews PM, Ropele S, Schmidt H, Smith S, Schmidt R. Risk factors for progression of brain atrophy in aging: six-year follow-up of normal subjects. Neurology. 2005;64:1704–1711. doi: 10.1212/01.WNL.0000161871.83614.BB. [DOI] [PubMed] [Google Scholar]
- 14.Exalto LG, Whitmer RA, Kappele LJ, Biessels GJ. An update on type 2 diabetes, vascular dementia and Alzheimer's disease. Exp Gerontol. 2012;47:858–864. doi: 10.1016/j.exger.2012.07.014. [DOI] [PubMed] [Google Scholar]
- 15.Gianaros PJ, Greer PJ, Ryan CM, Jennings JR. Higher blood pressure predicts lower regional grey matter volume: Consequences on short-term information processing. Neuroimage. 2006;31:754–765. doi: 10.1016/j.neuroimage.2006.01.003. [DOI] [PMC free article] [PubMed] [Google Scholar]
- 16.Gold SM, Dziobek I, Sweat V, Tirsi A, Rogers K, Bruehl H, Tsui W, Richardson S, Javier E, Convit A. Hippocampal damage and memory impairments as possible early brain complications of type 2 diabetes. Diabetologia. 2007;50:711–719. doi: 10.1007/s00125-007-0602-7. [DOI] [PubMed] [Google Scholar]
- 17.Guerchet M, Aboyans V, Nubukpo P, Lacroix P, Clement JP, Preux PM. Ankle-brachial index as a marker of cognitive impairment and dementia in general population. A systematic review. Atherosclerosis. 2011;216:251–257. doi: 10.1016/j.atherosclerosis.2011.03.024. [DOI] [PubMed] [Google Scholar]
- 18.Kamiyama K, Wada A, Sugihara M, Kurioka S, Hayashi K, Hayashi T, Yoshisako T, Yamamoto N, Tsuchie Y, Yamaguchi S, Sugimoto T, Kitagaki H. Potential hippocampal region atrophy in diabetes mellitus type 2: a voxel-based morphometry VSRAD study. Jpn J Radiol. 2010;28:266–272. doi: 10.1007/s11604-009-0416-2. [DOI] [PubMed] [Google Scholar]
- 19.Korf ES, White LR, Scheltens P, Launer LJ. Brain aging in very old men with type 2 diabetes: the Honolulu-Asia Aging Study. Diabetes Care. 2006;29:2268–2274. doi: 10.2337/dc06-0243. [DOI] [PubMed] [Google Scholar]
- 20.Levy JC, Matthews DR, Hermans MP. Correct homeostasis model assessment (HOMA) evaluation uses the computer program. Diabetes Care. 1998;21:2191–2192. doi: 10.2337/diacare.21.12.2191. [DOI] [PubMed] [Google Scholar]
- 21.Maldjian JA, Laurienti PJ, Burdette JH. Precentral gyrus discrepancy in electronic versions of the Talairach atlas. Neuroimage. 2004;21:450–455. doi: 10.1016/j.neuroimage.2003.09.032. [DOI] [PubMed] [Google Scholar]
- 22.Maldjian JA, Laurienti PJ, Kraft RA, Burdette JH. An automated method for neuroanatomic and cytoarchitectonic atlas-based interrogation of fMRI data sets. Neuroimage. 2003;19:1233–1239. doi: 10.1016/s1053-8119(03)00169-1. [DOI] [PubMed] [Google Scholar]
- 23.Manschot SM, Brands AM, van der Grond J, Kessels RP, Algra A, Kappelle LJ, Biessels GJ Utrecht Diabetic Encephalopathy Study G. Brain magnetic resonance imaging correlates of impaired cognition in patients with type 2 diabetes. Diabetes. 2006;55:1106–1113. doi: 10.2337/diabetes.55.04.06.db05-1323. [DOI] [PubMed] [Google Scholar]
- 24.Manschot SM, Biessels GJ, de Valk H, Algra A, Rutten GE, van der Grond J, Kappelle LJ Utrecht Diabetic Encephalopathy Study G. Metabolic and vascular determinants of impaired cognitive performance and abnormalities on brain magnetic resonance imaging in patients with type 2 diabetes. Diabetologia. 2007;50:2388–2397. doi: 10.1007/s00125-007-0792-z. [DOI] [PMC free article] [PubMed] [Google Scholar]
- 25.Mazoyer B, Zago L, Mellet E, Bricogne S, Etard O, Houde O, Crivello F, Joliot M, Petit L, Tzourio-Mazoyer N. Cortical networks for working memory and executive functions sustain the conscious resting state in man. Brain Res Bull. 2001;54:287–298. doi: 10.1016/s0361-9230(00)00437-8. [DOI] [PubMed] [Google Scholar]
- 26.McCrimmon RJ, Ryan CM, Frier BM. Diabetes and cognitive dysfunction. Lancet. 2012;379:2291–2299. doi: 10.1016/S0140-6736(12)60360-2. [DOI] [PubMed] [Google Scholar]
- 27.Mendez MF, Ala T, Underwood KL. Development of scoring criteria for the clock drawing task in Alzheimer's disease. J Am Geriatr Soc. 1992;40:1095–1099. doi: 10.1111/j.1532-5415.1992.tb01796.x. [DOI] [PubMed] [Google Scholar]
- 28.Moran C, Phan TG, Chen J, Blizzard L, Beare R, Venn A, Munch G, Wood AG, Forbes J, Greenaway TM, Pearson S, Srikanth V. Brain atrophy in type 2 diabetes: regional distribution and influence on cognition. Diabetes Care. 2013;36:4036–4042. doi: 10.2337/dc13-0143. [DOI] [PMC free article] [PubMed] [Google Scholar]
- 29.Musen G, Lyoo IK, Sparks CR, Weinger K, Hwang J, Ryan CM, Jimerson DC, Hennen J, Renshaw PF, Jacobson AM. Effects of type 1 diabetes on gray matter density as measured by voxel-based morphometry. Diabetes. 2006;55:326–333. doi: 10.2337/diabetes.55.02.06.db05-0520. [DOI] [PubMed] [Google Scholar]
- 30.National Kidney Foundation (2002) K/DOQI clinical practice guidelines for chronic kidney disease: evaluation, classification, and stratification. Am J Kidney Dis. 39:S1–266. [PubMed] [Google Scholar]
- 31.Paula JJ, Miranda DM, Moraes EN, Malloy-Diniz LF. Mapping the clockworks: what does the Clock Drawing Test assess in normal and pathological aging? Arq Neuropsiquiatr. 2013;71:763–768. doi: 10.1590/0004-282X20130118. [DOI] [PubMed] [Google Scholar]
- 32.Perantie DC, Wu J, Koller JM, Lim A, Warren SL, Black KJ, Sadler M, White NH, Hershey T. Regional brain volume differences associated with hyperglycemia and severe hypoglycemia in youth with type 1 diabetes. Diabetes Care. 2007;30:2331–2337. doi: 10.2337/dc07-0351. [DOI] [PubMed] [Google Scholar]
- 33.Prins ND, van Dijk EJ, den Heijer T, Vermeer SE, Jolles J, Koudstaal PJ, Hofman A, Breteler MM. Cerebral small-vessel disease and decline in information processing speed, executive function and memory. Brain. 2005;128:2034–2041. doi: 10.1093/brain/awh553. [DOI] [PubMed] [Google Scholar]
- 34.Rafnsson SB, Deary IJ, Fowkes FG. Peripheral arterial disease and cognitive function. Vasc Med. 2009;14:51–61. doi: 10.1177/1358863X08095027. [DOI] [PubMed] [Google Scholar]
- 35.Raichle ME, MacLeod AM, Snyder AZ, Powers WJ, Gusnard DA, Shulman GL. A default mode of brain function. Proc Natl Acad Sci U S A. 2001;98:676–682. doi: 10.1073/pnas.98.2.676. [DOI] [PMC free article] [PubMed] [Google Scholar]
- 36.Shulman GL, Fiez JA, Corbetta M, Buckner RL, Miezin FM, Raichle ME, Petersen SE. Common Blood Flow Changes across Visual Tasks: II. Decreases in Cerebral Cortex. J Cogn Neurosci. 1997;9:648–663. doi: 10.1162/jocn.1997.9.5.648. [DOI] [PubMed] [Google Scholar]
- 37.Vagelatos NT, Eslick GD. Type 2 diabetes as a risk factor for Alzheimer's disease: the confounders, interactions, and neuropathology associated with this relationship. Epidemiol Rev. 2013 doi: 10.1093/epirev/mxs012. Epub ahead of print. [DOI] [PubMed] [Google Scholar]
- 38.van Dijk EJ, Prins ND, Vrooman HA, Hofman A, Koudstaal PJ, Breteler MM. Progression of cerebral small vessel disease in relation to risk factors and cognitive consequences: Rotterdam Scan study. Stroke. 2008;39:2712–2719. doi: 10.1161/STROKEAHA.107.513176. [DOI] [PubMed] [Google Scholar]
- 39.van Harten B, Oosterman JM, Potter van Loon BJ, Scheltens P, Weinstein HC. Brain lesions on MRI in elderly patients with type 2 diabetes mellitus. Eur Neurol. 2007a;57:70–74. doi: 10.1159/000098054. [DOI] [PubMed] [Google Scholar]
- 40.van Harten B, Oosterman J, Muslimovic D, van Loon BJ, Scheltens P, Weinstein HC. Cognitive impairment and MRI correlates in the elderly patients with type 2 diabetes mellitus. Age Ageing. 2007b;36:164–170. doi: 10.1093/ageing/afl180. [DOI] [PubMed] [Google Scholar]
- 41.Wahlund LO, Barkhof F, Fazekas F, Bronge L, Augustin M, Sjogren M, Wallin A, Ader H, Leys D, Pantoni L, Pasquier F, Erkinjuntti T, Scheltens P. A new rating scale for age-related white matter changes applicable to MRI and CT. Stroke. 2001;32:1318–1322. doi: 10.1161/01.str.32.6.1318. [DOI] [PubMed] [Google Scholar]
- 42.Wallace TM, Levy JC, Matthews DR. Use and abuse of HOMA modeling. Diabetes Care. 2004;27:1487–1495. doi: 10.2337/diacare.27.6.1487. [DOI] [PubMed] [Google Scholar]
- 43.Wessels AM, Simsek S, Remijnse PL, Veltman DJ, Biessels GJ, Barkhof F, Scheltens P, Snoek FJ, Heine RJ, Rombouts SA. Voxel-based morphometry demonstrates reduced grey matter density on brain MRI in patients with diabetic retinopathy. Diabetologia. 2006;49:2474–2480. doi: 10.1007/s00125-006-0283-7. [DOI] [PubMed] [Google Scholar]
- 44.Zhou H, Lu W, Shi Y, Bai F, Chang J, Yuan Y, Teng G, Zhang Z. Impairments in cognition and resting-state connectivity of the hippocampus in elderly subjects with type 2 diabetes. Neurosci Lett. 2010;473:5–10. doi: 10.1016/j.neulet.2009.12.057. [DOI] [PubMed] [Google Scholar]