Abstract
Background
Common existing phylogenetic tree visualisation tools are not able to display readable trees with more than a few thousand nodes. These existing methodologies are based in two dimensional space.
Results
We introduce the idea of visualising phylogenetic trees in three dimensional hyperbolic space with the Walrus graph visualisation tool and have developed a conversion tool that enables the conversion of standard phylogenetic tree formats to Walrus' format. With Walrus, it becomes possible to visualise and navigate phylogenetic trees with more than 100,000 nodes.
Conclusion
Walrus enables desktop visualisation of very large phylogenetic trees in 3 dimensional hyperbolic space. This application is potentially useful for visualisation of the tree of life and for functional genomics derivatives, like The Adaptive Evolution Database (TAED).
Background
There are approximately 1.7 million identified species. A conservative estimate of the total number of species on Earth is 4 to 10 million species. About 80,000 of the identified species have a resolved phylogeny and ongoing research aims to substantially increase this number [1]. While methods for phylogenetic visualization have typically been developed for small phylogenetic trees, new methods are required as efforts to resolve the tree of life proceed. Beyond purely taxonomic interest, visualising phylogenetic data is increasingly important in functional genomics and other fields (see [2,3]). For example, systematic analysis of genome content, adaptive evolution of proteins, and other genome scale datasets can be parsed phylogenetically, where an overview of the relationship of species is important.
Many common software tools for visualising small phylogenetic trees already exist, including Treeview [4] and ATV [5]. These tools lay out trees in a two dimensional Euclidean space and are useful for visualising trees of up to a few hundred nodes. Some software tools, like Hypertree [6], have increased the number of visualisable nodes using 2D hyperbolic space to provide a "focus+context" view, where a subset of the data can be viewed at higher resolution with the remaining contextual data still in view (see the Deep Green project for an example with plant phylogenies [7]).
In hyperbolic space (as opposed to Euclidean space), circumference and area increase exponentially instead of geometrically, enabling allocation of space for every node independent of the total number of nodes in the tree. Although hyperbolic space is infinite, it can be projected into a finite volume of euclidean space for a "focus+context" view. The result of the projection is a disc where points within the disc are magnified according to their radial distance from the center with the amount of magnification decreasing continuously and at an accelerating rate from the center to the boundary. By bringing different parts of a tree to the magnified central region, the user can examine every part of the tree in detail while retaining a sense of the context. Hypertree allows visualisation of up to a thousand nodes [6]. While this represents an improvement, a tool that can handle an order of magnitude more nodes is still required.
Different approaches have been proposed for solving this problem. One strategy is to not visualise the whole tree but instead to display a representative part of it as implemented in SpaceTree and TreeWiz [8,9]. Visualization using virtual reality has also been reported as a potential approach to the problem, but this requires a special virtual reality chamber [10,11].
We suggest visualising trees in 3D rather than 2D hyperbolic space which allows rendering inside a sphere rather than a disc. By using specifically developed layout algorithms [12], the Walrus tool (related to H3 Viewer) [12-14] makes it possible to interactively visualise the entirety of trees with several hundred thousand nodes on a desktop computer.
Implementation
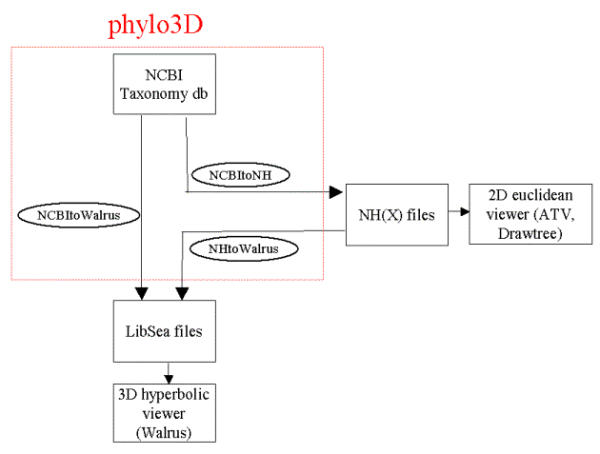
Walrus and the Walrus phylogenetic tree conversion tool are written in Java. The architecture of the design is depicted in Figure 1. Walrus reads files in its own specific LibSea format [15]. This format describes the topology of the tree and the labels associated with the nodes (labels can be textual or numerical). A conversion program converts various phylogenetic tree formats to the LibSea format by converting both the topology and the label data. The implemented features in the conversion tool include conversion from New Hampshire (Newick, Phylip), New Hampshire Extended (ATV) and the NCBI taxonomy database files to the LibSea format, narrowing the conversion to a particular subtree of interest, colouring of different sections of the tree included in the conversion and production of a corresponding legend, and with conversion from the NCBI taxonomy database format, inclusion in the LibSea output of data on rank, taxonomic ID, and scientific name, as included in the NCBI database [16].
Figure 1.

The architecture of software design for the utilization of Walrus in the visualisation of phylogenetic trees is shown. The phylogenetic tree conversion tool converts NCBI, New Hampshire, and New Hampshire Extended formats into LibSea files for direct visualisation by Walrus.
Results and discussion
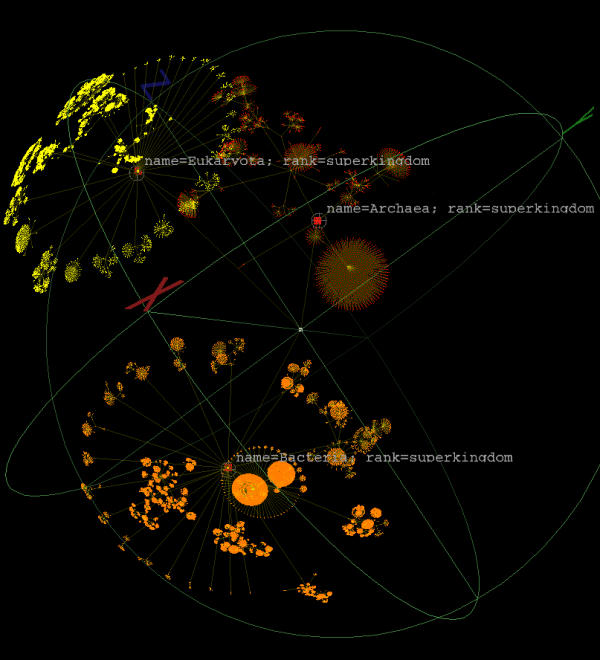
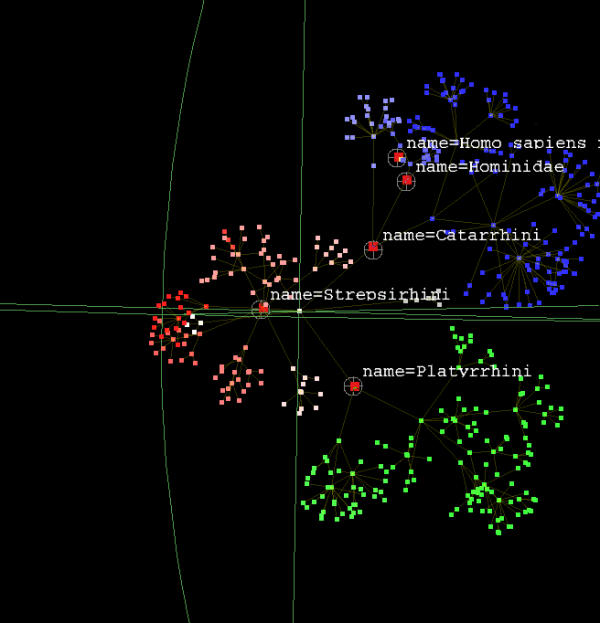
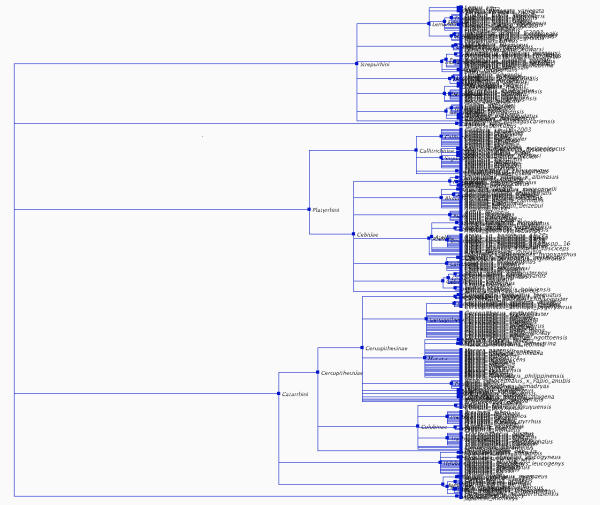
Figure 2 depicts the cellular tree of life from the NCBI taxonomy database [16]. The X depicts the root of the tree, while the Eukaryotes, Archaea, and Eubacteria are clearly visible as distinct groupings. With this view in the background for perspective, it is possible to view closer relationships in detail. Figure 3 shows the primate tree from the NCBI taxonomy database. Figure 4 shows the same tree in ATV [5], where the 321 leaves are much less distinguishable. While traditional 2D viewers like ATV have other uses, the advantages of 3D viewers like Walrus for large scale visualisation are readily apparent from Figures 3 and 4.
Figure 2.

The cellular tree of life from the NCBI taxonomy database [16] is depicted. Eukaryotes, Archaea, and Bacteria are clearly labeled and are visible as separate groupings.
Figure 3.

The primate taxonomy from the NCBI taxonomy database [16] in Walrus in 3D is depicted.
Figure 4.

The same primate species relationship seen with Walrus in 3D in Figure [3] is now seen in ATV [5] in 2D.
Visualising phylogenetic and taxonomic classification data in 3D has clear utility. While the examples shown in Figures 2, 3, and 4 present species trees and taxonomic relationships, the browser can also be utilized for extremely large gene family trees. Olfactory receptors are one gene family with an interesting history of gene duplication, selection, and gene loss that can be visualised using this type of tool [17]. Finally, the tool is valuable as a companion for the front end of databases containing functional genomics information indexed phylogenetically, like The Adaptive Evolution Database (TAED) [2].
Conclusions
Munzner and colleagues have demonstrated the advantage of using hierarchical data viewers enhanced with a 3D hyperbolic view over conventional 2D based viewers for efficiency of deciphering tree-based information [18]. While the 3D hyperbolic visualization of phylogenetic trees will not fully supplant 2D viewers, it can serve as an additional module to augment other visualization components. In the future, a phylogenetic tree visualization tool that integrates several visualization components in a similar way to the XML3D tool used by Risden et al. [18] would be desirable. The Walrus viewer and the conversion tool are a step towards this goal.
Availability and requirements
Project name: Walrus and phylo3D (Walrus phylogenetic tree conversion tool)
Project home page: http://www.caida.org/tools/visualization/walrus/ and http://www.ii.uib.no/~tim, respectively
Operating systems: Windows, Linux and Mac OS X operating systems
Programming language: Java
Other requirements: Java3D 1.2.1 (or later), JDK 1.3.0 (or later), a hardware-accelerated graphics card with OpenGL, computer memory of 128 MB, 512 MB required for a few thousand nodes.
License:none for phylo3D
Any restrictions to use by non-academics: none for phylo3D
List of abbreviations
2D: two dimensional
3D: three dimensional
Authors' contributions
TH was responsible for the orignal tree viewer conceptualization, the programming of the conversion tool, wrote the first draft of the paper, and served as the main driving force in the generation of this tool. YH was responsible for the Walrus viewer. DAL contributed to the functionality of the conversion tool, supervised the project, and wrote subsequent drafts of the paper and revisions.
Acknowledgments
Acknowledgments
Funding for this project came from FUGE, the Norwegian functional genomics platform of the national research council.
Contributor Information
Timothy Hughes, Email: tim@ii.uib.no.
Young Hyun, Email: youngh@caida.org.
David A Liberles, Email: liberles@cbu.uib.no.
References
- Pennisi E. Modernizing the tree of life. Science. 2003;300:1692–1697. doi: 10.1126/science.300.5626.1692. [DOI] [PubMed] [Google Scholar]
- Liberles DA, Schreiber DR, Govindarajan S, Chamberlin SG, Benner SA. The Adaptive Evolution Database (TAED) Genome Biology. 2001;2:research0028.1–0028.6. doi: 10.1186/gb-2001-2-8-research0028. [DOI] [PMC free article] [PubMed] [Google Scholar]
- Eisen JA, Fraser CM. Phylogenomics: Intersections of genomics and evolution. Science. Science. 2003;300:1706–1707. doi: 10.1126/science.1086292. [DOI] [PubMed] [Google Scholar]
- Page RDM. Treeview: An application to display phylogenetic trees on personal computers. CABIOS. 1996;12:357–358. doi: 10.1093/bioinformatics/12.4.357. [DOI] [PubMed] [Google Scholar]
- Zmasek CM, Eddy SR. ATV: Display and manipulation of annotated phylogenetic trees. Bioinformatics. 2001;17:383–384. doi: 10.1093/bioinformatics/17.4.383. [DOI] [PubMed] [Google Scholar]
- Bingham J, Sudarsanam S. Visualizing large hierarchical clusters in hyperbolic space. Bioinformatics. 2000;16:660–661. doi: 10.1093/bioinformatics/16.7.660. [DOI] [PubMed] [Google Scholar]
- Deep Green http://ucjeps.berkeley.edu/bryolab/GPphylo/hyper_trees.php
- Plaisant C, Grosjean J, Bederson BB. SpaceTree: Supporting exploration in large node link tree, design evolution and empirical evaluation. In: Wong PC, Andrews K, editor. In Proceedings of the 2002 IEEE Symposium on Information Visualization: 28–29 October, 2002; Boston, MA, USA. IEEE Computer Society; 2002. pp. 57–70. [Google Scholar]
- Rost U, Bornberg-Bauer E. TreeWiz: interactive exploration of huge trees. Bioinformatics. 2002;18:109–114. doi: 10.1093/bioinformatics/18.1.109. [DOI] [PubMed] [Google Scholar]
- Stolk B, Abdoelrahman F, Koning A, Wielinga P, Neefs JM, Stubbs A, de Bondt A, Leemans P, van der Spek P. In Fourth Eurographics Workshop on Parallel Graphics and Visualization: 9–10 September, 2002 Blaubeuren, Germany. Eurographics Digital Library; 2002. Mining the human genome using virtual reality; pp. 17–21. [Google Scholar]
- Ruths DA, Chen ES, Ellis L. Arbor3D: an interactive environment for examining phylogenetic and taxonomic trees in multiple dimensions. Bioinformatics. 2000;16:1003–1009. doi: 10.1093/bioinformatics/16.11.1003. [DOI] [PubMed] [Google Scholar]
- Munzner T. H3: Laying out large directed graphs in 3D hyperbolic space. In: Dill J, Gershon N, editor. In Proceedings of the 1997 IEEE Symposium on Information Visualization: 20–21 October, 1997; Pheonix, AZ, USA. IEEE Computer Society; 1997. pp. 2–10. [Google Scholar]
- Munzner T. Exploring large graphs in 3D hyperbolic space. IEEE Computer Graphics and Applications. 1998;18:18–23. doi: 10.1109/38.689657. [DOI] [Google Scholar]
- Munzner T. Drawing large graphs with H3 Viewer and Site Manager. Lecture Notes in Computer Science. 1998;1547:384–393. [Google Scholar]
- The LibSea Graph File Format and Java Graph Library http://www.caida.org/tools/visualization/libsea/
- Benson DA, Karsch-Mizrachi I, Lipman DJ, Ostell J, Wheeler DL. GenBank: Update. Nucleic Acids Research. 2004;32:D23–D26. doi: 10.1093/nar/gkh045. [DOI] [PMC free article] [PubMed] [Google Scholar]
- Glusman G, Yanai I, Rubin I, Lancet D. The complete human olfactory subgenome. Genome Research. 2001;11:685–702. doi: 10.1101/gr.171001. [DOI] [PubMed] [Google Scholar]
- Risden K, Czerwinski MP, Munzner T, Cook DB. An initial examination of ease of use for 2D and 3D information visualizations of web content. International Journal of Human-Computer Studies. 2000;53:695–714. doi: 10.1006/ijhc.2000.0413. [DOI] [Google Scholar]


