

Abstract
GABAergic inhibitory interneurons (IN) represent a heterogeneous population with different electrophysiological, morphological, and molecular properties. The correct balance between interneuronal subtypes is important for brain function and is impaired in several neurological and psychiatric disorders. Here we show the data of 123 molecularly and electrophysiologically characterized neurons of juvenile rat barrel cortex acute slices, 48 of which expressed Reelin (Reln). Reln mRNA was exclusively detected in Gad65/67-positive cells but was found in interneuronal subtypes in different proportions: all cells of the adapting-Somatostatin (SST) cluster expressed Reln, whereas 63% of the adapting-neuropeptide Y (NPY, 50% of the fast-spiking Parvalbumin (PVALB), and 27% of the adapting/bursting-Vasoactive Intestinal Peptide (VIP) cluster were Reln-positive. Silhouette analysis revealed a high impact of the parameter Reln on cluster quality. By analyzing the co-localization of RELN immunoreactivity with those of different IN-markers, we found that RELN is produced layer-independently in SST-, NPY-, and NOS1-expressing INs, whereas co-localization of RELN and VIP was mostly absent. Of note, RELN co-localized with PVALB, predominantly in INs of layers IV/V (>30%). Our findings emphasize RELN's role as an important IN-marker protein and provide a basis for the functional characterization of Reln-expressing INs and its role in the regulation of inhibitory IN networks.
Keywords: clustering, glutamate decarboxylase, neuropeptide Y, polythetic classification, somatosensory cortex
Introduction
The glycoprotein Reelin (RELN) is secreted by Cajal–Retzius neurons in the developing neocortex and plays a key role in cortical lamination during brain development (Caviness and Rakic 1978; Tissir and Goffinet 2003; D'Arcangelo 2006). After birth, RELN is mainly produced by a subset of GABAergic interneurons (INs) in the neocortex and hippocampus (Alcántara et al. 1998; Pesold et al. 1998). In the adult brain, RELN is involved in neurogenesis but also in the regulation of synaptic plasticity and dendritic spine development (Beffert et al. 2005; Herz and Chen 2006; Zhao et al. 2007; Förster et al. 2010; Pujadas et al. 2010), signaling through the lipoprotein receptors ApoER2 and VLDLR as well as through alternative receptors (Förster et al. 2010) through activation of non-receptor tyrosine kinases (Bock and Herz 2003). The amount of RELN is reduced in several psychiatric disorders (Impagnatiello et al. 1998; Fatemi et al. 2000; Guidotti et al. 2000), but the underlying mechanisms and functional consequences remain largely unclear.
GABAergic INs, which have been reported to comprise between 12% and 25% of all neocortical neurons (Ren et al. 1992; Beaulieu 1993; Meyer et al. 2011), can profoundly influence the excitatory network of large neuronal populations by their pacemaker behavior (Bennett and Zukin 2004; Cardin et al. 2009; Gentet 2012). To precisely control network function, a diverse population of INs is required. Hence, a loss of interneuronal subtypes and/or an imbalance of their activity or distribution is thought to be involved in the pathogenesis of neurological and psychiatric disorders including epilepsy, autism, bipolar disorder, major depression, schizophrenia, and Alzheimer disease (reviewed in Di Cristo 2007; Cossart 2011; Nakazawa et al. 2012; Palop and Mucke 2010). However, the existence of many diverse interneuronal subtypes poses a challenge for understanding their individual function in network activity in health and disease (Lewis et al. 2012; Marín 2012).
RELN-positive interneurons are widely distributed throughout the neocortex (Alcántara et al. 1998; Drakew et al. 1998; Pesold et al. 1998; Ramos-Moreno et al. 2006). In contrast to Parvalbumin (PVALB)- and Somatostatin (SST)- or Vasoactive Intestinal Peptide (VIP)-positive interneurons, whose sites of origin are either restricted to the medial or caudal ganglionic eminence (MGE/CGE, respectively), RELN-positive interneurons—comprising mainly cortical bitufted cells, Martinotti cells, neurogliaform and horizontal (in lamina I) cells (Pesold et al. 1999; Miyoshi et al. 2010)—arise from both the MGE and CGE (Miyoshi et al. 2010).
To define cortical interneurons in more detail, Karagiannis et al. (2009) classified a set of 200 interneurons in layers I–IV of rat somatosensory barrel cortex using multimodal information including laminar position, electrophysiological behavior, morphology, and neurochemical composition. Among the 10 molecular markers that were analyzed via single-cell RT-PCR (scRT-PCR), Reln was not included. Since a systematic characterization of individual Reln-expressing cortical interneurons is lacking, we have reanalyzed this sample set to include Reln as an additional neurochemical marker. Unsupervised clustering by Ward's method showed that Reln mRNA was exclusively detected in glutamic acid decarboxylase (GAD)-positive neurons, whereas it was excluded from glutamatergic neurons (expressing vesicular glutamate transporter 1 (vGlut1) but not Gad65 or Gad67) in layers I–IV. Silhouette analysis of all 44 parameters applied for the Ward's clustering algorithm demonstrated a significant loss of clustering quality when Reln as a molecular property was scrambled, underlining the relevance of Reln as a parameter for interneuron classification. To further validate our results based on scRT-PCR analysis of individual patch-clamped neurons, we comprehensively characterized the distribution of RELN-immunoreactive interneuron subtypes by double immunohistochemistry, confirming and extending previous reports on Reln expression in the adult rodent cortex. We could show that different RELN-immunoreactive subtypes are enriched in specific layers and that the intensity of RELN immunoreactivity differed among specific interneuron subtypes. Of note, and in contrast to previous reports, we found that a substantial proportion of lamina IV and V PVALB-positive interneurons are co-immunoreactive for RELN in the somatosensory barrel cortex.
Thus, inclusion of RELN as a marker to phenotype GABAergic interneuron subtypes presents an even more refined view of its layer- and cell type-specific expressions. This will guide future studies aiming at unraveling cellular and circuit functions of RELN-expressing cortical interneurons.
Materials and Methods
Reln RT-PCR
The procedure of whole-cell recording and scRT-PCR of neurons from acute rat (postnatal days 19 ± 2 SD) cortical slices has been described (Karagiannis et al. 2009). Briefly, after electrophysiological recording, the cytoplasmic content of single neurons was aspirated and used for reverse transcription in a final volume of 10 µL. The resulting cDNA was used for a multiplex PCR designed to detect 11 different molecular markers.
To achieve a highly sensitive and specific detection method for Reln cDNA from the multiplex PCR reaction, we developed a double-nested PCR for Reln. In addition, we designed a nested PCR for the detection of a housekeeping gene, β-actin (Actb) (primer sequences are listed in Supplementary Table 1). The Reln primers are located in the region that is deleted in the reeler mouse and covers multiple exons (see Supplementary Fig. 1). To establish the highly sensitive Reln PCR we used a reaction mixture containing 67 mM Tris (pH 8.8); 16.6 mM (NH4)2SO4; 6.7 mM MgCl2; 6.7 µM EDTA; 0.0348% β-mercaptoethanol; 10% DMSO; 0.1 mg/mL BSA; 1.25 mM dNTPs (each); 0.2 μL Taq polymerase; 400 nM primer (each); and template (final reaction volume 20 µL). Whole-brain cDNA was used as a template. The amount of template was calculated as follows: 2 µg RNA per 30 µL reaction volume used for reverse transcription mixture resulting in 70 ng/µL RNA reverse-transcribed into cDNA, diluted up to 70 fg/µL. The PCR started with 2 min at 94 °C, 2 min at 55 °C, and 3 min at 67 °C, followed by 40 cycles (94 °C for 30 s, 55 °C for 30 s, and 67 °C for 45 s) and a final elongation step of 10 min at 67 °C.
To detect Reln cDNA in the multiplex PCR samples containing the cDNA, we adapted the buffer solution previously used (Qiagen 10× PCR buffer) to our PCR conditions: For the first round of Reln PCR, the volume of the remaining original multiplex PCR samples (50 µL) was mixed with the same volume (50 µL) of an admixture containing 67 mM Tris (pH 8.8); 16.6 mM (NH4)2SO4; 11.7 mM MgCl2; 13.4 µM EDTA; 0.0696% β-mercaptoethanol; 20% DMSO; 0.2 mg/mL BSA; 2 mM dNTPs (each); 1 μL Taq polymerase; 400 nM primer (each), resulting in a total volume of 100 µL. The amplification was performed as described above (40 cycles). The following nested Reln PCRs were performed using 1 µL of the preceding amplification steps in a final volume of 20 µL.
To demonstrate cDNA stability in the multiplex PCR samples, Actb was also detected. As the first Reln PCR showed better results when the first Actb PCR was done subsequently, we reanalyzed the multiplex PCR samples by supplementing Actb primers (100 nM final concentration) and fresh Taq (1 µL). Forty PCR cycles were performed as described above (with an annealing temperature of 60 °C instead of 55 °C). For the nested Actb PCR 1 µL of the first Actb PCR reaction was used as template in a final volume of 20 µL. PCR products were visualized by separation on a 1% agarose gel and staining with ethidium bromide.
Ward's Clustering and Silhouette Analysis
Of the 200 cortical neurons that were originally analyzed, only cells that were positive for Reln and/or Actb were further considered (n = 123). In addition to the expression of Reln 43 parameters including 10 molecular markers (Vglut1, Gad65, and/or Gad67, Pvalb, Sst, Vip, Npy, Nos1, Calretinin (Calr), Calbindin (Calb), and Cholecystokinin (Cck)), the laminar location of the soma, and 32 electrophysiological properties (Karagiannis et al. 2009: adopting Petilla terminology, Ascoli et al. 2008) were used for reclustering using Ward's (1963) method. Neurons positive for Gad65 and/or Gad67 were denoted as Gad-positive and considered as a single molecular variable (Gallopin et al. 2006). After standardizing the 44 parameters (including Reln) by centering and reducing all of the values of the 123 neurons, the cluster analysis was performed (Ward's method) as previously described (Karagiannis et al. 2009; Perrenoud et al. 2012) using Statistica 6 software (Statsoft, Tulsa, OK, USA). Results of the Ward-clustering were visualized with a dendrogram. However, a drawback of Ward's method is that misassigned cells are not corrected during the iterative process. Clusters generated with Ward's method were thus corrected using the K-means algorithm (MacQueen 1967; Hartigan and Wong 1979) by using Matlab software (MathWorks) as previously described (Perrenoud et al. 2012). To quantitatively assess the quality of different clustering algorithms, silhouette analysis (Rousseeuw 1987) of the K-means clustering was performed. The overall silhouette width (SC123), which is defined as the average of silhouette values (S, here 123 neurons) over the whole dataset (n = 123 neurons), is used as global measure of quality of a possible clustering. The impact of a single parameter, like expression of Reln mRNA, on SC123 was determined as follows: individual parameters were randomized and SC123-parameters of the resulting clusters were recomputed. Thus, a decrease of the mean silhouette value of the cells following randomization was interpreted as a lower quality of clustering. Loss of cluster quality was expressed as: 100–100 × (SC123-parameter/SC213) (in percent).
Perfusion of Animals and Vibratome Sections
Wistar rats (P21-P28) were deeply anesthetized with ketamine and intracardially perfused, first with 0.9% saline solution (50 mL) followed by 150–200 mL fixative (4% paraformaldehyde (PFA) in 100 mM phosphate buffer (PB) pH 7.4 containing 15% v/v saturated picric acid, dissolved in distilled water). Brains were removed and postfixed for 4 h in the same fixative. After several washes with PB the brains were cut on a Leica VT 1000S vibratome (Leica, Wetzlar, Germany), the nominal section thickness was set to 50 µm. Sections were thoroughly washed with PB before double immunohistochemistry was performed.
Double Immunohistochemistry
After washing twice in 50 mM Tris (pH 7.6), followed by TBS (Tris buffered Saline: 50 mM Tris, 150 mM NaCl, pH 7.6) and permeabilization in TBST (TBS, 0.3% Triton X) slices were blocked for 40 min with 10% normal goat serum in TBST. Primary antibodies diluted in TBST were incubated for 72 h at 4 °C. The following antibodies were used: RELN (G10 mouse monoclonal, Millipore, 1 : 10 000), in conjunction with PVALB (rabbit, Swant, 1 : 5000), SST (rabbit, Peninsula Laboratories, 1 : 5000), VIP (rabbit polyclonal, DiaSorin, 1 : 2000), neuropeptide Y (NPY) (rabbit, ImmunoStar, 1 : 1000), NOS1 (rabbit, Upstate Biotechnology, 1 : 4000), or CALR (rabbit, Swant, 1 : 10 000) antibodies. The slices were subsequently washed 4× 15 min with TBST and incubated with secondary antibodies (anti-mouse IgG coupled to Alexa594 and anti-rabbit IgG coupled to Alexa488, each 1 : 500 in TBST; Invitrogen) for 2 h at room temperature. After extensive washing (2× 15 min with TBST, 1× 15 min with DAPI 1 : 10 000 in TBST, 2× 15 min with TBST, 1× 15 min with TBS, 2× 15 min with 50 mM Tris, pH 7.6), the slices were mounted with Aqua-Poly/Mount (Polysciences, Inc.). Barrel columns of the somatosensory cortex were imaged as z-stacks, using a Zeiss Axioplan 2 microscope with an ApoTome module for optical sectioning. Cuboidal volumes (900 µm in length along cortical surface; 1700 µm depth from pial to white matter; 50 µm thickness of slice) of n = 6 hemispheres of 3 rat brains were recorded. Three adjacent z-stacks (10× objective) were necessary to cover the area extending from the pia to the white matter. The immunolabeled cells and their spatial positions in z-stacks were registered with Neurolucida 8.0 (MBF Biosciences); raw data were extracted with Neurolucida Explorer (MBF Biosciences) and further processed with Excel (Microsoft Office) software. After normalization of the cortical thickness (see Supplementary Fig. 5), the number, rate of co-localization, and laminar localization of the labeled neurons were determined. To present columns in their entire depth, z-stacks were computed to generate extended focus images using Axiovision software (Zeiss) and aligned using Photoshop CS4 (Adobe). The determination of laminar borders is described in Supplementary Figure 5 and text.
Results
Development of a Highly Sensitive and Specific RT-PCR for the Detection of Reln mRNA
Although RELN is a well-established marker for a subset of different cortical interneurons, detailed information on the neurochemical, electrophysiological and morphological properties of individual RELN-positive interneurons is not available. To address this issue, we checked whether a particularly well-characterized dataset of patch-clamped neurons from the rat barrel cortex (Karagiannis et al. 2009) could be reanalyzed for Reln expression. Since different factors might affect the stability of the cDNA within the RT reaction mixture of the 197 individual neurons that were still available, a highly sensitive double-nested PCR for the detection of Reln was designed (Supplementary Fig. 1). We chose a region of the Reln transcript for amplification that covers several exons to exclude the amplification of genomic DNA. Furthermore, the primer pairs were designed to amplify part of the region within the Reln gene that is deleted in the spontaneous mouse mutant reeler. As the scRT-PCR samples contained rat cDNA, primers matching 100% between the respective rat and mouse sequences were chosen, which allowed us to use reeler cDNA as a negative control. The double-nested PCR consisting of 3 successive PCR reactions for the amplification of potential low copy Reln signals in the RT reaction mixtures is schematically depicted in Supplementary Figure 1.
The second PCR was sensitive enough to detect Reln cDNA transcribed from 7 pg of rat whole brain mRNA. No signal was detected in reeler cDNA (Supplementary Fig. 1) or genomic DNA (not shown). The estimated total amount of Reln mRNA is 220 amol per µg rat cortex RNA (Pesold et al. 1998), that is, 1.32 × 10⁸ transcripts of Reln mRNA/µg RNA (220 × 10−18 mol × 6 × 1023 particles/mol). This corresponds to a low copy number of Reln mRNA per 7 pg of cortex cDNA (1.32 × 10⁸ transcripts/µg = 924 transcripts/7 pg). Hence, the double-nested PCR described is sensitive and specific enough to theoretically detect <0.002 amol (7 × 10–6 µg × 220 × 10–18 mol/µg = 1.54 × 10⁻²¹ mol) of Reln transcript.
Detection of Reln Transcripts in Patch-Clamped Interneurons
The scRT-PCR material of a set of 197 well-characterized neurons (Karagiannis et al. 2009, Supplementary Fig. 2A) of the rat barrel cortex was reanalyzed to detect Reln-expressing cells using the highly sensitive and specific double-nested PCR described above (Supplementary Fig. 2B). In 48 of 197 reanalyzed cells Reln cDNA was detected, shown for the first 24 of 197 samples in Supplementary Figure 3A. The second Reln PCR was sufficient to detect most of the signals; in 4 of 48 Reln-positive samples the third PCR was necessary to detect the signal (Supplementary Fig. 3B). To exclude false Reln-negative cells from our analysis, all samples were also tested for Actb expression (Supplementary Fig. 2C). The results of the first 24 samples of the second Actb PCR are shown exemplarily in Supplementary Figure 3A. With the information that cDNA quality was sufficient, it was possible to reanalyze 123 cells, which included 48 cells that were positive for Reln. All Reln-positive cells co-expressed Gad, 63% (30 of 48) were positive for Npy, 42% (20 of 48) expressed Calb, 35% (17 of 48) Pvalb, 29% (14 of 48) Sst, 21% (10 of 48) Calr, 15% (7 of 48) Nos1, 10% (5 of 48) Vip, and only 4% co-expressed (2 of 48) Cck. Several lines of evidence support the accuracy of the data: 1) Reln was only detected in Gad-positive neurons, 2) the observed positive correlation of Reln with Sst, Npy, Nos1, Calr, and Calb expression and a negative correlation with Vip and Cck are in agreement with published co-expression data (Alcántara et al. 1998; Pesold et al. 1999; Miyoshi et al. 2010), 3) a valid negative control (reeler cDNA) makes false-positive signals highly unlikely (Supplementary Fig. 1). Most of the Reln-positive cells showed an adapting (76%, 35 of 48 Reln-positive cells) or fast-spiking (17%, 8 of 48) firing pattern, the remaining 7% being either late-spiking (3 of 48) or bursting (2 of 48) cells (Figs 1 and 2). Reln-positive cells never showed an excitatory regular-spiking or intrinsically bursting firing pattern defined by shared long duration action potentials and pronounced frequency adaptations (McCormick et al. 1985).
Figure 1.

Cluster analysis of the 123 neurons. (A) Branching diagram, the cells are sorted by their cluster affiliation (x-axis = individual cells, y-axis = average Euclidian within-cluster linkage distance). Reln expression is illustrated in single-cell resolution by the anthracite gray colored barcode, anthracite gray rectangles = Reln-positive cells. Each neuron is represented by a small rectangle. (B) The neurons are classified into 5 clusters (in black, red, green, blue, and orange). The pie charts illustrate the percentage of Reln-expressing cells for each cluster. Expression of the most discriminating neurochemical markers is denoted as percentages above each cluster. (C) The color code for the predominant firing patterns (illustrative examples are labeled with an * in the bars representing the respective cells) is annotated in the lower panel (IB, intrinsically bursting, RS, regular-spiking, adapting, RSNP, regular-spiking nonpyramidal, FS, fast-spiking, LS, late-spiking (delayed/accelerating).
Figure 2.

Neurochemical, electrophysiological anatomical properties of the clustered cells, sorted by Reln expression. Alignment of cluster affiliation and different parameters (firing pattern and IN-marker expression) of 123 cells (A). Small rectangles represent the 123 single cells, sorted by Reln expression (anthracite) and cluster affiliation. Color code of Cluster ID: red = fast-spiking PVALB, green = adapting SST, blue = adapting/bursting VIP, and orange = adapting neuropeptide Y (NPY). Color code for firing pattern: gray = adapting [RSNP], light orange = fast-spiking [FS], light green = bursting, lilac = delayed/accelerating [LS], pink = regular-spiking, turquoise = intrinsically bursting. To highlight the correlation of IN-markers and cluster affiliation, the clusters are framed in their corresponding colors. (B–D) Correlation of Reln expression with anatomical parameters. All 123 cells are sorted according to their layering (B), morphology (C, sp.st. = spiny stellate), or average cell diameter (D).
Reclustering Results in 4 GABAergic Higher-Order Clusters
Reclustering of the 123 neurons according to Ward's method (Ward 1963) with Reln expression as an additional parameter resulted in 4 clusters of 92 GABAergic interneurons (Fig. 1A,B). Reln is expressed in 52% (48 of 92) of GABAergic interneurons and is represented in these clusters in different proportions (Fig. 1B, pie charts). Strikingly, the adapting-SST cluster exclusively consists of Reln-positive cells (n = 10; 100%). Twenty-seven percent of the cells belonging to the adapting/bursting-VIP cluster and an unexpectedly high amount of 50% of fast-spiking PVALB cells expressed Reln. Similarly, the adapting-NPY neurons expressed Reln in high numbers (63%) as well. Neurons of the glutamatergic cluster showed no Reln expression. Other characteristic parameters like expression of different IN-markers and firing pattern are listed in Figures 1B,C and 2A. In Figure 2A, the cells, which are represented as colored bars, are sorted by Reln expression (third line, anthracite = positive; white = negative) and cluster affiliation.
Quality of Clustering and Relevance of Reln for Interneuron Classification
The quality of the reclustering analysis with the inclusion of Reln as additional parameter was evaluated by determining the silhouette width (SC123, by K-means clustering) of the clustering. The full polythetic clustering over the 123 reclustered neurons including all 44 parameters resulted in an overall silhouette width of SC123 = 0.242. To determine the impact of individual parameters on SC213, SC123-parameter was calculated after randomizing single parameters. Loss of quality is expressed in percent (100 – 100 × SC123–parameter/SC123). The parameter with the highest impact on silhouette width was the neurochemical marker Sst. Scrambling Sst values resulted in SC123-Vip = 0.213, indicating a quality loss by 12.1%. By ranking all 44 parameters according to their impact on SC123 Reln was at the seventh position (SC123-Reln = 0.229, loss of quality 5.2%, see Supplementary Fig. 4A). The silhouette plot (Supplementary Fig. 4C) illustrates the compactness of each singular cluster.
Co-Expression of Reln with Neurochemical IN-Markers
The simultaneous detection of multiple neurochemical markers in individual patch-clamped neurons allowed us to examine the co-expression of Reln and additional IN-markers with single-cell resolution (Fig. 2A) and to correlate the neurochemical profile of Reln-positive interneurons with their firing behavior and morphology.
Thirty-one of 48 Reln-positive cells (65%) co-expressed Npy. Twenty cells expressed Calb (42%), 17 Pvalb (35%), 14 Sst (29%), 10 Calr (21%), 7 Nos1 (15%), 5 Vip (10%), and 2 Cck (4%). Of the Sst plus Reln-positive cells (14 in total), 11 (79%) also expressed Calb, whereas 59% of all Pvalb plus Reln (10 of 17) and 33% of Npy plus Reln (10 of 30) positive cells co-expressed Calb. Calb was absent in Vip plus Reln-positive cells, whereas Calr was detected in 4 of these 5 cells. In summary, Reln-positive cells can be sorted into 4 groups with regard to the co-expression of IN-markers: 1) Calb- plus Pvalb-positive, 2) Calb- plus Sst-positive, 3) Calr- plus Vip-positive, 4) Npy-positive but Calr- and Calb-negative (for detailed information on the IN-marker composition of single cells, see Fig. 2A).
Correlation of Reln with Action Potential Firing Behavior, Morphology, Cell Diameter and Laminar Position
Most Reln-expressing cells showed an adapting-spiking firing behavior, the second most common firing behavior was fast-spiking (Fig. 2A). Only 2 interneurons were bursting. Three cells (of 5 late-spiking cells in total) showed a late-spiking firing behavior and belonged to the adapting-NPY cluster, possibly representing neurogliaform interneurons. This interneuron subtype is known to express Reln and Npy and to show a late-spiking firing pattern (Miyoshi et al. 2010; Wierenga et al. 2010; Armstrong et al. 2012). Figure 2B–D correlates Reln expression with different properties like laminar position, morphology, and average cell diameter. Reln-positive neurons were found in all layers included in this study (Fig. 2B). Most Reln-expressing cells had a bipolar or multipolar morphology (Fig. 2C). On average, Reln-expressing cells (Fig. 2D) had a larger diameter compared with Reln-negative cells: 15 of 65 cells (23%) with a diameter <14 µm expressed Reln, but 33 of 58 cells (57%) with a diameter larger than 14 µm expressed Reln. Thirty-one percent (15 of 48) of Reln-positive cells had a diameter smaller as opposed to 69% (33 of 48) larger than 14 µm.
Double Immunohistochemistry of RELN with 6 Different IN-Markers in the Rat Somatosensory Barrel Cortex
To 1) confirm and extend the data obtained in the single-cell study, which allowed us to correlate Reln co-expression with other neurochemical markers on the transcript level as well as with electrophysiological and morphological data, and to 2) get detailed information about the layer-specific distribution of RELN-positive cells in the somatosensory barrel cortex, we performed a quantitative immunohistochemical analysis, including infragranular layers V and VI. Figure 3A shows a section double-labeled for RELN and SST, spanning from the pial surface to the white matter. In total, by examining 6 hemispheres altogether, a volume of 0.46 mm3 (0.9 mm × 1.7 mm × 0.05 mm × 6 hemispheres) was analyzed for each IN-marker (PVALB, SST, VIP, NPY, NOS1, CALR) double-labeled with RELN. For each marker, double-labeling with RELN is shown exemplarily in a region within layer II/III (Fig. 3B). While the RELN signal was intense among NOS1-RELN, NPY-RELN, and SST-RELN double-labeled neurons in most cases, it was considerably weaker in a portion of CALR-RELN double-labeled cells, especially in the superficial layers. In PVALB-RELN double-labeled neurons, RELN immunoreactivity was generally weak (Fig. 4A), whereas in VIP-positive cells a RELN signal was virtually absent (Fig. 4B), as has been described previously (Alcántara et al. 1998; Pesold et al. 1999; Miyoshi et al. 2010).
Figure 3.

Detection of RELN and IN-marker co-localization by double immunohistochemistry. (A) Part of a rat barrel cortex column from pia (top) to white matter (bottom), showing RELN (red)- and SST (green)-immunostained cells. (B) Double-immunolabeling of all 6 analyzed IN-markers with RELN, exemplarily shown are regions of layer II/III. Arrows indicate cells double-labeled for RELN and IN-marker, arrowheads mark cells labeled only for IN-marker, SST-labeled cells are all positive for RELN and unmarked. SST-, NPY-, NOS1-, and CALR-positive cells shown are all immunoreactive for RELN. PVALB- and VIP-positive cells shown are not immunoreactive for RELN.
Figure 4.
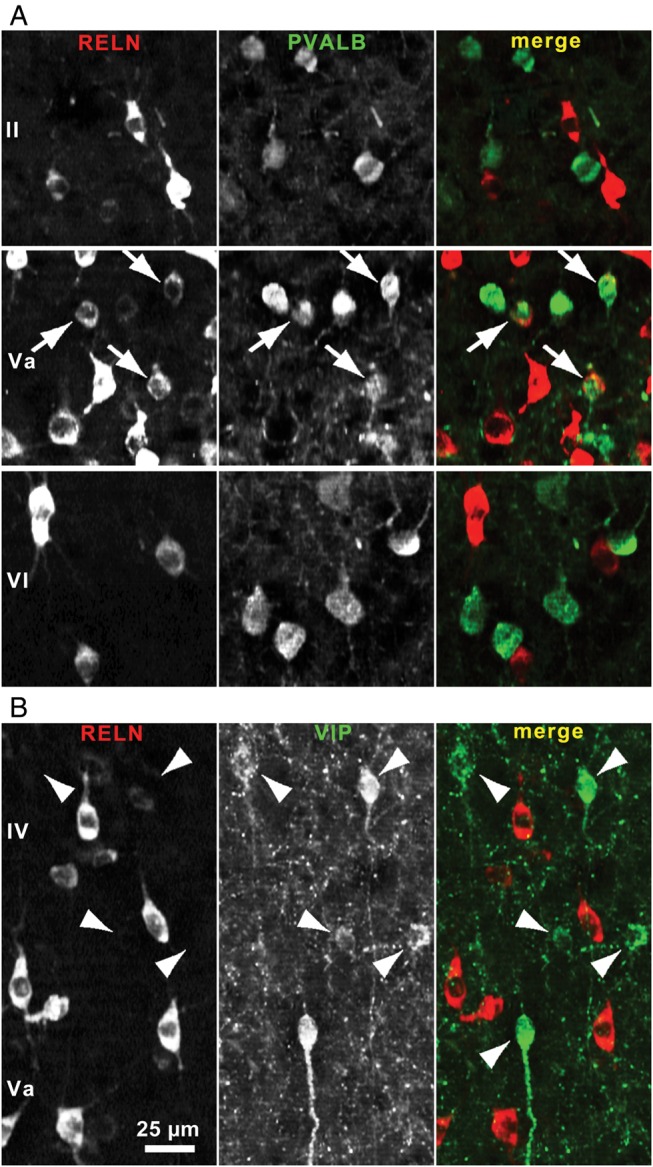
RELN/IN-marker co-localization varied between cortical layers. (A) Image sections of lamina II and lamina VI showing PVALB-positive cells (green) not immunoreactive for RELN (red) and a region in lamina Va showing several double-labeled cells with a weak RELN signal (arrows). (B) In contrast VIP-immunoreactive cells of layers IV and Va lack a RELN signal (arrowheads).
Statistical Analysis of RELN and IN-Marker Double-Labeled Neurons
The number of cells labeled for RELN, the respective IN-markers, and double-labeled cells were determined for all layers in column-like strips of tissue of 6 hemispheres. Figure 5A shows the percentage of RELN, IN-marker or double-labeled cells for the different markers. The highest percentage of co-localization was seen for NOS1: 89.5% (± 8.6%) of NOS1-immunoreactive cells were also labeled for RELN. SST and NPY-positive cells were also double-labeled for RELN at high percentages (79.8 ± 3.5% SD and 56.2 ± 5.6%, respectively). A lower degree of co-localization with RELN was observed for CALR- (35.3 ± 9.1%) and PVALB- (20.8 ± 2.2%) positive cells. Of note, the vast majority (419 of 422) of VIP-positive cells was not immunoreactive for RELN (0.7 ± 1.3% double-labeled cells), (see also Table 1). The correlation of double-labeling of RELN with IN-markers is visualized in a scatter plot diagram (Fig. 5B) where the number of RELN plus IN-marker-positive cells (y-axis) is plotted against the number of all IN-marker-labeled cells (x-axis). Each data point represents the results from one cortical column-like stripe. The closer the data point is located to the line of equality (where x = y), the higher is the rate of co-localization (e.g., highest co-localization was found for NOS1-RELN). The data points of different double-labeling experiments with RELN are tightly clustered around a mean value, except for the PVALB-RELN double immunoreactivity. Owing to a variable penetration depth of the PVALB antibody, the number of PVALB-labeled cells for each column varied, whereas the number of RELN-labeled cells was approximately the same. Therefore, the proportion of PVALB to RELN-double-immunoreactive cells depended on the number of PVALB-labeled cells, and the results are thus scattered along a straight line as a function of the number of labeled PVALB cells, with the constant proportion indicating a coherent dataset for this IN-marker as well.
Figure 5.

Quantitative analysis of RELN and IN-marker double immunohistochemistry. (A) Proportion of different IN-markers co-localizing with RELN. The amount of cells that are immunoreactive either for RELN, IN-marker, or both are depicted as a percentage of total number of counted cells of layers I–VI (n = 6 columns). (B) Correlation of the total number of IN-marker-labeled cells and cells double-immunoreactive for RELN of 6 individual cortical columns (1 symbol represents 1 cortical column including layers I–VI). (C) Percentage of Reln expression in PVALB-, SST-, VIP-, NPY-, NOS1-, and CALR-positive neurons, white bars = results of double immunohistochemistry (IHC, layers I–IV), with standard deviation, gray bars = results of scRT-PCR, fractions indicating Reln-positive/marker-positive of 123 cells.
Table 1:
Co-labeling of RELN and IN-markers as revealed by quantitative immunohistochemistry
| Layers I–VI | CALR | NOS1 | NPY | PVALB | SST | VIP |
|---|---|---|---|---|---|---|
| Ø cells/column | ||||||
| RELN-pos | 483.5 | 526.2 | 453 | 512.7 | 502.5 | 497.2 |
| IN-marker-pos | 57.2 | 13.8 | 37 | 185.5 | 179.5 | 70.3 |
| 2×-immunoreactive | 20.5 | 12.2 | 20.5 | 39.2 | 143.2 | 0.5 |
| % of 2×-ir | ||||||
| IN–marker/RELN | 4.2 ± 1.6 | 2.3 ± 0.4 | 4.5 ± 0.6 | 7.8 ± 2.7 | 28.6 ± 1.9 | 0.1 ± 0.2 |
| RELN/IN–marker | 35.3 ± 9.1 | 89.5 ± 8.6 | 56.2 ± 5.6 | 20.8 ± 2.24 | 79.8 ± 3.5 | 0.7 ± 1.3 |
| prop IN-marker:RELN | 11.9 ± 2.7 | 2.6 ± 0.6 | 8.2 ± 1.4 | 36.8 ± 9.7 | 35.9 ± 2.6 | 14.7 ± 4.3 |
| Ø cells/column | ||||||
| RELN-pos | 191.5 | 196 | 176.8 | 183.3 | 178 | 181.7 |
| IN-marker-pos | 22.7 | 4.2 | 15.2 | 73.7 | 51.5 | 36.5 |
| 2×-immunoreactive | 13.5 | 3.8 | 7.8 | 18.2 | 40.3 | 0.3 |
| % of 2×-ir | ||||||
| IN–marker/RELN | 7.0 ± 3.2 | 2.0 ± 1.0 | 4.5 ± 1.3 | 9.7 ± 4.6 | 23.8 ± 9.4 | 0.2 ± 0.3 |
| RELN/IN–marker | 59.0 ± 14.4 | 94.8 ± 8.0 | 52.0 ± 8.1 | 23.3 ± 7.0 | 77.6 ± 9.6 | 0.9 ± 1.4 |
| prop IN-marker:RELN | 11.8 ± 3.6 | 2.2 ± 1.2 | 8.7 ± 2.2 | 40 ± 10.5 | 30.2 ± 8.4 | 20.4 ± 5.7 |
Note: Standard deviation is denoted with ±; Ø, average number of; 2×-ir = double immunoreactivity; pos, positive; prop, proportion.
Comparison Between Double Immunohistochemistry and scRT-PCR Results
For a better comparability of immunohistochemical and single-cell data, only the immunohistochemical results for layers I to IV were included, disregarding layers V and VI (Fig. 5C and Table 1), since the scRT-PCR results were based on cells selected exclusively from these layers (Karagiannis et al. 2009).
The scRT-PCR co-expression results are comparable to the immunohistochemical co-localization results for Pvalb, Sst, Npy, and Calr (Fig. 5C). In both datasets, Nos1-positive cells showed a RELN signal in high percentages, but co-localization was higher for immunohistochemistry. In case of VIP and RELN, double immunoreactivity was rarely detected but some Vip-positive cells of the patch-clamped neurons showed a Reln signal.
Laminar Distribution of RELN and IN-Marker Double-Labeled Neurons
RELN-expressing cells showed the highest density throughout layer V (including layers Va and Vb). Small cells with a soma diameter up to 10 µm were enriched in lamina Va but were also consistently found in all other layers. Larger cells (15–20 µm) were almost exclusively found in layer Vb (Fig. 6B). Many of these RELN-immunoreactive cells did not co-express any of the analyzed IN-markers, and some displayed morphology reminiscent of pyramidal neurons with RELN-labeled apical dendrites (Fig. 7A). Of note, we found horizontally orientated RELN-positive neurons in layer I with an ovoid soma and horizontal dendrites, some of them being immunoreactive for CALR (Fig. 7B). In total, 2 CALR + RELN-positive and 5 RELN-positive cells were found in a lamina I volume of 0.024 mm3. These cells are likely to be Cajal–Retzius cells, but we cannot exclude that at least some of them are GABAergic interneurons because previous studies have shown that different types of GABAergic neurons express RELN in the postnatal period (Pesold et al. 1999; Ramos-Moreno et al. 2006).
Figure 6.

Distribution of cells labeled by different IN-markers and/or RELN. (A) Total number (y-axis) of RELN or IN-marker stained cells (x-axis) from layers I–VI of all 6 analyzed hemispheres (total cortical volume was 0.46 mm3). In case of RELN, the average (Ø) of all 6 double-immunostainings was calculated. (B) Distribution of RELN stained cells per depth and cell diameter (smallest diameter). (C) Distribution of cells expressing either IN-marker alone (gray) or co-expressing marker and RELN (black, co-loc.) by depth. B + C: x-axis, 1–17 means distance from pial surface (0) to white matter (17) in 100 µm units, y-axis shows number of cells/mm3. Vertical alternating gray and white stripes demonstrate layers I–VI, the border-separating lamina V in Va and Vb is indicated with dashed lines. For exact borders, see Supplementary Material (text).
Figure 7.
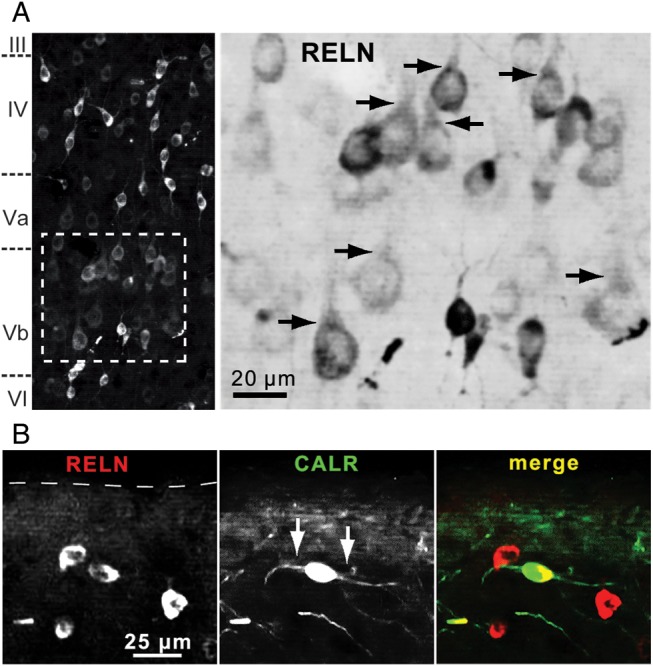
RELN-positive cells in lamina V and the marginal zone. (A) RELN-positive cells in lamina Vb. Some RELN-immunoreactive neurons with somata ≥15 µm and RELN-positive apical dendrites (arrows) show morphology reminiscent of pyramidal cells. As the immunoreactivity of RELN-positive, principal neurons is less intense, the magnified region is shown inverted to better visualize the apical dendritic structure. (B) RELN (red) and CALR (green) co-immunoreactive cell in layer I. A few lamina I cells showed a typical Cajal–Retzius cell morphology. One cell with horizontal dendrites (arrows, middle panel) and distance of about 50 µm from pial surface is exemplarily shown here.
The total amount of cells immunoreactive for each marker is shown in a bar diagram in Figure 6A. In Figure 6C, the distribution of cells immunoreactive for the different IN-markers as well as those that are also double-labeled for RELN is shown. In the case of SST, NPY, and NOS1 the distribution of double-labeled cells followed mostly that of IN-marker-labeled cells. Whereas the distribution pattern of NPY single and double-labeled cells was similar, there was a conspicuous alternation between the distribution of RELN/NPY-positive cells across layers. In the superficial part of lamina VI, where the amount of RELN-positive cells declined and that of NPY-immunoreactive cells increased, the proportion of double-labeled cells was highest. The highest co-localization of RELN and PVALB was found in layer IV and Va (36% and 30%, respectively), whereas it was much lower in layers I–III and VI (14% and 7%, respectively). For CALR the proportion of double-labeled cells was higher in the supragranular layers and in lamina Vb adjacent to lamina VI and underwent a gradient from nearly complete co-localization near the pial surface to no co-localization close to the white matter (100% in lamina I, 60% in lamina II/III, 50% in lamina IV, 28% in lamina V, 12% in lamina VI).
Discussion
RELN has recently gained a new impetus as an important parameter for interneuron subtype identification (e.g., Miyoshi et al. 2010; Wierenga et al. 2010; Tricoire et al. 2011). By using RELN together with 3 other well-established IN-markers, a large majority of cortical interneurons could be assigned to 4 nonoverlapping subgroups: MGE-derived 1) PVALB- and 2) SST-positive cells and CGE-derived 3) VIP-positive, and 4) RELN-positive but SST-negative cells (Miyoshi et al. 2010). Furthermore, Reln was also among the distinct features of a novel classification attempt which, in an in situ hybridization study, used ionotropic serotonin receptor 5HT3a-expression as a unifying feature of all non-Pvalb, non-Sst-expressing interneurons (Rudy et al. 2011). Such a reliable classification scheme is considered to be essential to study cortical interneurons in a meaningful manner (Ascoli et al. 2008). We here extend our knowledge on the expression of Reln to the single-cell level, which has not been analyzed before in such a large multimodal dataset as that described here. It comprises a multitude of 43 additional molecular, electrophysiological, and morphological parameters of single neurons in the somatosensory barrel cortex, a major cortical model system to study the development of neurons and their assembly into functional circuits (Feldmeyer et al. 2012).
Classification of 123 Interneurons Shows Reln-Expressing Cells Highly Enriched in Specific Subclusters
A highly sensitive double-nested Reln PCR allowed us to detect Reln in 48 of 123 multimodally characterized single neurons. All 48 Reln-positive cells were GABAergic and accounted for 52% of all Gad-positive (92) neurons. This is in agreement with previous published data, where at least two-thirds of all RELN-positive neocortical cells were GABAergic, and more than half of the GABArgic interneurons were reported to express Reln (Pesold et al. 1998; Ramos-Moreno et al. 2006).
So far, the contribution of Reln expression to the physiological properties of different interneurons is ill characterized. Reclustering of the individual patch-clamped neurons resulted in a slightly changed dendrogram when compared with the original analysis by Karagiannis et al. (2009). This suggests that Reln fits well into the original hierarchical clustering tree and that it is expressed in special neuronal subgroups, not randomly. The proportion of Reln-positive cells differed strongly between different clusters. Glutamatergic cells never showed a Reln signal, again underlining the validity of the Reln PCR results. This does not contradict the finding that Reln is also expressed by principal neurons (Pesold et al. 1999, Ramos-Moreno et al. 2006; see also our Figure 7A), because RELN-immunoreactive pyramidal neurons are largely confined to layer Vb, which was not included in the single-cell samples (Karagiannis et al. 2009). Remarkably, all cells belonging to the adapting-SST cluster expressed Reln. The adapting-VIP and bursting-VIP clusters described in Karagiannis et al. (2009) merged into a single adapting/bursting-VIP higher-order cluster, where 27% of the cells expressed Reln. Furthermore, silhouette analysis revealed that inclusion of Reln as a parameter highly contributed to cluster quality. Scrambling the Reln parameter resulted in a loss of cluster quality of 5.5%, assigning Reln the seventh highest rank from all 44 parameters included for cluster reanalysis.
Comparison of Single-Cell Data With Double Immunohistochemistry
Remarkably, we found a significant degree of co-expression of Pvalb and Reln transcripts in the 123 cells accessible for reanalysis. However, it is a widespread assumption that co-localization of PVALB and RELN, as examined by immunohistochemistry or in situ hybridization in mouse or rat, is absent or rare (Alcántara et al. 1998; Pesold et al. 1999; Miyoshi et al. 2010). In contrast, our scRT-PCR data showed that 33% of Pvalb-positive cells also were Reln-positive (17 of 51 cells).
To confirm our results we performed a quantitative double-immunohistochemical analysis, examining the co-localization of RELN with PVALB, but also SST, VIP, NPY, NOS1, or CALR by counting immunoreactive cells in column-like stripes of 6 different hemispheres of the rat somatosensory barrel cortex. As the cells of the single-cell study were selected from laminae I to IV, we considered also only these layers in the immunohistochemical analysis for the direct comparison between both methods.
Within layers I–IV, the proportion of PVALB-immunoreactive cells positive for RELN was high (25%), in line with the single-cell data. Most of the double-labeled cells were weakly positive for RELN (Fig. 4A). The observed discrepancy to the above-mentioned studies could be attributable to species differences, or methodological issues. For example, Pesold et al. (1999) used co-immunogold labeling, whereas in the study of Alcántara et al. (1998) RELN detection was based on in situ hybridization, and Miyoshi et al. (2010) used the CR-50 antibody directed against native RELN, which is less sensitive in formalin-fixed tissue than the antibody used in the present study. On the other hand, the discrepancy could also arise from area-specific differences, as Pesold et al. (1998) studied the frontal cortex and hippocampus. In the entorhinal cortex, a high proportion of excitatory neurons in the supragranular layers were found to express RELN (Chin et al. 2007; Varga et al. 2010).
Alternatively, it could be argued that part of the weak RELN immunoreactivity represents receptor-bound rather than endogenously produced RELN (Campo et al. 2009). However, since scRT-PCR detected a similar percentage of Reln-positive Pvalb-expressing cells, our data based on both scRT-PCR of acute slice preparations and double immunohistochemistry on perfusion-fixed tissue strongly support the idea that a proportion of PVALB-positive interneurons produce RELN, at least in the rat somatosensory barrel cortex. Do these PVALB interneurons expressing RELN display special properties? Interestingly, among fast-spiking PVALB cells, neurons expressing Reln exhibited a shorter first spike latency when depolarized just above threshold (162.5 ± 184.5 ms vs. 439.5 ± 203.3 ms, P < 0.01) and fired action potentials of larger amplitude (86.3 ± 7.9 mV vs. 77.8 ± 8.4 mV and 83.9 ± 8.2 mV vs. 77.4 ± 7.4 mV for the first and second spikes respectively, P < 0.05).
The co-localization of the IN-markers SST, NPY, or CALR with RELN was highly comparable to the data obtained by the single-cell analysis, whereas for VIP and NOS1 the degree of co-expression with RELN slightly differed between the datasets. In the case of VIP, we found almost no double immunoreactivity although 20% of Vip-positive patch-clamped cells (5 of 25) expressed Reln mRNA as detected by scRT-PCR. These discrepancies can be partly attributed to differences between transcript and protein levels, as has been described for Pfkfb3 mRNA where the corresponding protein is constantly degraded via the proteasome (Herrero-Mendez et al. 2009). In addition, the percentage of NOS1-positive cells double-immunoreactive for RELN was higher than the percentage of Nos1/Reln-positive cells in the scRT-PCR. In case of NOS1/Nos1, the absolute total number of immunoreactive cells (25) was low (92% of which were RELN-positive), which makes the quantitative analysis more susceptible for outliers. In addition, for NOS1, it has recently been shown that 2 different types of neurons characterized by either a strong (type I) or a weak (type II) immunohistochemical signal can be distinguished, and that the type II cells are preferentially found in layers I–IV (Magno et al. 2012; Perrenoud et al. 2012). Therefore, it is possible that we might have underestimated the NOS1-positive type II cells in our immunohistochemical analysis, which might account for the higher percentage of NOS1-positive RELN-immunoreactive cells when compared with the cDNA results.
In lamina I we found CALR-positive cells expressing RELN that showed an ovoid soma with horizontally orientated dendrites, resembling Cajal–Retzius cells. During brain development, the main source for RELN is Cajal–Retzius cells of the marginal zone (future lamina I). It is under debate whether these cells die off after birth or if a small fraction survives into adulthood (Derer and Derer 1990; del Río et al. 1995; Mienville 2008). The density of the potential Cajal–Retzius cells found in our study is in agreement with the number of surviving Cajal–Retzius cells that was recently described in vivo in juvenile mice (<4% at P20, Chowdhury et al. 2010). However, we cannot exclude that at least some of these cells are GABAergic interneurons.
Distribution of RELN- and IN-Marker-Labeled Neurons
RELN-immunoreactive cells were found in all layers but were enriched in lamina V. Of note, large (15–20 µm) RELN-immunolabeled cells were mainly found in lamina Vb (Fig. 6B). These cells were almost always IN-marker negative and displayed a pyramidal cell morphology, supporting previous reports that a proportion of RELN-positive neurons are excitatory pyramidal cells (Pesold et al. 1999; Ramos-Moreno et al. 2006; Chin et al. 2007; Varga et al. 2010). Due to the laminar restriction of these neurons to layer V, they should not have artificially lowered the percentage of co-localization found in interneurons of layers I–IV, which we have directly compared with our scRT-PCR data.
The concept of a homogeneous population of pyramidal neurons that contrasts to the highly heterogeneous interneurons started to change about a decade ago, especially concerning target area and target cell specificity but also regarding molecular and functional aspects (reviewed in Krook-Magnuson et al. 2012). The diversity of lamina V principal neurons and their molecular markers was reviewed by Molnár and Cheung (2006), and RELN might be considered as an additional marker in the future. Enriched secretion of RELN in lamina V might have a region-specific effect. To study RELN function it will be important to also look at the exact laminar and cellular distribution of RELN receptors (ApoER2 and VLDLR). In addition, it has to be considered that processed, small RELN fragments might act quite distantly from the locus of release (Lambert de Rouvroit et al. 1999).
In general, we found that the amount of endogenous RELN produced by different types of interneurons varied. Therefore, the degree of RELN immunoreactivity might represent an additional useful parameter for the classification of interneurons. Whereas the percentage of RELN-positive SST-, NPY-, and NOS1-immunoreactive cells was consistently high throughout all layers, we observed for several IN-markers that cells double-labeled for RELN accumulated in certain layers (layers IV/Va in case of PVALB-RELN-positive cells) or formed an approximate gradient from the pial surface to the white matter, as was the case for CALR-RELN-positive cells (Fig. 6C). The peaks of NPY-positive cells vs. RELN-positive cells were alternating. Although many NPY-positive cells were immunoreactive for RELN, overall NPY-positive cells were highly enriched in lamina II/III and in lamina VI. So far, almost nothing is known about the physiological consequences of co-expression of Reln, which has multiple effects on neuronal morphology (Niu et al. 2004, Leemhuis et al. 2010) and neurotransmission (Herz and Chen 2006; Hellwig et al. 2011), with interneuron markers, many of which are neuropeptides. Unfortunately, the physiological role of these neuropeptides in cortical function is also mostly unclear (Gallopin et al. 2006). Because of these differential distributions, it is interesting to ask whether RELN-immunoreactive interneurons and/or pyramidal cells do have a different function compared with the ones that do not produce RELN. Furthermore, it would be important to know whether the secretion of the glycoprotein itself is responsible for such functional differences, or whether the expression of Reln simply indicates a different subtype of these cells whose specific function is dependent on other factors.
Summary
We present a multimodal dataset on Reln-positive patch-clamped neurons in layers I–IV of rat somatosensory (barrel) cortex. Altogether 48 Reln-positive single cells were characterized by 44 electrophysiological, anatomical, and molecular parameters. Reln-positive interneurons were abundantly represented in the adapting-SST and adapting-NPY clusters, frequently in the fast-spiking PVALB cluster, rarely in the adapting/bursting-VIP cluster, and were absent in the glutamatergic cluster. The anatomical distribution of different RELN-positive subtypes was characterized by double immunohistochemistry with different IN-markers. Of note, we found clear evidence for the layer-specific presence of RELN-expressing PVALB interneurons, by both scRT-PCR and double immunohistochemistry. Not only RELN-immunoreactive interneurons double-labeled for PVALB, but also those expressing CALR were found enriched or even restricted to distinct layers. How RELN and neuropeptides interact functionally when they are released during neurotransmission is open for future studies.
Supplementary Material
Supplementary material can be found at: http://www.cercor.oxfordjournals.org/.
Funding
Notes
The authors thank Bettina Peters for technical support with the immunohistochemistry. Conflict of Interest: None declared.
Supplementary Material
Acknowledgments
This work was supported by the Deutsche Forschungsgemeinschaft (DFG) (grant numbers SFB 780/TP5 to J.H., H.B., and M.F.), MA2410/1-3 and MA2410/1-4 (P.M.), and Sta431/8-1 (J.S.), by the Bundesministerium für Bildung und Forschung (BMBF, e:bio ReelinSys, to H.B.), and National Institutes of Health (NIH) grant R37 HL63762 (to J.H.). J.H. was the recipient of a Wolfgang Paul award of the Humboldt Foundation and is supported by the Consortium for Frontotemporal Dementia Research, Bright Focus Foundation, Lupe Murchison Foundation, and Ted Nash Long Life Foundation. M.F. holds a Senior Professorship by the Hertie Foundation. B.C. is supported by the Agence Nationale pour la Recherche (ANR 2011 MALZ 003 01).
References
- Alcántara S, Ruiz M, D'Arcangelo G, Ezan F, de Lecea L, Curran T, Sotelo C, Soriano E. Regional and cellular patterns of reelin mRNA expression in the forebrain of the developing and adult mouse. J Neurosci. 1998;18:7779–7799. doi: 10.1523/JNEUROSCI.18-19-07779.1998. [DOI] [PMC free article] [PubMed] [Google Scholar]
- Armstrong C, Krook-Magnuson E, Soltesz I. Neurogliaform and ivy cells: a major family of nNOS expressing GABAergic neurons. Front Neural Circuits. 2012;6:23. doi: 10.3389/fncir.2012.00023. [DOI] [PMC free article] [PubMed] [Google Scholar]
- Ascoli GA, Alonso-Nanclares L, Anderson SA, Barrionuevo G, Benavides-Piccione R, Burkhalter A, Buzsáki G, Cauli B, Defelipe J, Fairén A, et al. Petilla terminology: nomenclature of features of GABAergic interneurons of the cerebral cortex. Nat Rev Neurosci. 2008;9:557–568. doi: 10.1038/nrn2402. [DOI] [PMC free article] [PubMed] [Google Scholar]
- Beaulieu C. Numerical data on neocortical neurons in adult rat, with special reference to the GABA population. Brain Res. 1993;609(1–2):284–92. doi: 10.1016/0006-8993(93)90884-p. [DOI] [PubMed] [Google Scholar]
- Beffert U, Weeber EJ, Durudas A, Qiu S, Masiulis I, Sweatt JD, Li WP, Adelmann G, Frotscher M, Hammer RE, et al. Modulation of synaptic plasticity and memory by Reelin involves differential splicing of the lipoprotein receptor Apoer2. Neuron. 2005;47:567–579. doi: 10.1016/j.neuron.2005.07.007. [DOI] [PubMed] [Google Scholar]
- Bennett MV, Zukin RS. Electrical coupling and neuronal synchronization in the mammalian brain. Neuron. 2004;41:495–511. doi: 10.1016/s0896-6273(04)00043-1. [DOI] [PubMed] [Google Scholar]
- Bock HH, Herz J. Reelin activates SRC family tyrosine kinases in neurons. Curr Biol. 2003;13:18–26. doi: 10.1016/s0960-9822(02)01403-3. [DOI] [PubMed] [Google Scholar]
- Campo CG, Sinagra M, Verrier D, Manzoni OJ, Chavis P. Reelin secreted by GABAergic neurons regulates glutamate receptor homeostasis. PLoS One. 2009;4:e5505. doi: 10.1371/journal.pone.0005505. [DOI] [PMC free article] [PubMed] [Google Scholar]
- Cardin JA, Carlén M, Meletis K, Knoblich U, Zhang F, Deisseroth K, Tsai LH, Moore CI. Driving fast-spiking cells induces gamma rhythm and controls sensory responses. Nature. 2009;459:663–667. doi: 10.1038/nature08002. [DOI] [PMC free article] [PubMed] [Google Scholar]
- Caviness VS, Jr, Rakic P. Mechanisms of cortical development: a view from mutations in mice. Annu Rev Neurosci. 1978;1:297–326. doi: 10.1146/annurev.ne.01.030178.001501. [DOI] [PubMed] [Google Scholar]
- Chin J, Massaro CM, Palop JJ, Thwin MT, Yu GQ, Bien-Ly N, Bender A, Mucke L. Reelin depletion in the entorhinal cortex of human amyloid precursor protein transgenic mice and humans with Alzheimer's disease. J Neurosci. 2007;27(11):2727–33. doi: 10.1523/JNEUROSCI.3758-06.2007. [DOI] [PMC free article] [PubMed] [Google Scholar]
- Chowdhury TG, Jimenez JC, Bomar JM, Cruz-Martin A, Cantle JP, Portera-Cailliau C. Fate of cajal-retzius neurons in the postnatal mouse neocortex. Front Neuroanat. 2010;4:10. doi: 10.3389/neuro.05.010.2010. [DOI] [PMC free article] [PubMed] [Google Scholar]
- Cossart R. The maturation of cortical interneuron diversity: how multiple developmental journeys shape the emergence of proper network function. Curr Opin Neurobiol. 2011;21(1):160–8. doi: 10.1016/j.conb.2010.10.003. [DOI] [PubMed] [Google Scholar]
- D'Arcangelo G. Reelin mouse mutants as models of cortical development disorders. Epilepsy Behav. 2006;8(1):81–90. doi: 10.1016/j.yebeh.2005.09.005. [DOI] [PubMed] [Google Scholar]
- del Río JA, Martínez A, Fonseca M, Auladell C, Soriano E. Glutamate-like immunoreactivity and fate of Cajal-Retzius cells in the murine cortex as identified with calretinin antibody. Cereb Cortex. 1995;5:13–21. doi: 10.1093/cercor/5.1.13. [DOI] [PubMed] [Google Scholar]
- Derer P, Derer M. Cajal-Retzius cell ontogenesis and death in mouse brain visualized with horseradish peroxidase and electron microscopy. Neuroscience. 1990;36:8398–56. doi: 10.1016/0306-4522(90)90027-2. [DOI] [PubMed] [Google Scholar]
- Di Cristo G. Development of cortical GABAergic circuits and its implications for neurodevelopmental disorders. Clin Genet. 2007;72(1):1–8. doi: 10.1111/j.1399-0004.2007.00822.x. [DOI] [PubMed] [Google Scholar]
- Drakew A, Frotscher M, Deller T, Ogawa M, Heimrich B. Developmental distribution of a reeler gene-related antigen in the rat hippocampal formation visualized by CR-50 immunocytochemistry. Neuroscience. 1998;82:1079–1086. doi: 10.1016/s0306-4522(97)00326-6. [DOI] [PubMed] [Google Scholar]
- Fatemi SH, Earle JA, McMenomy T. Reduction in Reelin immunoreactivity in hippocampus of subjects with schizophrenia, bipolar disorder and major depression. Mol Psychiatry. 2000;5:654–663. doi: 10.1038/sj.mp.4000783. [DOI] [PubMed] [Google Scholar]
- Feldmeyer D, Brecht M, Helmchen F, Petersen CC, Poulet JF, Staiger JF, Luhmann HJ, Schwarz C. Barrel cortex function. Prog Neurobiol. 2012 doi: 10.1016/j.pneurobio.2012.11.002. doi:pii:S0301–0082(12)00170–0.10.1016/j.pneurobio.2012.11.002. [DOI] [PubMed] [Google Scholar]
- Förster E, Bock HH, Herz J, Chai X, Frotscher M, Zhao S. Emerging topics in Reelin function. Eur J Neurosci. 2010;31:1511–1518. doi: 10.1111/j.1460-9568.2010.07222.x. [DOI] [PMC free article] [PubMed] [Google Scholar]
- Gallopin T, Geoffroy H, Rossier J, Lambolez B. Cortical sources of CRF, NKB, and CCK and their effects on pyramidal cells in the neocortex. Cereb Cortex. 2006;16:1440–1452. doi: 10.1093/cercor/bhj081. [DOI] [PubMed] [Google Scholar]
- Gentet LJ. Functional diversity of supragranular GABAergic neurons in the barrel cortex. Front Neural Circuits. 2012;6:52. doi: 10.3389/fncir.2012.00052. [DOI] [PMC free article] [PubMed] [Google Scholar]
- Guidotti A, Auta J, Davis JM, Di-Giorgi-Gerevini V, Dwivedi Y, Grayson DR, Impagnatiello F, Pandey G, Pesold C, Sharma R, et al. Decrease in reelin and glutamic acid decarboxylase67 (GAD67) expression in schizophrenia and bipolar disorder: a postmortem brain study. Arch Gen Psychiatry. 2000;57:1061–1069. doi: 10.1001/archpsyc.57.11.1061. [DOI] [PubMed] [Google Scholar]
- Hartigan JA, Wong MA. Algorithm AS 136: a K-means clustering algorithm. Appl Stat. 1979;28:100–108. [Google Scholar]
- Hellwig S, Hack I, Kowalski J, Brunne B, Jarowyj J, Unger A, Bock HH, Junghans D, Frotscher M. Role for Reelin in neurotransmitter release. J Neurosci. 2011;31:2352–2360. doi: 10.1523/JNEUROSCI.3984-10.2011. [DOI] [PMC free article] [PubMed] [Google Scholar]
- Herrero-Mendez A, Almeida A, Fernández E, Maestre C, Moncada S, Bolaños JP. The bioenergetic and antioxidant status of neurons is controlled by continuous degradation of a key glycolytic enzyme by APC/C-Cdh1. Nat Cell Biol. 2009;11:747–52. doi: 10.1038/ncb1881. [DOI] [PubMed] [Google Scholar]
- Herz J, Chen Y. Reelin, lipoprotein receptors and synaptic plasticity. Nat Rev Neurosci. 2006;7:850–859. doi: 10.1038/nrn2009. [DOI] [PubMed] [Google Scholar]
- Impagnatiello F, Guidotti AR, Pesold C, Dwivedi Y, Caruncho H, Pisu MG, Uzunov DP, Smalheiser NR, Davis JM, Pandey GN, et al. A decrease of reelin expression as a putative vulnerability factor in schizophrenia. Proc Natl Acad Sci USA. 1998;95:15718–15723. doi: 10.1073/pnas.95.26.15718. [DOI] [PMC free article] [PubMed] [Google Scholar]
- Karagiannis A, Gallopin T, Dávid C, Battaglia D, Geoffroy H, Rossier J, Hillman EM, Staiger JF, Cauli B. Classification of NPY-expressing neocortical interneurons. J Neurosci. 2009;29:3642–3659. doi: 10.1523/JNEUROSCI.0058-09.2009. [DOI] [PMC free article] [PubMed] [Google Scholar]
- Krook-Magnuson E, Varga C, Lee SH, Soltesz I. New dimensions of interneuronal specialization unmasked by principal cell heterogeneity. Trends Neurosci. 2012;35(3):175–84. doi: 10.1016/j.tins.2011.10.005. [DOI] [PMC free article] [PubMed] [Google Scholar]
- Lambert de Rouvroit C, de Bergeyck V, Cortvrindt C, Bar I, Eeckhout Y, Goffinet AM. Reelin, the extracellular matrix protein deficient in reeler mutant mice, is processed by a metalloproteinase. Exp Neurol. 1999;156(1):214–7. doi: 10.1006/exnr.1998.7007. [DOI] [PubMed] [Google Scholar]
- Leemhuis J, Bouché E, Frotscher M, Henle F, Hein L, Herz J, Meyer DK, Pichler M, Roth G, Schwan C, et al. Reelin signals through apolipoprotein E receptor 2 and Cdc42 to increase growth cone motility and filopodia formation. J Neurosci. 2010;30:14759–72. doi: 10.1523/JNEUROSCI.4036-10.2010. [DOI] [PMC free article] [PubMed] [Google Scholar]
- Meyer HS, Schwarz D, Wimmer VC, Schmitt AC, Kerr JN, Sakmann B, Helmstaedter M. Inhibitory interneurons in a cortical column form hot zones of inhibition in layers 2 and 5A. Proc Natl Acad Sci USA. 2011;108(40):16807–12. doi: 10.1073/pnas.1113648108. [DOI] [PMC free article] [PubMed] [Google Scholar]
- Mienville JM. Reelin and Cajal-Retzius Cells. In: Fatemi SH, editor. Reelin glykoprotein; structure, biology and roles in health and disease. New York: Springer; 2008. pp. 263–277. [Google Scholar]
- Lewis DA, Curley AA, Glausier JR, Volk DW. Cortical parvalbumin interneurons and cognitive dysfunction in schizophrenia. Trends Neurosci. 2012;35:57–67. doi: 10.1016/j.tins.2011.10.004. [DOI] [PMC free article] [PubMed] [Google Scholar]
- MacQueen JB. Some methods of classification and analysis of multivariate observations. Proceedings of the Fifth Berkeley Symposium in Mathematical Statistics and Probability. Vol. 1. Berkeley (CA): University of California; 1967. pp. 281–297. [Google Scholar]
- Magno L, Oliveira MG, Mucha M, Rubin AN, Kessaris N. Multiple embryonic origins of nitric oxide synthase-expressing GABAergic neurons of the neocortex. Front Neural Circuits. 2012;6:65. doi: 10.3389/fncir.2012.00065. [DOI] [PMC free article] [PubMed] [Google Scholar]
- Marín O. Interneuron dysfunction in psychiatric disorders. Nat Rev Neurosci. 2012;13:107–120. doi: 10.1038/nrn3155. [DOI] [PubMed] [Google Scholar]
- McCormick DA, Connors BW, Lighthall JW, Prince DA. Comparative electrophysiology of pyramidal and sparsely spiny stellate neurons of the neocortex. J Neurophysiol. 1985;54(4):782–806. doi: 10.1152/jn.1985.54.4.782. [DOI] [PubMed] [Google Scholar]
- Miyoshi G, Hjerling-Leffler J, Karayannis T, Sousa VH, Butt SJ, Battiste J, Johnson JE, Machold RP, Fishell G. Genetic fate mapping reveals that the caudal ganglionic eminence produces a large and diverse population of superficial cortical interneurons. J Neurosci. 2010;30:1582–1594. doi: 10.1523/JNEUROSCI.4515-09.2010. [DOI] [PMC free article] [PubMed] [Google Scholar]
- Molnár Z, Cheung AF. Towards the classification of subpopulations of layer V pyramidal projection neurons. Neurosci Res. 2006;55(2):105–15. doi: 10.1016/j.neures.2006.02.008. [DOI] [PubMed] [Google Scholar]
- Nakazawa K, Zsiros V, Jiang Z, Nakao K, Kolata S, Zhang S, Belforte JE. GABAergic interneuron origin of schizophrenia pathophysiology. Neuropharmacology. 2012;62(3):1574–83. doi: 10.1016/j.neuropharm.2011.01.022. [DOI] [PMC free article] [PubMed] [Google Scholar]
- Niu S, Renfro A, Quattrocchi CC, Sheldon M, D'Arcangelo G. Reelin promotes hippocampal dendrite development through the VLDLR/ApoER2-Dab1 pathway. Neuron. 2004;41:71–84. doi: 10.1016/s0896-6273(03)00819-5. [DOI] [PubMed] [Google Scholar]
- Palop JJ, Mucke L. Amyloid-beta-induced neuronal dysfunction in Alzheimer's disease: from synapses toward neural networks. Nat Neurosci. 2010;13(7):812–8. doi: 10.1038/nn.2583. [DOI] [PMC free article] [PubMed] [Google Scholar]
- Perrenoud Q, Geoffroy H, Gauthier B, Rancillac A, Alfonsi F, Kessaris N, Rossier J, Vitalis T, Gallopin T. Characterization of type I and type II nNOS-expressing interneurons in the barrel cortex of mouse. Front Neural Circuits. 2012;6:36. doi: 10.3389/fncir.2012.00036. [DOI] [PMC free article] [PubMed] [Google Scholar]
- Pesold C, Impagnatiello F, Pisu MG, Uzunov DP, Costa E, Guidotti A, Caruncho HJ. Reelin is preferentially expressed in neurons synthesizing gamma-aminobutyric acid in cortex and hippocampus of adult rats. Proc Natl Acad Sci USA. 1998;95:3221–3226. doi: 10.1073/pnas.95.6.3221. [DOI] [PMC free article] [PubMed] [Google Scholar]
- Pesold C, Liu WS, Guidotti A, Costa E, Caruncho HJ. Cortical bitufted, horizontal, and Martinotti cells preferentially express and secrete reelin into perineuronal nets, nonsynaptically modulating gene expression. Proc Natl Acad Sci USA. 1999;96:3217–3222. doi: 10.1073/pnas.96.6.3217. [DOI] [PMC free article] [PubMed] [Google Scholar]
- Pujadas L, Gruart A, Bosch C, Delgado L, Teixeira CM, Rossi D, de Lecea L, Martínez A, Delgado-García JM, Soriano E. Reelin regulates postnatal neurogenesis and enhances spine hypertrophy and long-term potentiation. J Neurosci. 2010;30:4636–4649. doi: 10.1523/JNEUROSCI.5284-09.2010. [DOI] [PMC free article] [PubMed] [Google Scholar]
- Ramos-Moreno T, Galazo MJ, Porrero C, Martínez-Cerdeño V, Clascá F. Extracellular matrix molecules and synaptic plasticity: immunomapping of intracellular and secreted Reelin in the adult rat brain. Eur J Neurosci. 2006;23:401–422. doi: 10.1111/j.1460-9568.2005.04567.x. [DOI] [PubMed] [Google Scholar]
- Ren JQ, Aika Y, Heizmann CW, Kosaka T. Quantitative analysis of neurons and glial cells in the rat somatosensory cortex, with special reference to GABAergic neurons and parvalbumin-containing neurons. Exp Brain Res. 1992;92:1–14. doi: 10.1007/BF00230378. [DOI] [PubMed] [Google Scholar]
- Rousseeuw PJ. Silhouettes: a graphical aid to the interpretation and validation of cluster analysis. J Comput Appl Math. 1987;20:53–65. [Google Scholar]
- Rudy B, Fishell G, Lee S, Hjerling-Leffler J. Three groups of interneurons account for nearly 100% of neocortical GABAergic neurons. Dev Neurobiol. 2011;71:45–61. doi: 10.1002/dneu.20853. [DOI] [PMC free article] [PubMed] [Google Scholar]
- Tissir F, Goffinet AM. Reelin and brain development. Nat Rev Neurosci. 2003;4(6):496–505. doi: 10.1038/nrn1113. [DOI] [PubMed] [Google Scholar]
- Tricoire L, Pelkey KA, Erkkila BE, Jeffries BW, Yuan X, McBain CJ. A blueprint for the spatiotemporal origins of mouse hippocampal interneuron diversity. J Neurosci. 2011;31:10948–10970. doi: 10.1523/JNEUROSCI.0323-11.2011. [DOI] [PMC free article] [PubMed] [Google Scholar]
- Varga C, Lee SY, Soltesz I. Target-selective GABAergic control of entorhinal cortex output. Nat Neurosci. 2010;13(7):822–4. doi: 10.1038/nn.2570. [DOI] [PMC free article] [PubMed] [Google Scholar]
- Ward JH. Hierarchical grouping to optimize an objective function. J Am Stat Assoc. 1963;58:236–244. [Google Scholar]
- Wierenga CJ, Müllner FE, Rinke I, Keck T, Stein V, Bonhoeffer T. Molecular and electrophysiological characterization of GFP-expressing CA1 interneurons in GAD65-GFP mice. PLoS One. 2010;5:e15915. doi: 10.1371/journal.pone.0015915. [DOI] [PMC free article] [PubMed] [Google Scholar]
- Zhao S, Chai X, Frotscher M. Balance between neurogenesis and gliogenesis in the adult hippocampus: role for reelin. Dev Neurosci. 2007;29:84–90. doi: 10.1159/000096213. [DOI] [PubMed] [Google Scholar]
Associated Data
This section collects any data citations, data availability statements, or supplementary materials included in this article.