Abstract
This DataView presents descriptive information on beneficiaries with disabilities in Medicare and Medicaid. Medicare data show that persons with disabilities have more functional limitations, poorer health status, lower incomes, and experience more barriers to health care than aged Medicare beneficiaries. Medicaid data reveal that significant growth in the Medicaid disabled population has led to the disabled outnumbering the Medicaid-eligible elderly. Additionally, Medicaid serves an increasingly younger disabled population and more persons with mental impairments.
Introduction
Both Medicare and Medicaid serve large and diverse populations of persons with disabilities. In this DataView, we present descriptive information on Medicare and Medicaid beneficiaries with disabilities. The data come from several HCFA sources—including the most recent data available from the Medicare Current Beneficiary Survey1 and Medicare and Medicaid enrollment and claims data. Data from the Social Security Administration on persons receiving disability income payments—the majority of Medicare's and Medicaid's disabled enrollees—also were used.
Medicare data show that persons with disabilities are a vulnerable population, having more functional limitations, poorer health status, lower incomes, and experiencing more barriers to health care than do the elderly in Medicare.
The Medicaid data reveal a number of trends that have emerged in recent years. There has been significant growth in the Medicaid disabled population. Persons with disabilities now outnumber the elderly in Medicaid. Further, Medicaid is serving an increasingly younger population of persons with disabilities as well as more persons with mental impairments.
Medicare
Social Security Disability Income (SSDI) beneficiaries—disabled workers, disabled widows and widowers, and adults disabled as children—became eligible for Medicare benefits in 1973 as a result of the 1972 Amendments to the Social Security Act. While the elderly account for the majority of Medicare enrollees (88 percent), the disabled are an important and growing population in Medicare.
Growth of the Medicare Disabled Population
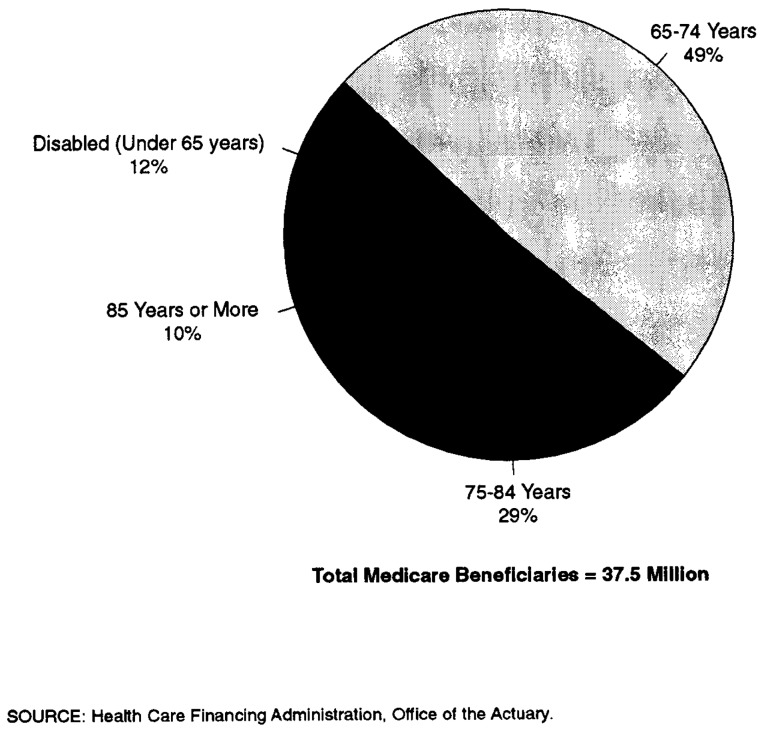
12 percent of Medicare beneficiaries are non-elderly persons with disabilities, most of whom are disabled workers (Figure 1).
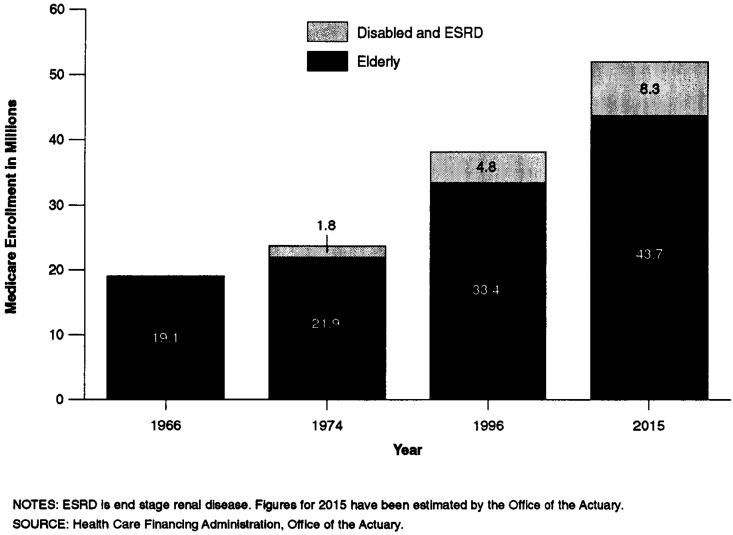
Numbering about 4.4 million in 1995, the disabled are expected to grow to about 8.3 million in 2015—comprising about 16 percent of the Medicare population (Figure 2). Recent growth in the disability rolls is attributable to growth in the eligible population, a decline in the number of persons leaving the rolls, and increased recognition and diagnosis of disabling conditions, among other factors.2
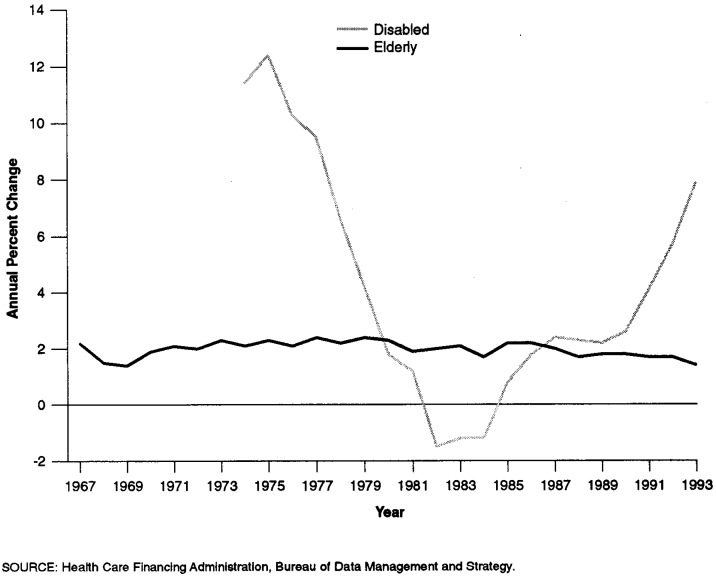
The growth in the disabled population historically has been more volatile than that of the elderly population. The shifts in the average annual growth in Medicare's disabled enrollees reflects changes in SSDI eligibility policy (Figure 3).
Figure 1. Composition of the Medicare Population: 1995.
Figure 2. Medicare Enrollment of Elderly, Disabled, and ESRD Populations: 1966-2015.
Figure 3. Annual Percent Change in Number of Medicare Elderly and Disabled Enrollees: 1967-93.
Functional and Health Status
Disability is associated with specific medical conditions and is typically defined in terms of the impact of disease on functional capacity, the ability to perform usual activities of daily living (ADLs) such as eating, dressing, and walking, or the ability to perform instrumental activities of daily living (IADLs), such as paying bills, doing housework, and shopping.
In 1994, the single largest category for SSDI awards was mental illness, accounting for nearly 25 percent of new awards. This may include, for example, awards to persons with organic mental disorders, psychotic disorders, or substance addiction disorders (Figure 4).
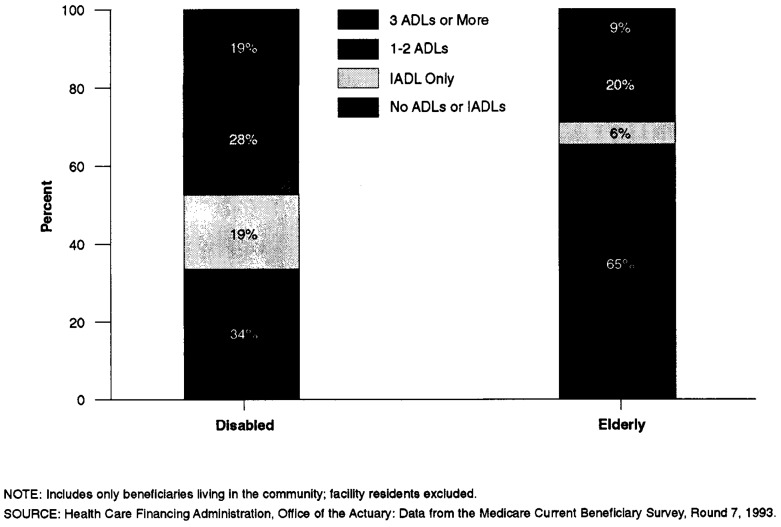
The disabled in Medicare have significant levels of impairment, as measured by their ability to perform ADLs and IADLs. Nearly 50 percent of the disabled in Medicare have 1 or more ADL limitations (Figure 5).
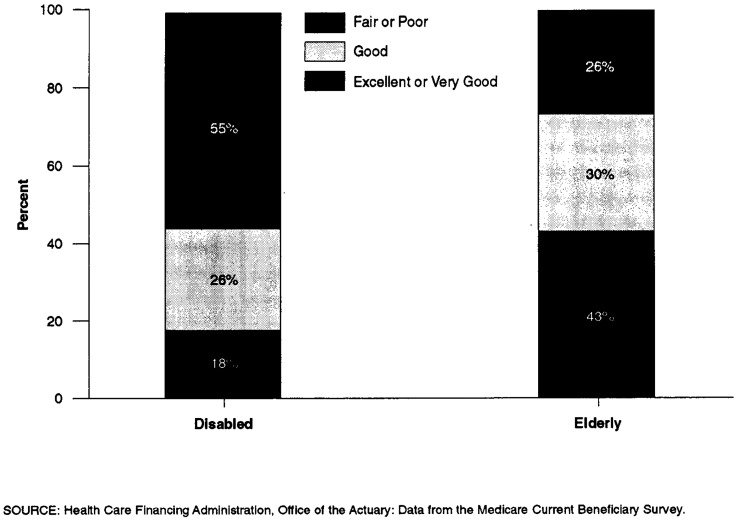
The disabled in Medicare are much more likely than the elderly to report their health status as fair or poor: Nearly 55 percent of the disabled report their health status as fair or poor, compared with 26 percent of the elderly (Figure 6).
Figure 4. Composition of the Medicare Disabled Population: Most Prevalent Diagnoses, 1994.
Figure 5. Functional Status of Medicare's Elderly and Disabled Beneficiaries.
Figure 6. Self-Reported Health Status of Medicare Beneficiaries: 1993.
Demographics
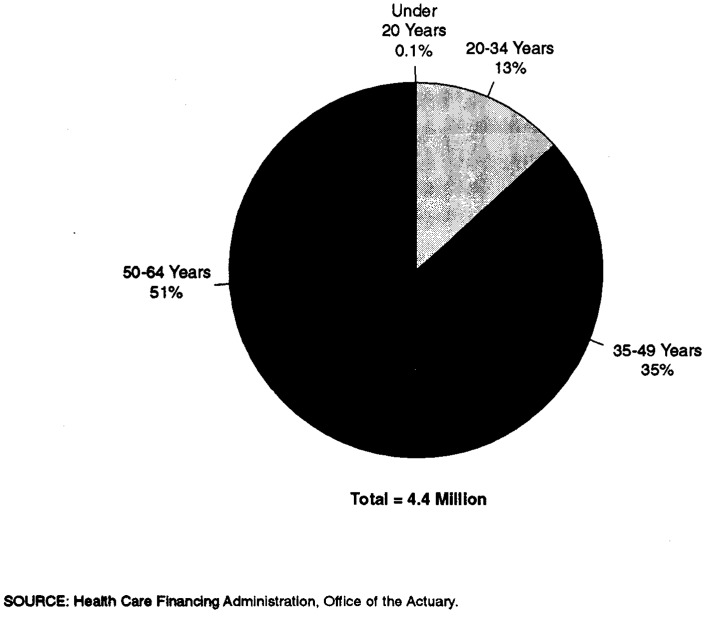
Of the 12 percent of the Medicare population that is disabled (under 65 years of age), most are between 50 and 64 years of age, reflecting increases in the prevalence of disability with age (Figure 7).
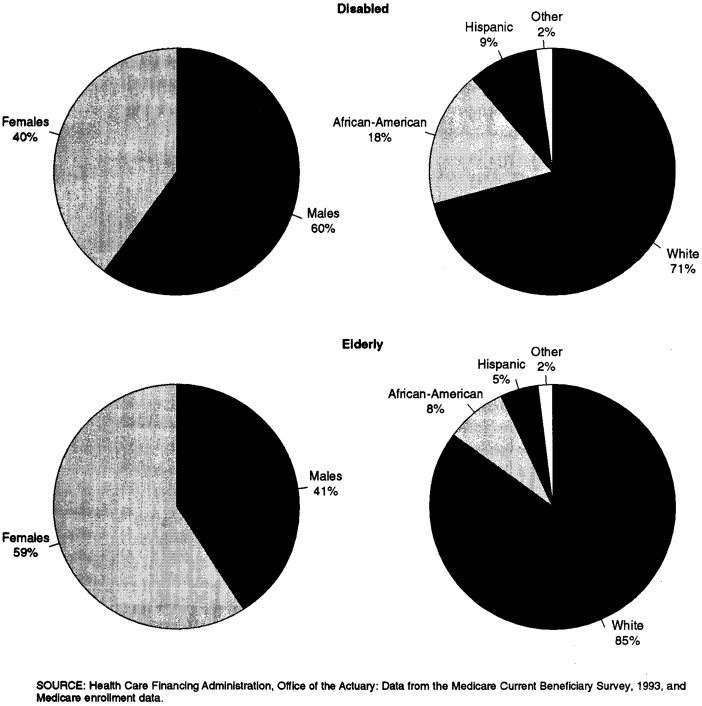
The Medicare elderly population is primarily white (85 percent), with fairly small numbers of African-Americans (8 percent), Hispanic persons (5 percent), and persons of other ethnic groups (2 percent), similar to the racial distribution of the general U.S. population. By comparison, African-Americans and Hispanics are disproportionately represented among the disabled in Medicare. The disabled population also has a higher proportion of men than does the elderly Medicare population (Figure 8).
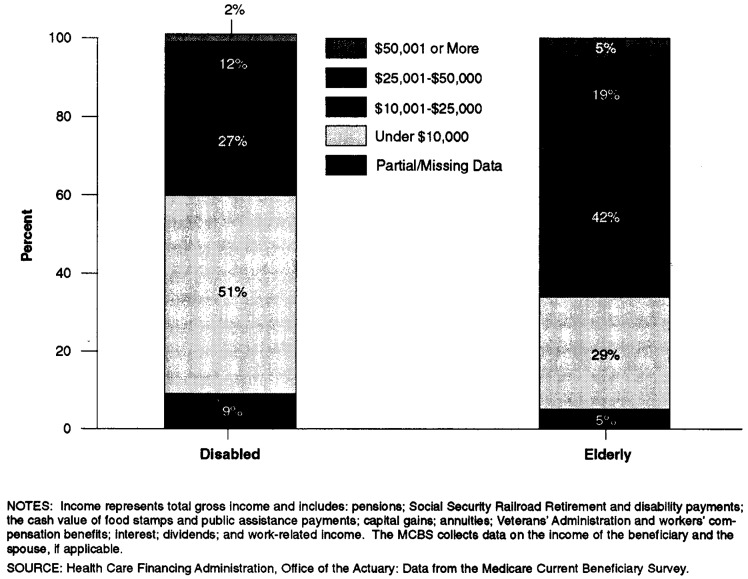
The disabled tend to have low incomes. Fifty-one percent of the disabled in Medicare have incomes below $10,000, compared with 29 percent of the elderly; nearly 78 percent of the disabled have incomes below $25,000 (Figure 9).
Figure 7. Age Distribution of the Medicare Disabled: 1995.
Figure 8. Sex and Race/Ethnicity of Medicare Beneficiaries: 1993.
Figure 9. Income Distribution of the Medicare Disabled and Elderly: 1993.
Insurance Coverage
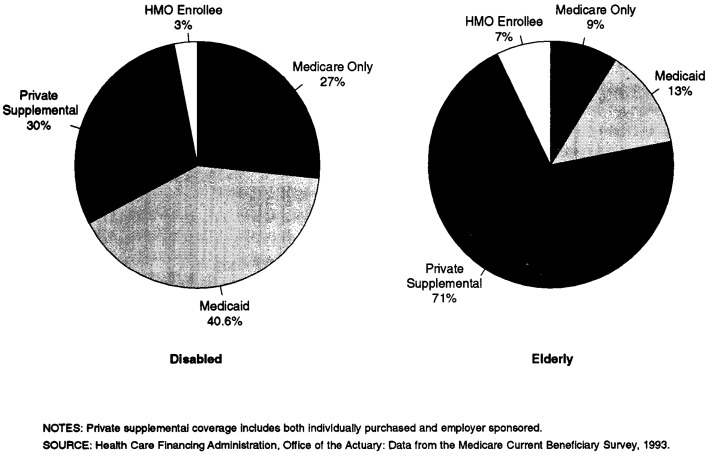
Nearly 27 percent of the disabled have Medicare coverage only; that is, they do not have any private supplemental insurance coverage nor are they eligible for Medicaid (Figure 10).
Many of the disabled rely on Medicaid to supplement their health insurance coverage: 41 percent of the disabled in Medicare are also enrolled in Medicaid, significantly more than the elderly, of whom only 13 percent are dually enrolled in Medicare and Medicaid.
Figure 10. Type of Supplemental Health Insurance Held by Medicare Beneficiaries: 1993.
Spending and Utilization
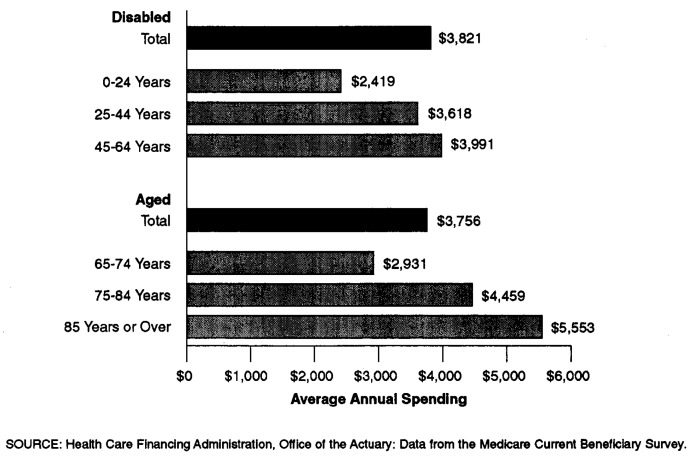
While analyses for previous years have shown the disabled to have much higher health care spending than the elderly in Medicare, recent data suggest that spending by the elderly and the disabled in Medicare is similar. In 1993, average spending per disabled enrollee was $3,821, while it was $3,756 per elderly enrollee (Figure 11).
Part of the explanation for the convergence of spending levels may lie with the aging of the Medicare elderly population, since health care spending levels tend to rise with age in both the elderly and disabled populations.
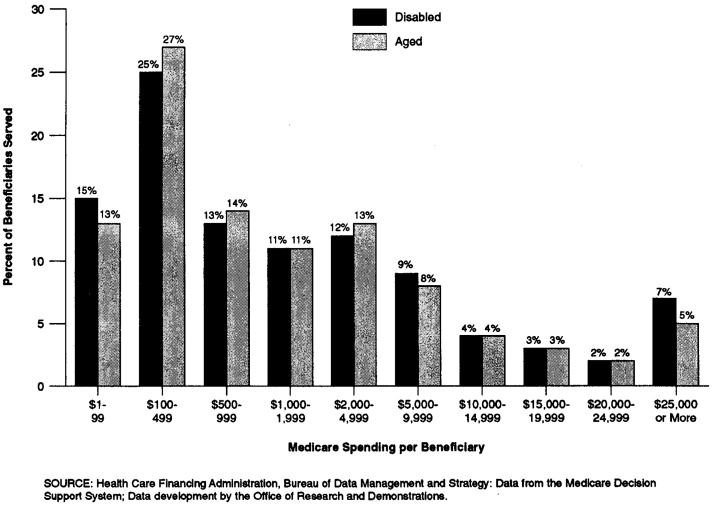
Average spending levels mask variation in spending across the disabled and elderly populations. Though average spending per enrollee is over $3,000 annually, about 40 percent of Medicare's disabled enrollees had payments on their behalf of between $1 and $499; only 7 percent had spending of more than $25,000. This pattern is similar to that of the elderly in Medicare (Figure 12).
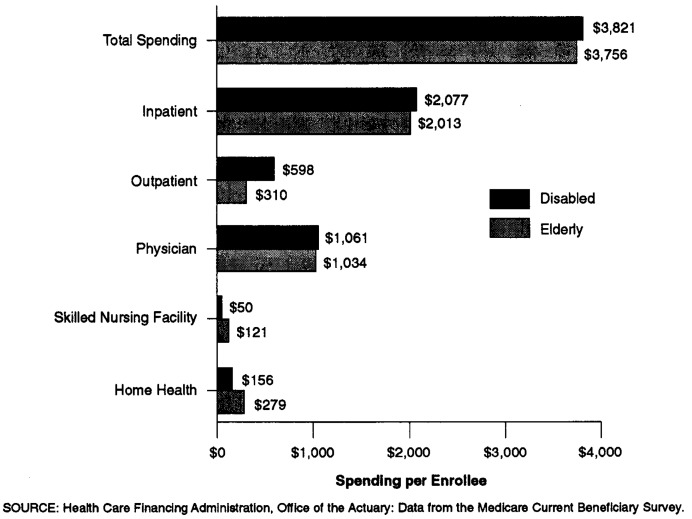
Health care spending by type of Medicare service reveals that the disabled spend relatively more on outpatient services, while the elderly spend more on long-term care services (Figure 13).
Average spending per disabled enrollee in 1993 was $3,939 for men and $3,642 for women. The difference may be explained by relatively higher expenditures for inpatient hospital services used by men. Spending for women was higher for other major services—outpatient, physician services, skilled nursing, and home health. These data do not indicate to what extent the differences in spending may be due to differences in such factors as diagnosis or age (Figure 14).
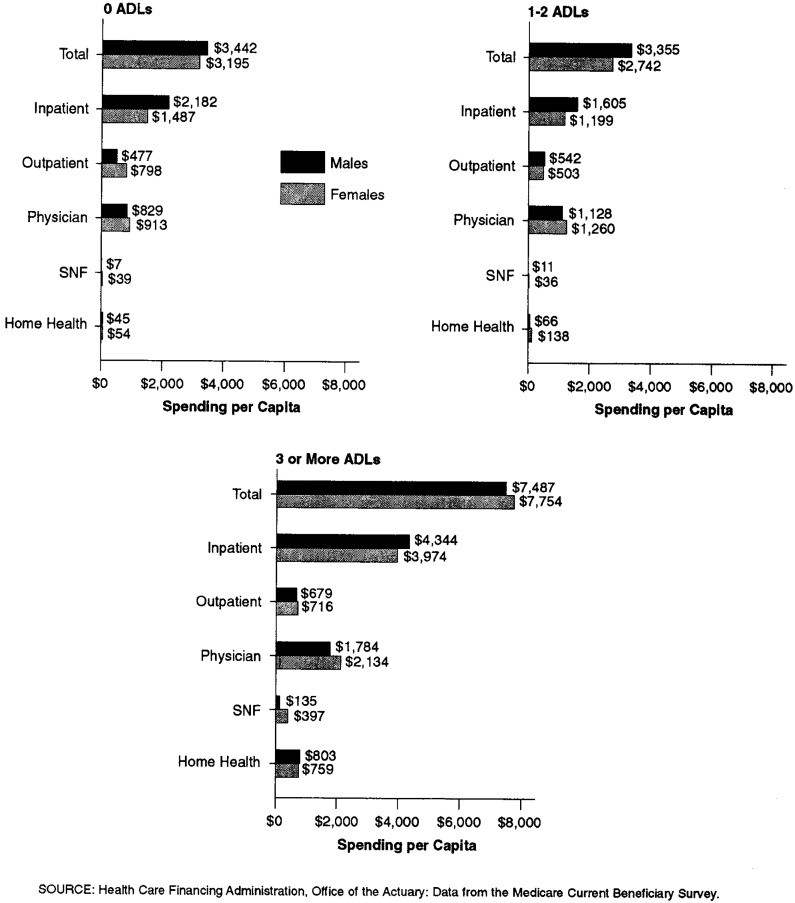
Health care spending is also related to ADL impairment. Total health care spending by persons with 3 or more ADL impairments is more than twice that of those who have no limitations in ADLs (Figure 15).
Figure 11. Average Annual Medicare Spending, by Age Group: 1993.
Figure 12. Distribution of Spending for Elderly and Disabled Beneficiaries: 1994.
Figure 13. Average Annual Medicare Spending by Disabled and Elderly Enrollees, by Type of Service: 1993.
Figure 14. Average Annual Medicare Spending per Disabled Enrollee, by Sex: 1993.
Figure 15. Medicare Spending Per Disabled Enrollee, by Functional Status and Sex: 1993.
Access to Care
The disabled were less likely than the elderly in Medicare to have had a physician visit during 1993 and were much more likely to have had an emergency room visit. While only 20.3 percent of the elderly had an emergency room visit during 1993, nearly 29 percent of persons with disabilities used an emergency room (Figure 16).
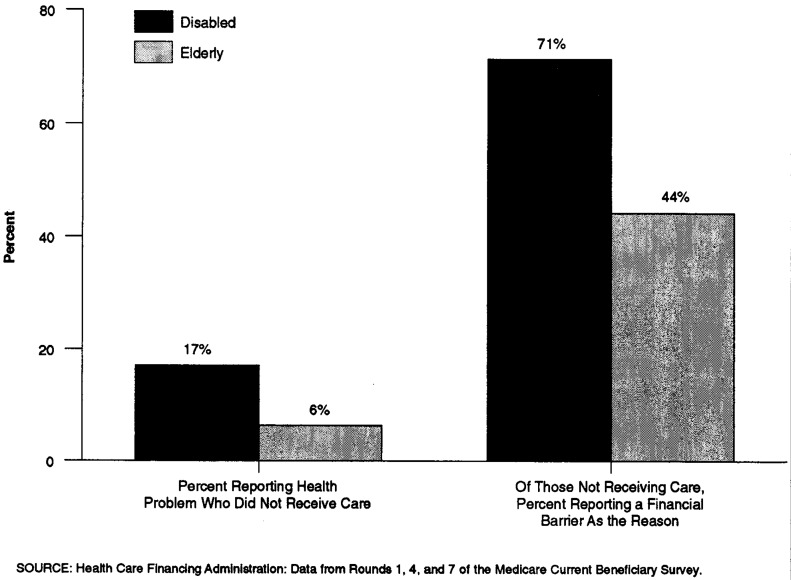
In general, the disabled in Medicare are more likely to report a health problem and not receive care than are the elderly. In addition, the disabled are more likely than the elderly to report a financial barrier as the reason for not receiving care (Figure 17).
Figure 16. Use of Physician Services by the Disabled and Elderly: 1993.
Figure 17. Barriers to Care: 1993.
Satisfaction With Care
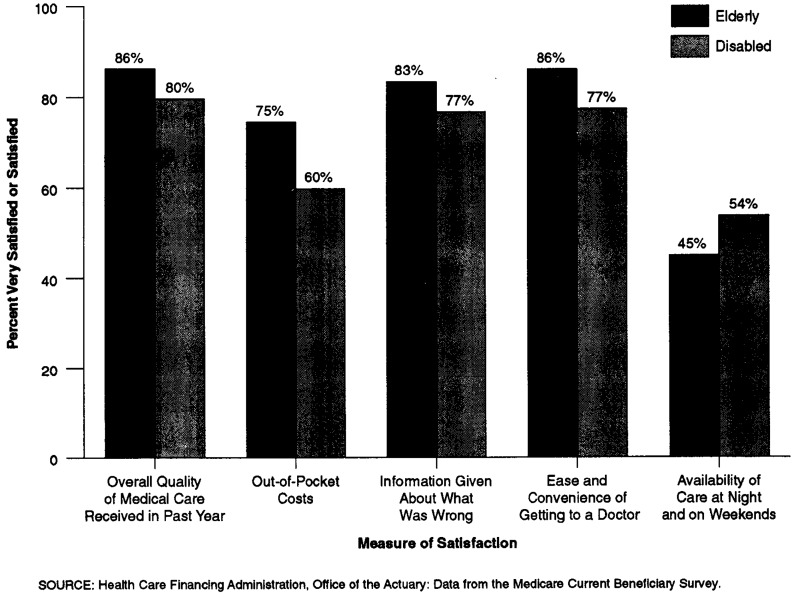
Despite these potential access problems, individuals with disabilities are generally satisfied with the overall quality of the medical care they receive. When asked to report their satisfaction with the overall quality of the medical care received in the past, 80 percent of persons with disabilities reported that they were very satisfied or satisfied. However, only 60 percent were satisfied with the level of out-of-pocket spending and only 54 percent were satisfied with the availability of care at night and on weekends (Figure 18).
Figure 18. Medicare Beneficiaries Rate Satisfaction With Medical Care: 1993.
Managed Care
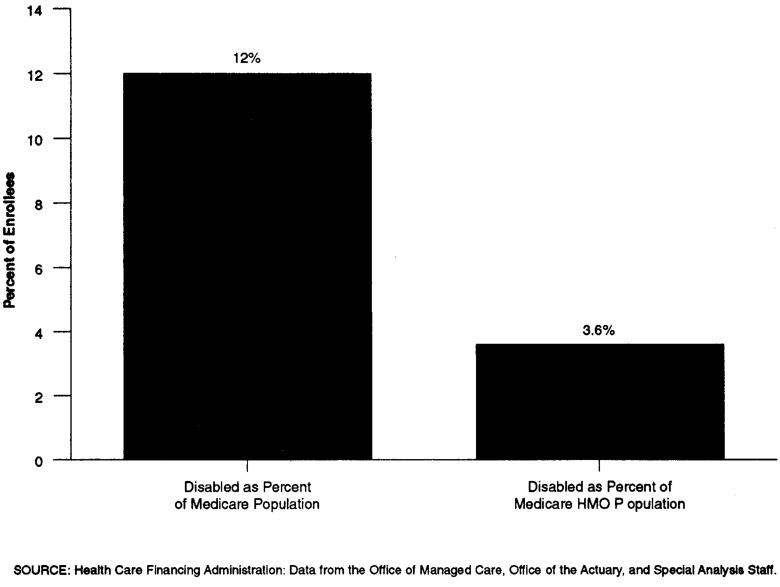
The disabled are somewhat under-represented in Medicare managed care. While the disabled make up about 12 percent of the Medicare population, they account for just 3.6 percent of the Medicare HMO (risk and cost) population (Figure 19).
Figure 19. Enrollment of the Disabled in Medicare Managed Care: 1995.
Medicaid
Eligibility for Medicaid for persons with disabilities is closely linked to eligibility for cash benefits under the Supplemental Security Income (SSI) program. Persons who do not receive cash benefits can still qualify for Medicaid coverage through various options open to the States, including the “medically needy” program and special financial criteria for the institutionalized.
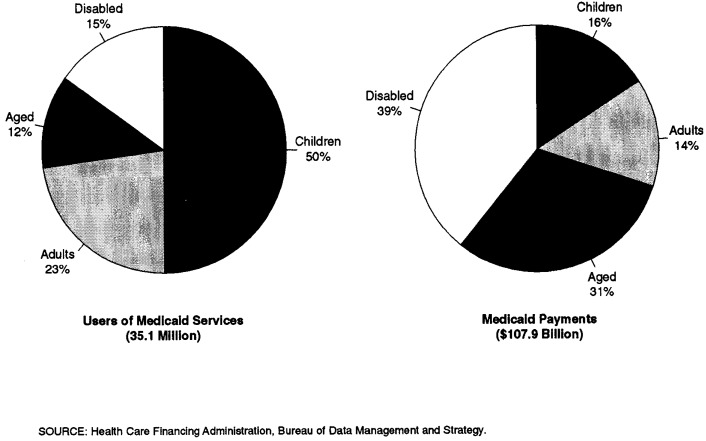
In 1994, there were about 40 million individuals enrolled in Medicaid, 35.1 million of whom received services. Of these 35.1 million users of Medicaid services, about 5.4 million (15 percent) were blind and disabled (Figure 20).
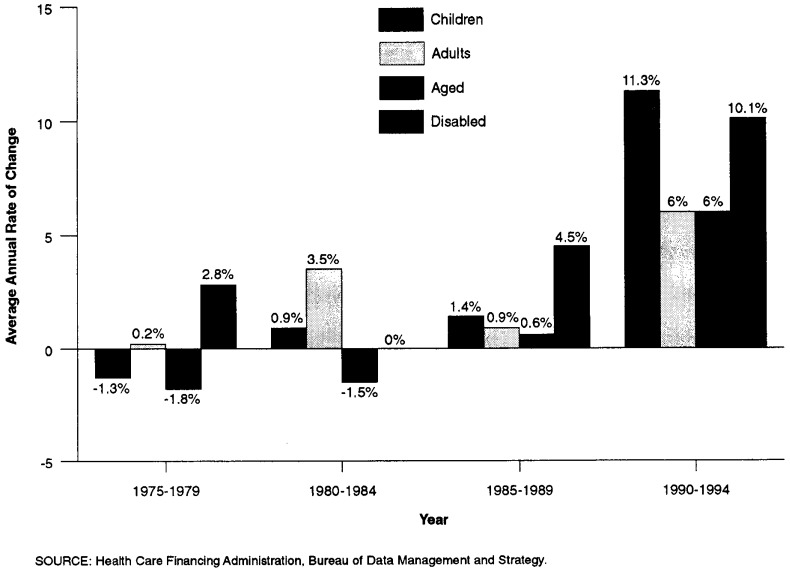
Between 1990 and 1994, non-disabled children were the fastest growing eligibility group in Medicaid, growing at an 11 percent average annual rate; the disabled (children and adults) had the second fastest rate of increase at 10 percent (Figure 21). This recent rapid growth in the number of persons with disabilities in Medicaid is related to the growth in the number of persons receiving SSI.
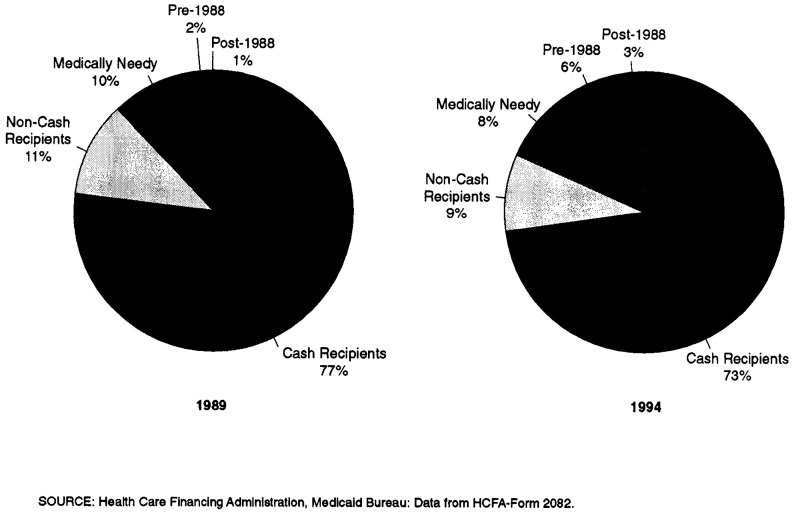
Medicaid eligibility is complex. Eligibility groups are reported by the states to HCFA in 5 categories: (1) categorically needy, receiving cash assistance; (2) categorically needy, not receiving cash assistance; (3) medically needy; (4) other coverage groups created by legislation prior to 1988; and (5) coverage groups created by the Medicare Catastrophic Coverage Act of 1988 and later legislation. In 1994, 73 percent of the Medicaid blind and disabled fell into the first group—categorically needy cash recipients. The remaining 27 percent qualified for Medicaid benefits through the medically needy program and other routes to eligibility (Figure 22).
Figure 20. Number of Medicaid Users, by Eligibility Group: 1975-94.
Figure 21. Growth in Medicaid Users, by Eligibility Group: 1975-94.
Figure 22. Maintenance Assistance Status of the Disabled in Medicaid: 1989 and 1994.
Medicaid Spending
The disabled, like the aged, are high users of Medicaid services. They make up only 15 percent of all Medicaid users, while their spending accounts for 39 percent of all program payments (Figure 23).
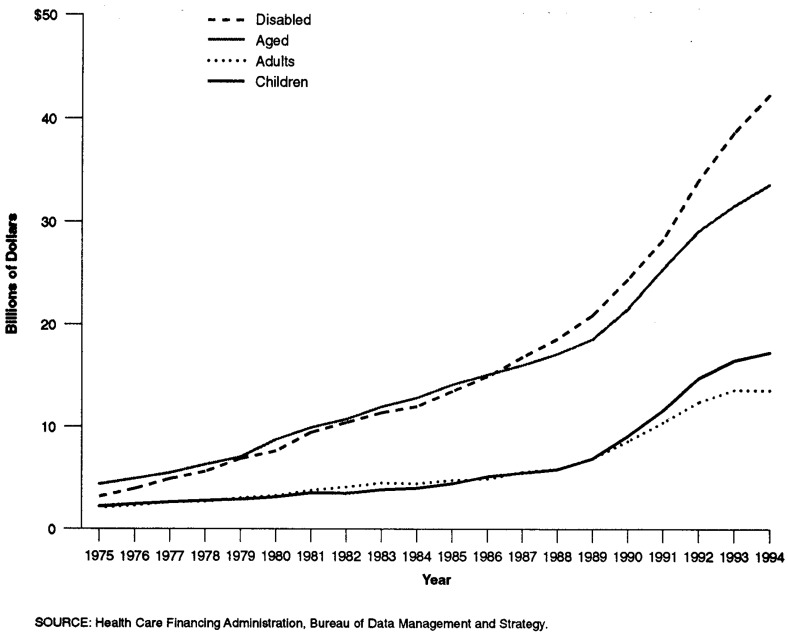
Total Medicaid payments made on behalf of Medicaid's disabled enrollees surpassed payments for all other eligibility groups. In 1994, Medicaid made payments of more than $42.2 billion on behalf of persons with disabilities (Figure 24).
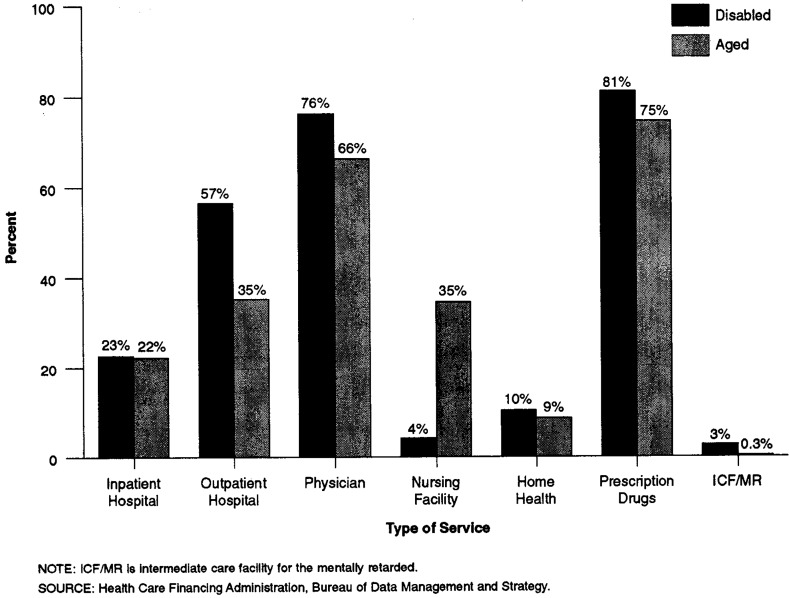
The Medicaid services most frequently used by the disabled and aged alike are: prescription drugs, physician services, and outpatient hospital services. Unlike the aged, nearly 35 percent of whom received Medicaid-financed nursing home care, only 4.2 percent of the disabled in Medicaid received nursing facility care. About 3 percent of the disabled received long-term care services in intermediate care facilities for the mentally retarded (ICFs/MR) (Figure 25).
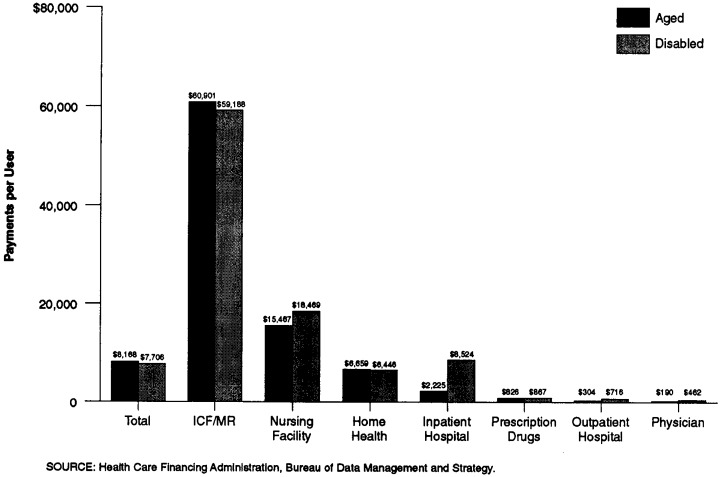
Medicaid payments on behalf of the disabled were $7,706 per user in 1993, somewhat less than the average Medicaid spending per elderly user of Medicaid services. Those using ICF/MR services were among the most expensive Medicaid enrollees. Average annual Medicaid spending for this group was about $60,000. Individuals with disabilities who received care in nursing homes had annual Medicaid spending of over $18,000 in 1993 (Figure 26).
Figure 23. Medicaid Population and Medicaid Payments, by Eligibility Group: 1994.
Figure 24. Medicaid Payments, by Eligibility Group: 1975-94.
Figure 25. Use of Medicaid Services by the Aged and Disabled, by Type of Service: 1994.
Figure 26. Medicaid Payments per Aged and Disabled User: 1993.
Characteristics of the SSI Disabled Population
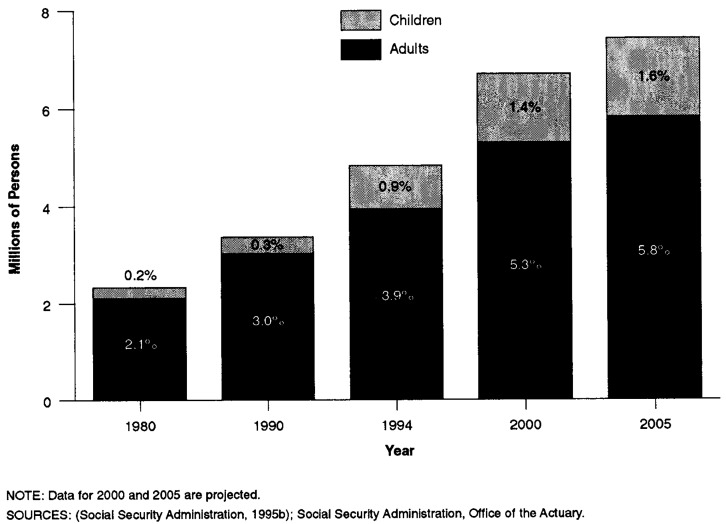
As Figure 22 shows, most of the disabled in Medicaid are categorically needy cash recipients. In most States, individuals with disabilities who are receiving SSI payments are automatically enrolled in Medicaid. The SSI disabled population is expected to grow from 4.8 million in 1994 to over 7.4 million individuals in 2005 (Figure 27).
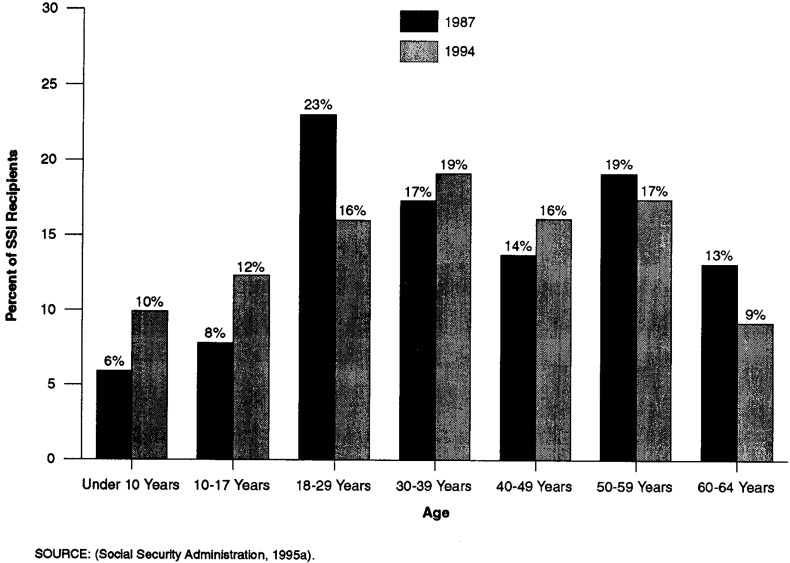
Younger recipients are a growing share of all SSI disabled recipients. The number of disabled children (17 years of age or under) receiving SSI has grown from 14 percent of the SSI disabled population in 1987 to 22 percent in 1994. Those 50 years of age or over have decreased as a share of disabled recipients from 32 percent in 1987 to 26 percent in 1994 (Figure 28).
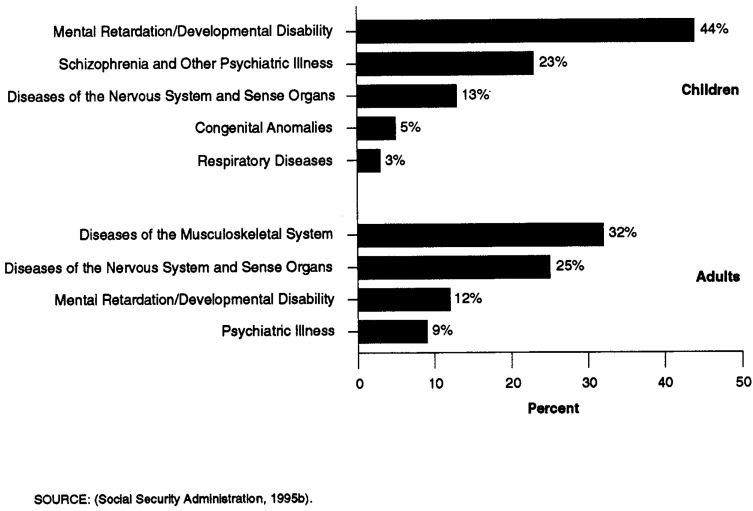
Mental impairments, including mental illness, mental retardation, and developmental disabilities, predominate among both the adult and child SSI populations. In 1994,67 percent of children and 57 percent of adults were disabled on the basis of a diagnosis of mental impairment (Figure 29).
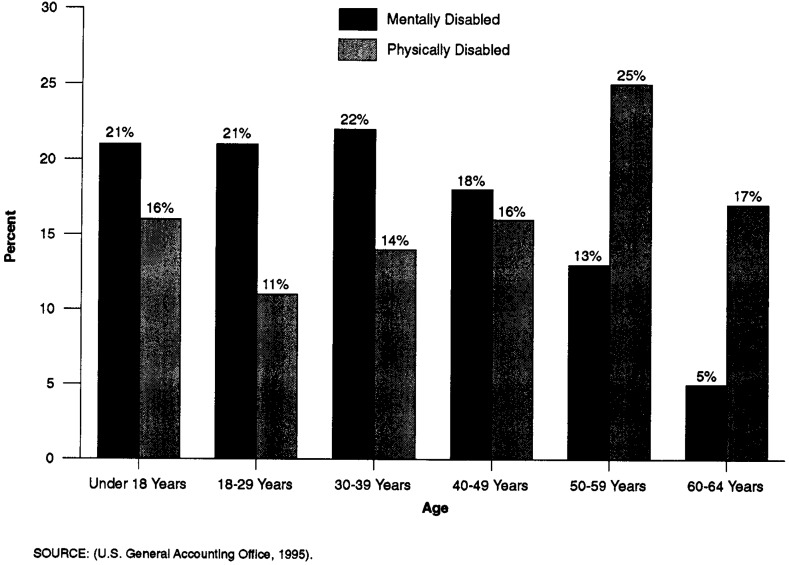
Mentally disabled adult recipients are younger, on average, than other adult recipients. Sixty-four percent of SSI recipients with mental disabilities are under 40 years of age, while only 41 percent of those with physical disabilities are under 40 years of age (Figure 30).
Figure 27. Projected Growth in the SSI Disabled Population.
Figure 28. Age Distribution of Disabled SSI Recipients: 1987 and 1994.
Figure 29. Primary Reason for Disability in Children and Adults Receiving SSI Payments: 1994.
Figure 30. Age Distribution of Mentally and Physically Disabled SSI Recipients: 1994.
Managed Care
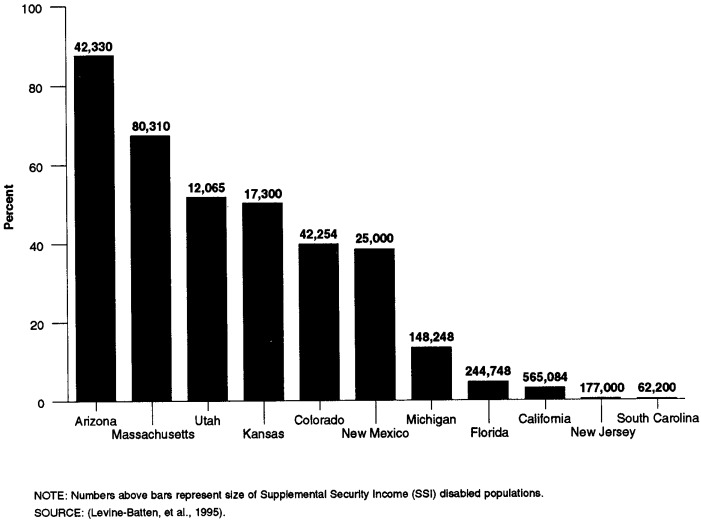
States vary in the extent to which they are enrolling their disabled populations in managed care for their acute-care services. Arizona enrolls the majority of its SSI disabled population in a mandatory managed care program. States like Massachusetts and Utah also have enrolled significant numbers of the disabled (Figure 31).
Figure 31. Percent of SSI Disabled Beneficiaries Enrolled In Medicaid Managed Care: Selected States.
Footnotes
The authors are with the Special Analysis Staff, Office of the Associate Administrator for Policy, Health Care Financing Administration (HCFA). The opinions expressed are those of the authors and do not necessarily reflect those of HCFA.
For a description of the Medicare Current Beneficiary Survey, see Adler (1994).
See National Academy of Social Insurance (19%) for a discussion of the factors explaining recent increases in the disability rolls.
Reprint Requests: Ellen O'Brien, Special Analysis Staff, Office of the Associate Administrator for Policy, Health Care Financing Administration, 325H Hubert H. Humphrey Building, 200 Independence Avenue, SW, Washington, DC 20201.
References
- Adler GS. A Profile of the Medicare Current Beneficiary Survey. Health Care Financing Review. 1994 Summer;15(4):153–163. [PMC free article] [PubMed] [Google Scholar]
- Levine-Batten H, Bachman S, Drainoni M, et al. Medicaid Capitated Managed Care Program for SSI Disabled. Baltimore, MD.: 1995. Final Report prepared under HCFA Cooperative Agreement Number 18-90096-1-01. [Google Scholar]
- National Academy of Social Insurance. Balancing Security and Opportunity: The Challenge of Disability Income Policy. Washington, DC.: 1996. Findings and Recommendations of the Disability Policy Panel. [PubMed] [Google Scholar]
- Health Care Financing Administration. Report to Congress: Monitoring the Impact of Medicare Physician Payment Reform on Utilization and Access. Washington, DC.: 1995. [Google Scholar]
- Social Security Administration. Annual Statistical Supplement to the Social Security Bulletin. Baltimore, MD.: 1995a. [Google Scholar]
- Social Security Administration. SSI Annual Statistical Report 1994. Office of Program Benefits Policy; Baltimore, MD.: 1995b. [Google Scholar]
- U.S. General Accounting Office. Supplemental Security Income. Washington, DC.: Jul, 1995. Pub. No. GAO/HEHS-95-137. [Google Scholar]


