Abstract
Estimating spending for prescription drugs has become increasingly difficult over the past 15 years as extensive changes have taken place within the retail prescription drug industry. Expenditures for prescription drugs in retail outlets grew rapidly during the 1980s and early 1990s. New retail outlets emerged and existing sites lost market share. New mechanisms for reimbursing drug purchases led to the flow of rebates between manufacturers and insurers, bypassing retailers. These and other major industry changes required the development of new estimating methodologies for tracking prescription drug expenditures within the National Health Accounts (NHA).
Introduction
Estimates of national expenditures for prescription drugs purchased in retail outlets as reported in the NHA amounted to $59.1 billion in 1994, 5.5 percent of all health care spending. The NHA are the Federal government's measure of health care spending in the United States. They are used to measure the economic resources devoted to health care, monitor changes over time, forecast national health care expenditures in the future, and evaluate the impact of proposed changes in programs administered by the Health Care Financing Administration (HCFA) on health care expenditures and the general economy. Estimates of expenditures for prescription drugs in the NHA include sales of human-use, dosage-form drugs, biologicals, and diagnostic products sold in various retail outlets which are not already included in other NHA categories.1 The value of prescription drugs provided to consumers by health care institutions (i.e., hospitals and nursing homes) or practitioners (i.e., physicians, dentists, and home health providers) are included in their respective categories within the NHA and excluded from the prescription drugs category. NHA expenditures for these products grew significantly faster after 1980 than before. From 1960 to 1980, retail spending for prescription drugs grew at an average annual rate of 7.8 percent. From 1980 to 1992, that rate increased to 11.9 percent annually. In 1993 and 1994, however, the rate of increase in prescription spending fell to 6.1 percent and 5.1 percent, respectively (Levit et al., 1996) (Table 1). This deceleration was driven by slower rates of growth in drug price. The growth rate of prescription drug prices as measured by the Consumer Price Index (CPI) fell from 10 percent in 1990 to 3.4 percent in 1994 (Levit et al., 1996).
Table 1. Expenditures for Prescription Drugs,1 by Source of Funds: Selected Years 1960-94.
| Source of Funds | 1962 | 1967 | 1972 | 1977 | 1982 | 1987 | 1992 | 1993 | 1994 |
|---|---|---|---|---|---|---|---|---|---|
| Amount in Billions | |||||||||
| Prescription Drugs | $3.0 | $4.2 | $6.3 | $9.2 | $15.0 | $26.5 | $46.6 | $49.4 | $51.9 |
| Average Annual Growth From Previous Year (in Percent) | 7 | 8 | 8 | 10 | 12 | 12 | 6 | 5 | |
| Out-of-Pocket Payments | 2.9 | 3.7 | 5.0 | 6.8 | 9.3 | 14.2 | 20.4 | 21.2 | 22.0 |
| Third-Party Payments | 0.1 | 0.5 | 1.3 | 2.4 | 5.7 | 12.3 | 26.2 | 28.2 | 30.0 |
| PHI | 0.0 | 0.2 | 0.6 | 1.3 | 3.7 | 8.1 | 18.0 | 19.1 | 20.0 |
| Medicaid | — | 0.2 | 0.6 | 1.0 | 1.7 | 3.4 | 6.7 | 7.7 | 8.4 |
| General Assistance | 0.0 | 0.0 | 0.0 | 0.1 | 0.2 | 0.5 | 0.9 | 0.9 | 1.0 |
| Other Government | 0.0 | 0.0 | 0.0 | 0.1 | 0.2 | 0.3 | 0.5 | 0.6 | 0.6 |
| Percentage Distribution by Source of Funds Within Each Category | |||||||||
| Prescription Drugs | 100 | 100 | 100 | 100 | 100 | 100 | 100 | 100 | 100 |
| Out-of-Pocket Payments | 95 | 88 | 80 | 73 | 62 | 54 | 44 | 43 | 42 |
| Third-Party Payments | 2 | 11 | 20 | 27 | 38 | 46 | 56 | 57 | 58 |
| PHI | 1 | 6 | 10 | 14 | 25 | 30 | 39 | 39 | 38 |
| Medicaid | — | 5 | 9 | 11 | 11 | 13 | 14 | 16 | 16 |
| General Assistance | 0 | 0 | 1 | 1 | 1 | 2 | 2 | 2 | 2 |
| Other Government | 1 | 1 | 1 | 1 | 1 | 1 | 1 | 1 | 1 |
This class of expenditure is limited to spending for products purchased in retail outlets. The value of drugs and other products provided by hospitals, nursing homes, or other health professionals is implicit in estimates of spending.
NOTES: PHI is private health care insurance. Numbers and percentages may not add to totals because of rounding. 0.0 denotes less than $50 million.
SOURCE: Health Care Financing Administration, Office of the Actuary: Data from the Office of National Health Statistics.
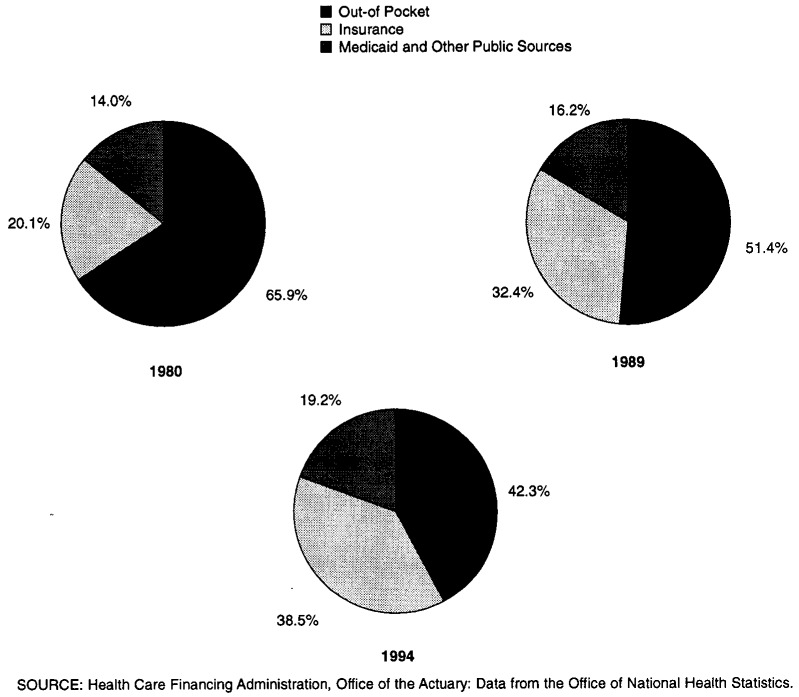
Sources of payment for prescription drugs purchased in retail outlets have also changed since 1980. In 1980, 66 percent of payments were made out of pocket and 32 percent were made through private health insurance and Medicaid. As recently as 1989, out-of-pocket payments still accounted for a larger percentage than did third-party payments. However, by 1994, out-of-pocket payments declined to 42 percent whereas payments by private health insurance, Medicaid, and general assistance increased to 57 percent (Figure 1).
Figure 1. Prescription Drug Spending by Type of Payer: 1980, 1989, and 1994.
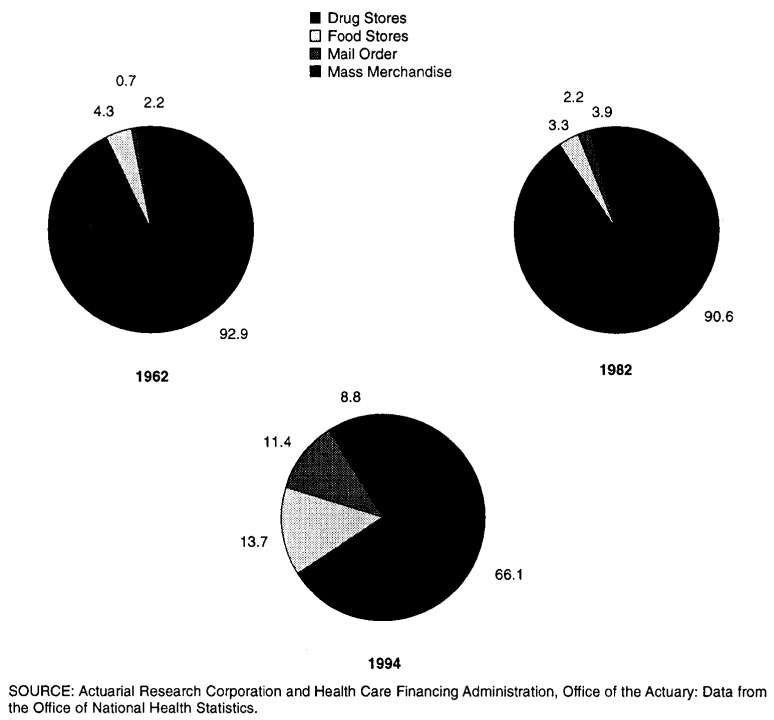
The retail prescription drug market also experienced change. Many retailers saw their profit margins on prescription drugs fall since 1980, whereas prescription sales as a proportion of total sales rose. The number of drug-store (primarily independent) pharmacies fell sharply, from approximately 53,000 in 1985 to 40,000 in 1995, a decrease of about 25 percent. At the same time, the number of other retail pharmacy outlets, including mail-order pharmacies, food-store pharmacies, and mass-merchandiser pharmacies increased significantly, as did their market share of prescription sales (Figure 2).
Figure 2. Percent of Prescription Drug Sales by Store Type: 1962, 1982, and 1994.
Increased competition from generic drugs,2 the increased prevalence of managed care, and the increased use of rebates by pharmaceutical manufacturers to gain, or guarantee, access to insured populations, made it increasingly difficult to measure spending in retail outlets for prescription drugs within the NHA Previous NHA estimates were based on a study conducted for the Pharmaceutical Manufacturers Association (PMA) by Actuarial Research Corporation (ARC) (Trapnell and Genuardi, 1987). This methodology, which included estimates through 1985, used manufacturers' domestic drug sales augmented by wholesale and retail markups and by inventory changes to arrive at final consumption by various classes of end users (hospitals, retail pharmacies, nursing homes etc.).
Changes in the retail prescription drug market and the growing importance of prescription drugs in health benefit packages compelled improvement in NHA prescription drug expenditure estimates. Old methodologies and data sources no longer appeared accurate enough for policy demands. New data sources were emerging that promised to enhance estimating capabilities. These developments prompted a research study to investigate and evaluate new data sources and develop improved estimates of national spending for prescription drugs. The remainder of this article discusses the results of this study—the new methodology used to estimate retail spending for prescription drugs, including estimation of rebates paid by pharmaceutical manufacturers to Medicaid and private third-party payers. It also explores the contribution of management of pharmacy benefits to changes currently underway in this industry.
Role of Managed Care
The concept of managed care arrived late to the prescription drug industry. It wasn't until the mid to late 1980s that pharmacy benefit administrators began to implement some of the same cost-cutting techniques commonly used for years in the administration of other types of health care benefits. Although expenditures for prescription drugs account for only a small portion of total health care expenditures (about 5.5 percent), the double-digit expenditure growth recorded throughout the 1980s prompted payers to find innovative ways to constrain further growth in drug outlays.
Managed care organizations (MCOs) such as health maintenance organizations (HMOs), preferred provider organizations (PPOs), and pharmacy benefit managers (PBMs) use a number of methods to control pharmacy costs for insured groups. These methods include formularies, drug utilization review, negotiated discounts with retail pharmacies and manufacturers, and incentives for use of generic drugs. With its emphasis on cost control, managed care has encouraged the growth of lower-cost distributors (i.e., mail-order firms, mass merchandisers, food-store pharmacies) of prescription drugs at the expense of higher-cost distributors (traditional drug store pharmacies).
The increased role of managed care in pharmacy benefits has also led to the use of rebates. Pharmaceutical manufacturers pay rebates to PBMs and other MCOs when their products are given preference on the formulary. Rebates began among private third-party payers in the late 1980s. In 1990, Congress mandated comparable rebates for Medicaid. There has been much debate concerning the effects of the Medicaid rebate program on the discounts obtained by private third-party payers, with some evidence that private third-party payer discounts have decreased as pharmaceutical manufacturers have reduced their best-price discounts in response to the Medicaid rebate program (Congressional Budget Office, 1996). However, the overall effect on private third-party payer rebates is difficult to determine. More insured groups may be obtaining discounts through managed care. Other groups which were previously receiving discounts may be able to obtain larger discounts closer to those obtained by the Medicaid program.
The pharmaceutical industry possesses two characteristics that make it particularly vulnerable to pressure from managed care. First, brand-name drugs which can be substituted for others in the same therapeutic class have become plentiful, as have generic drugs which compete with brand-name products. Second, the fixed cost structure of the drug industry with its up-front investment in research and development and smaller marginal production costs makes it worthwhile for manufacturers to pay rebates to those insurers capable of shifting market share.
The impact of rebates and discounts has become more ambiguous because of the recent merger and acquisition activity affecting the industry. Beginning in 1993, many of the largest drug makers acquired or formed alliances with some of the largest PBMs (Muirhead, 1994). Industry analysts are concerned about the influence drug manufacturers may have on their PBM partners' formulary decisions. Some doubt that PBMs will continue to negotiate the best price on behalf of plan members and instead will give preferential treatment to the drugs of their parent companies. Others view these relationships as an opportunity for increased competition. They maintain that the ultimate power is held by insured groups themselves. If a PBM no longer successfully performs in the area of cost containment, the insured group can always elect to do business with another PBM.
The issue of rebates is further complicated by recent lawsuits filed by groups of independent drug-store pharmacies, drug-store chains, and supermarket chains against pharmaceutical manufacturers. The suits accuse manufacturers of price discrimination and collusion because of the large discounts they offer to some HMOs, mail-order pharmacies, and hospitals which purchase large quantities of prescription drugs. The manufacturers argue that they are simply engaging in legal volume discounting. A tentative settlement among 12 manufacturers and approximately 40,000 independent pharmacies has been reached, but 8 other manufacturers rejected the settlement and are scheduled to go to trial in April 1996. The outcome of such a trial would determine whether manufacturers can continue to offer selective discounts to various distributors, or if they are required to set prices regardless of the volume purchased. Such a requirement would remove one of the primary advantages offered by managed care plans to insured groups attempting to control the cost of their pharmacy benefits.
Managed care has greatly impacted the drug industry. PBMs and other MCOs have transformed the historical linear relationships among manufacturers, wholesalers, and retailers into quite complicated arrangements. The restructuring of the drug industry in response to pressure from managed care has altered traditional methods of drug pricing used by manufacturers and has transformed the composition of retail outlets for drugs. These dramatic changes made it increasingly difficult to measure retail spending for prescription drugs in the NHA and prompted the exploration of new methods and data sources.
Methodology and Data Sources
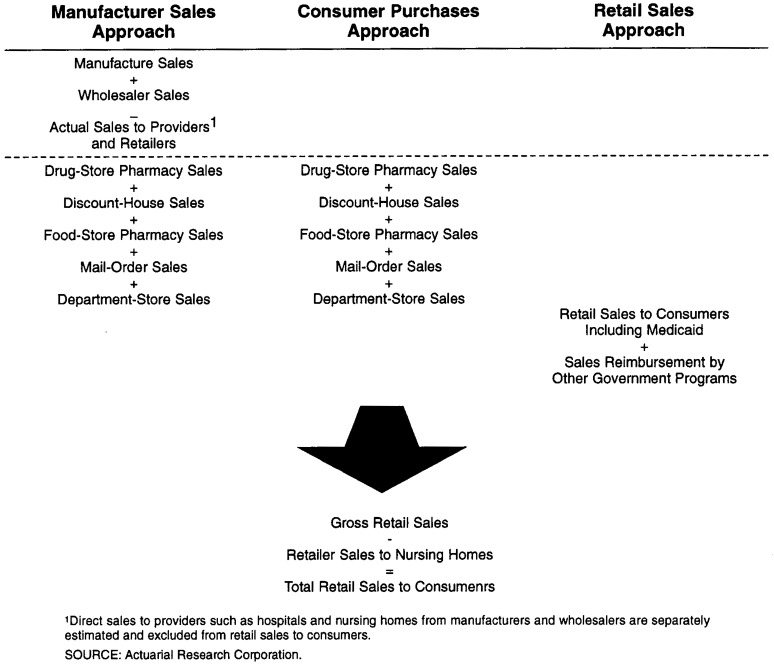
In 1994, HCFA initiated a study to expand and improve the methodology used in ARC's previous research to estimate retail spending for prescription drugs. This study incorporated a number of new or improved data sources and used three different methods to estimate national spending for prescription drugs. The first method, the manufacturers' sales approach, relied primarily on sales data collected from pharmaceutical manufacturers and summarized in the Pharmaceutical Research and Manufacturers of America (PhRMA, formerly PMA) Annual Survey. The second method, called the consumer purchases approach, used data gathered by IMS America through its survey of chain and independent drug store pharmacies and reported in its National Prescription Audit (NPA). The third general method, the retail sales approach, was based on estimates of personal consumption expenditures for prescription drugs sold by retail outlets, as reported by the U.S. Department of Commerce. Figure 3 summarizes the components of each of the three methodologies. Total national spending for prescription drugs includes purchases of drugs from all sites such as retail outlets and providers including hospitals, nursing homes, HMOs, and clinics. However, only estimates of national spending for prescription drugs purchased through retail outlets were incorporated by definition into the NHA.
Figure 3. Crosswalk Among Different Methodologies Used to Estimate National Spending for Prescription Drugs.
Manufacturers' Sales Approach
The manufacturers' sales approach constructs national spending for prescription drugs by estimating the value added at each stage of production and distribution within the industry. The primary steps in this approach are: (1) determine the total receipts of pharmaceutical manufacturers for prescription drugs produced in a given year, (2) estimate prescription drug purchases by wholesalers and for each type of health care provider and retail outlet; (3) adjust purchases of prescription drugs by wholesalers, retailers, and health care providers for the effect of inventory accumulation; and (4) add the markups charged by wholesalers, retailers, and health care providers to the adjusted purchases estimated in step three. The primary data sources used in the manufacturers' sales approach were: the PhRMA Annual Survey; the National Wholesale Druggist Association (NWDA) Annual Operating Survey; the Census of Retail Trade; the Lilly Digest; and the IMS Drug Distribution Database (DDD).
The PhRMA Annual Survey provides estimates of manufacturers' domestic sales of prescription drugs, in total and by type of customer, for direct human use in final dosage form based on sales reported by PhRMA member companies. Sales of prescription drugs manufactured by non-member companies (primarily firms that produce only generic drugs) are estimated by PhRMA using data from external sources. To estimate total manufacturers' sales of prescription drugs in the United States, a number of adjustments must be made to the total sales estimated in the PhRMA report These adjustments include deducting cash discounts, deducting sales of intermediate products, deducting sales of non-prescription products in some years, and accounting for transportation and warehousing costs each year. Application of these adjustments results in estimates of manufacturers' sales of prescription drugs for domestic consumption.
The next steps in the process were to estimate: (1) prescription drug sales by manufacturers to wholesalers, (2) the value added by wholesalers, and (3) prescription drug purchases by various health care providers and retail outlets. Manufacturers' sales to wholesalers were estimated using data from the PhRMA survey. Wholesaler purchases were then adjusted for inventory accumulation and marked up, using data from the NWDA Annual Operating Survey, to estimate total wholesaler sales of prescription drugs to health care providers and retail outlets. Purchases by Federal hospitals and other Federal facilities were estimated using data from the PhRMA survey, whereas purchases by other health care providers (community hospitals, HMOs, nursing homes, practitioners, and clinics) were estimated using a number of data sources, including the U.S. Hospital Audit conducted by IMS America (1994), economic data compiled by the Bureau of Economic Analysis, the IMS DDD (IMS America, 1995) data base, pharmaceutical industry trade publications, and data compiled by the SMG Marketing Group, Inc. (1993).
Estimates of prescription drug purchases by some retailers (grocery-store pharmacies, mail-order pharmacies, and mass-merchandiser pharmacies) for 1960-87 were derived using data from the Census of Retail Trade (CRT), conducted by the Census Bureau every 5 years since 1967.3 However, because the CRT for 1992 was not available when this research was conducted, prescription drug purchases by these same retailers for 1988-93 were based on data from the IMS DDD data base. This data base is used to measure manufacturer sales of prescription drug products, whether purchased directly by a retailer or medical care provider, or indirectly through a wholesaler. The DDD collects information directly from the billing systems of drug manufacturers and from warehouses.
The final component of prescription drug purchases by retail outlets is drug-store pharmacies. These purchases were calculated as the residual after purchases by all other retailers and by health care providers were subtracted from total manufacturer and wholesaler sales of prescription drugs.
The final step in estimating national spending for prescription drugs is to estimate the markups imposed by each class of health care provider and retailer before they dispense or sell their prescription drugs to consumers. The effects of inventory accumulation also need to be taken into account The primary source of data for this information was the Lilly Digest, which summarizes operating information (e.g., gross profit margin and inventory ratio) derived from voluntary data submissions by independent community pharmacies throughout the country.
Consumer Purchases Approach
The consumer purchases approach for estimating national spending for prescription drugs differs from the manufacturers' sales approach in the way that the primary component, consumer purchases of prescription drugs from drug store pharmacies, is estimated. Under the manufacturers' sales approach, consumer purchases of prescription drugs from drug store pharmacies are estimated as a residual; under the consumer purchases approach they are estimated directly using the National Prescription Audit (NPA) produced by IMS America.4 These data are used to produce projections of the number of prescriptions dispensed and their dollar volume. The data from the NPA are the basis for estimates of spending for prescription drugs purchased through retail outlets, including chain and independent pharmacies, food-store pharmacies, and mass merchandisers.
Because the NPA does not provide data for all types of retail outlets for all of the years to be estimated, separate estimates must be developed for the years not covered by the NPA Therefore, the consumer purchases approach uses the estimates produced in the manufacturers' sales approach to estimate spending for prescription drugs obtained through mass merchandisers for 1960-85, through food store pharmacies for 1960-90, and through mail-order firms for 1960-94.
Retail Sales Approach
The third method of estimating total spending for prescription drugs, the retail sales approach, is based primarily on data compiled and produced by the Department of Commerce on sales of prescription drugs by retail outlets to the public. In particular, this approach used estimated prescription drug sales by retail outlets reported in the personal consumption expenditures (PCE) component of the national income and product accounts (NIPA). The PCE component of the NIPA measures the goods and services purchased by the household sector.5 The PCE estimates of prescription drug sales by retail outlets include sales reimbursed by Medicaid, but not those reimbursed by other State and local assistance programs (e.g., worker's compensation, State temporary disability programs, maternal and child health programs, etc.). Therefore, estimates of retail sales reimbursed by public programs other than Medicaid must be added to PCE estimates of retail sales.
Comparison and Results
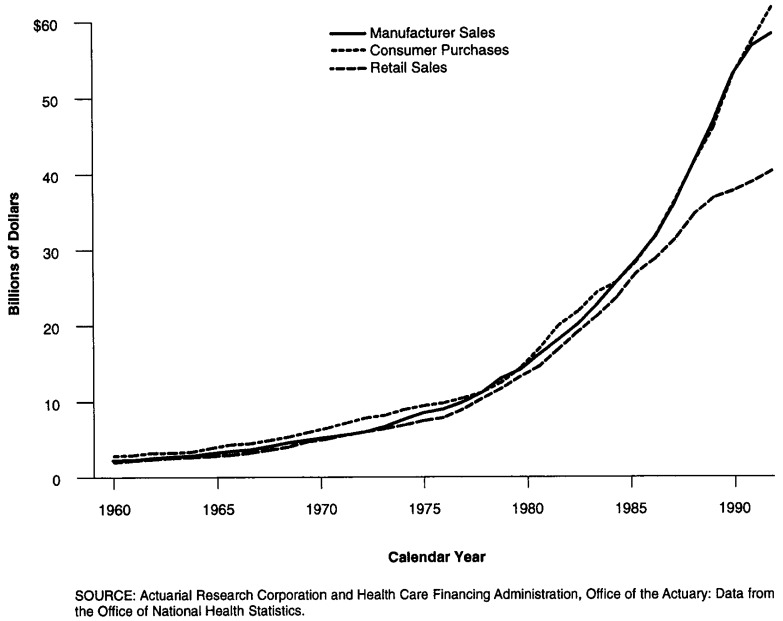
Each method previously described focuses on a slightly different component of the distribution system for prescription drugs. The results shown on Figure 4 produce similar results until 1982 when a slow-down in the rate of growth occurs in the retail sales model. With the exception of estimates for 1994, both the manufacturers sales approach and the consumer purchases approach record similar expenditure estimates and rates of change.
Figure 4. Results of Three Models for Estimating Prescription Drug Expenditures: 1960-94.
The retail sales approach produces the lowest expenditure estimates and year-to-year changes, especially after 1987. This method relies on data compiled and produced by the Department of Commerce on prescription drug sales by retail outlets to the public. The main data source for this method, the CRT, is only conducted every five years; in addition, a substantial lag exists between when the CRT is conducted and data reported (for example, the data from the 1987 Census of Retail Trade were not published until June 1990).
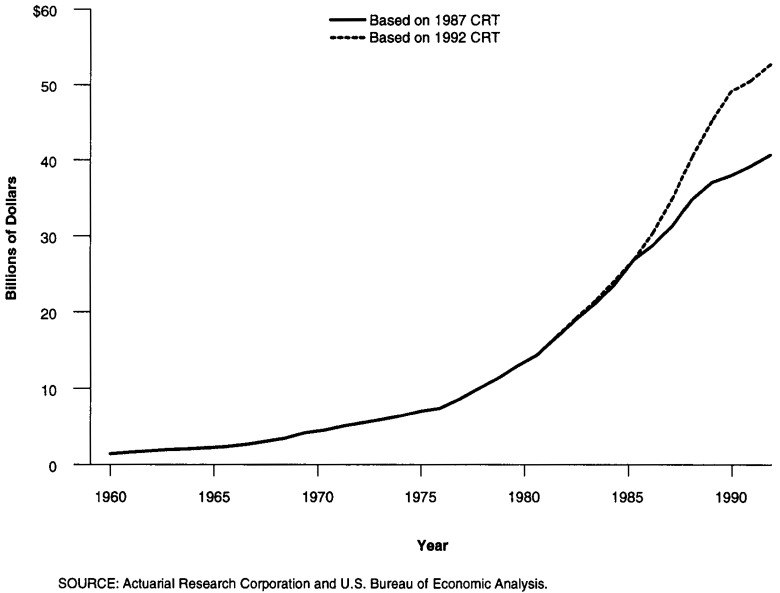
For intervening years, product-specific sales data by store type are not available. In missing years, total store sales are used to extrapolate prescription spending. During periods of rapid change in outlet sites, the results from the retail sales approach will be flawed because estimates are based on an outdated market structure. During the 1980s, when sales for prescription drugs shifted away from traditional drug stores, sales of drugs in food stores, mass merchandisers, and mail-order firms were understated using this approach. However, it does produce credible estimates for years up to the last CRT. With the data from the 1992 CRT now available, the Department of Commerce has revised their estimates for PCE upward for the period since 1987 (Figure 5). These estimates are now similar to the estimates produced by the other two methods.
Figure 5. Total Rx Spending—Retail Sales Approach.
The consumer purchases approach produces results comparable with those in the manufacturer's sales approach from 1985 through 1993, when the majority of retail sales data becomes available from IMS America. The IMS source captures retail sales data for drug-store pharmacies beginning in 1985; for mass merchandisers beginning in 1986; and for food-store pharmacies beginning in 1991. Although the NPA collects data on the number of prescriptions sold through mail-order firms, the value of those sales are not reported. The NPA collects data from 20,000 pharmacies which submit computerized data and are randomly selected from a sample of more than 50,000 pharmacies nationwide.
The manufacturers' sales approach relies on the value of manufacturers' shipments as reported in the PhRMA Annual Survey—a survey conducted since the 1950s and whose member companies represent approximately 91 percent of total domestic sales, a near census. Furthermore, manufacturers are required to maintain accurate financial data on their drug shipments to comply with regulatory requirements and accounting purposes. The detailed financial information reported from a near census of domestic manufacturers makes the Annual Survey one of the most reliable. Despite potential errors that could result from flawed inventory change ratios and wholesale and retail markups, this method appears to track spending consistently with the CRT.
The NHA used the manufacturers' sales method to estimate years from the most recent economic census. Although the consumer purchases approach and manufacturers' sales approach yielded similar results, the difference observed for 1994 will require another year of data to determine whether spending growth became more moderate as indicated by manufacturers' shipments or whether increases in expenditure growth continue unabated as indicated by the consumer purchases approach.
Estimates of Medicaid and Private Third-Party Rebates
The next step in estimating national spending for prescription drugs involves estimating the level of rebates on prescription drug purchases each year. Such rebates reimbursed by third-party payers have become prevalent during the past seven years, as managed care programs have grown in both number and size. Although rebates for private third-party payers existed before 1989, they were relatively small.
A rebate allows purchasers with significant buying power to reduce the purchase price of prescriptions by negotiating discounts with a manufacturer. Beginning in 1989, managed care programs began using their negotiating strength to demand larger rebates. The large rebates obtained by managed care programs caught the attention of State Medicaid programs, which were concerned about their costs for covering prescription drugs. Congress included a provision in the Omnibus Budget Reconciliation Act (OBRA) of 1990 requiring drug manufacturers to give Medicaid rebates for outpatient prescription drugs based on the lowest prices available to any purchaser (with some exceptions). In exchange, OBRA required Medicaid to cover, also with some exceptions, all outpatient prescription drugs of a manufacturer who agreed to provide rebates. As a result, Medicaid began receiving rebates on prescription drug purchases in 1991.
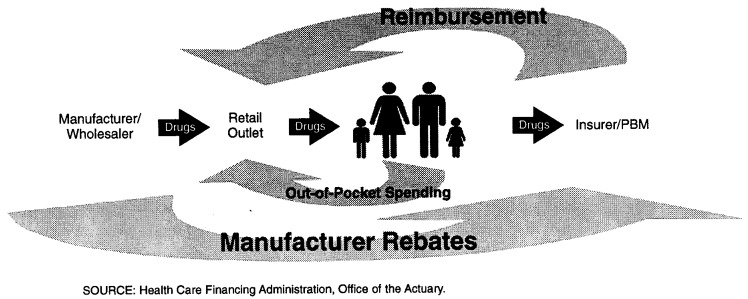
The rebates obtained by Medicaid and private third-party payers from manufacturers reduce the level of third-party expenditures for prescription drugs (Figure 6). It is this reduced benefit payment by third parties that are recorded in the NHA. Rebates also lower total expenditures for drugs as recorded in the NHA below the level of payment received by retailers.
Figure 6. Flow of Dollars in the Prescription Drug Market.
Estimating Third-Party Rebates
None of the previously cited data sources used to produce the estimates of national spending for prescription drugs measure or account for either Medicaid or private third-party rebates. Therefore, it was necessary to estimate the level of these rebates each year and subtract the rebates from estimated retail spending.
The level of rebates paid by manufacturers to PBMs and other MCOs is sensitive information and difficult to ascertain. The level of manufacturer rebates is dependent upon the abilities of the PBM or MCO to shift market share to certain brand-name drugs. Once that ability is established, rebates are calculated based on drug ingredient cost. Although data on the average rebate are proprietary, information on the top 100 most commonly prescribed drugs for Medicaid suggest private rebates in the range of 24 percent of prescription sales price.
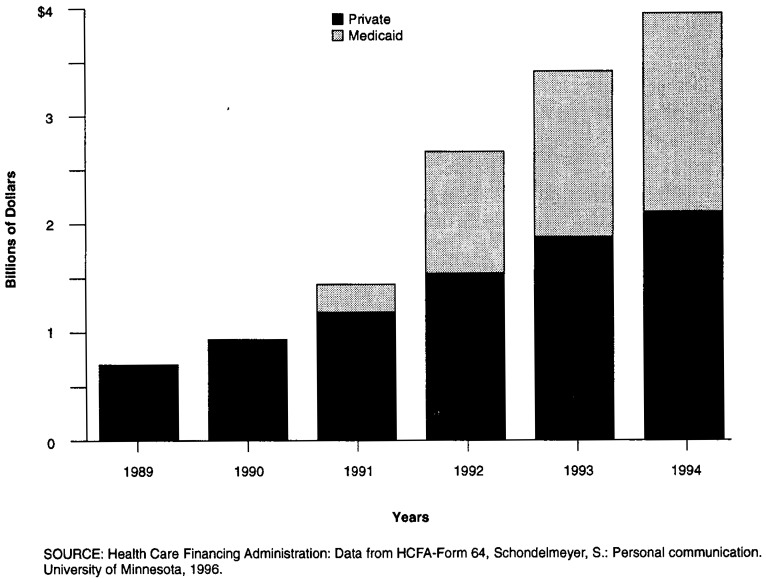
The Medicaid rebate program began late in calendar year 1991, accumulating rebates of only $251 million. Medicaid rebates grew from $1.1 billion in 1992, to $1.5 billion in 1993 and $1.7 billion in 1994 (Data from HCFA-Form 64). Rebates paid to private third-party plans began earlier and accounted for $0.7 billion dollars in 1989, tripling in 5 years to reach $2.1 billion in 1994 (Figure 7).
Figure 7. Manufacturer Rebates Paid to Third-Party Plans.
Conclusion
In recent years, the pharmaceutical industry has been in the midst of great structural change. Increased availability of generics, shifting market shares among retail outlets and expansion of third-party payers responsible for financing prescription purchases increased competition within the prescription marketplace. In the late 1980s and early 1990s, rapidly rising drug prices forced government and private insurers to look for ways of controlling prescription drug spending growth. Government reacted by enacting Medicaid legislation that required “best” prices for Medicaid recipients. Private insurers increasingly utilized PBMs to negotiate the best price for pharmaceutical manufacturers products. This article has examined three various methods used by the NHA to measure changes in expenditures for prescription drugs during this tumultuous period. Improved data sources and estimating techniques were developed including methods to estimate private third-party rebates.
Table 2. Retail Sales of Prescription Drugs: Results of Three Estimation Models, Selected Calendar Years 1962-94.
| Methods | 1962 | 1967 | 1972 | 1977 | 1982 | 1987 | 1992 | 1993 | 1994 |
|---|---|---|---|---|---|---|---|---|---|
| Amount in Millions | |||||||||
| Manufacturers' Sales Model | 2,517 | 3,645 | 5,576 | 8,979 | 16,174 | 28,554 | 52,948 | 56,742 | 58,313 |
| Consumer Purchases Model | 3,216 | 4,439 | 7,170 | 9,772 | 16,889 | 28,373 | 52,812 | 57,405 | 61,730 |
| Retail Sales Model | 2,367 | 3,205 | 5,556 | 7,836 | 14,610 | 26,885 | 37,670 | 38,887 | 40,322 |
| Average Annual Percent Change From Previous Year | |||||||||
| Manufacturers' Sales Model | — | 7.7 | 8.9 | 10.0 | 12.5 | 12.0 | 13.1 | 7.2 | 2.8 |
| Consumer Purchases Model | — | 6.7 | 10.1 | 6.4 | 11.6 | 10.9 | 13.2 | 8.7 | 7.5 |
| Retail Sales Model | — | 6.3 | 11.6 | 7.1 | 13.3 | 13.0 | 7.0 | 3.2 | 3.7 |
SOURCE: Actuarial Research Corporation and Health Care Financing Administration, Office of the Actuary: Data from the Office of National Health Statistics.
Acknowledgments
We would like to thank the following for their helpful comments: Katherine Levit and Daniel Waldo of HCFA; Stephen Schondlemeyer, PhD., Prime Institute, University of Minnesota; Gary Persinger and Timothy Brogan from Pharmaceutical Research and Manufacturers of America; Paul Wilson and Len Force of IMS America.
Footnotes
Gordon R. Trapnell is president and James S. Genuardi is senior research analyst of Actuarial Research Corporation. Jean M. Stiller is with the Office of the Actuary, HCFA. The opinions expressed are those of the authors and do not necessarily reflect the opinions of Actuarial Research Corporation or HCFA.
Retail sales to nursing homes, hospitals, physicians, or free-standing clinics are excluded from the prescription drug product category.
The Drug Price Competition and Patent Term Restoration Act of 1984 (Waxman-Hatch Act) encouraged the introduction of low-cost generic drugs to compete with brand-name drugs. The growth in generic sales is expected to increase over the next 10 years, as 60 major pharmaceutical products (accounting for $40 billion in 1994 sales) are scheduled to come off patent.
In a report entitled Merchandise Line Sales, sales data collected from establishments primarily engaged in selling merchandise for personal or household consumption are tabulated by type of retailer and type of merchandise (U.S. Department of Commerce, 1992). Drug sales are disaggregated into three merchandise categories—prescription; non-prescription; and vitamins, minerals, and dietary supplements. The types of retailers in the report include drug stores, proprietary stores, grocery stores, mass merchandisers, mail-order firms, and discount stores.
The NPA data are collected from a panel of 20,000 pharmacies which submit computerized data for every new and refill prescription dispensed.
The source data used to calculate the PCE are complete only for benchmark years, i.e., years in which the Bureau of Economic Analysis produces benchmark input-output accounts used to establish the level of PCE and its components during a comprehensive revision. These accounts are prepared for years in which the Census Bureau conducts the quinquennial economic censuses—1987 was the most recent. Most of the PCE estimates for non-benchmark years are prepared by interpolation and extrapolation, using indicator series.
Reprint Requests: Anna Long, Office of National Health Statistics, Room N3-02-02, 7500 Security Boulevard, Baltimore, MD 21244-1850.
References
- Cohen L, Tanouye E. Drug Makers Set to Pay $600 Million to Settle Lawsuit by Pharmacies. Wall Street Journal. 1996 Jan 18;:1. [Google Scholar]
- Congressional Budget Office. How the Medicaid Rebate on Prescription Drugs Affects Pricing in the Pharmaceutical Industry. Washington, DC.: Jan, 1996. [Google Scholar]
- Congressional Budget Office. How Health Care Reform Affects Pharmaceutical Research and Development. Washington, DC.: Jun, 1994. [Google Scholar]
- Day K. The Washington Post. Washington Business Section; Feb 26, 1996. A Bitter Pill to Swallow, Small Pharmacies Struggling as Profit Margins Shrink; p. 1. [Google Scholar]
- Health Care Financing Administration. 1995. Calculations performed by the Office of the Actuary based on Medicaid drug rebate information file from the Medicaid Bureau. Unpublished. [Google Scholar]
- IMS America. National Prescription Audit. Plymouth Meeting, PA.: Aug 21, 1995. [Google Scholar]
- IMS America. US Hospital Audit. Plymouth Meeting, PA.: 1994. [Google Scholar]
- Levit KR, Sensenig AL, Cowan CA. National Health Expenditures, 1994. Health Care Financing Review. 1996 Spring;17(3) [PMC free article] [PubMed] [Google Scholar]
- National Association of Retail Druggists—Lilly Digest. Survey of 1993 Operational Data. Alexandria, VA: 1994. pp. 23–24. [Google Scholar]
- Muirhead G. The ABC's of PBMs. Drug Topics. 1994 Sep 5;:67–79. [Google Scholar]
- Comptroller General of the United States. Pharmacy Benefit Managers: Early Results on Ventures With Drug Manufacturers. Washington, DC.: U.S. Government Accounting Office; Nov, 1995. [Google Scholar]
- Pharmaceutical Research and Manufacturers of America. Annual Survey 1988-90. Washington, D.C.: 1990. p. 9. Pharmaceutical Manufactures Association Report. [Google Scholar]
- SMG Marketing Group, Inc. HMO Data. Chicago, IL: 1993. [Google Scholar]
- Trapnell GR, Genuardi JS. Consumer Expenditures for Prescription Drugs 1971-1985. Annandale, VA: Actuarial Research Corporation; Feb, 1987. [Google Scholar]
- Trapnell GR, Genuardi JS. National Health Accounts Drug Study. Annandale, VA.: 1994. Contract Number 500-94-0004. Prepared for the Health Care Financing Administration. [Google Scholar]
- U.S. Bureau of Labor Statistics. Consumer Price Index. Washington: U.S. Government Printing Office; 1960-90. U.S. Department of Labor. [Google Scholar]
- U.S. Department of Commerce. Personal Consumption Expenditures. Washington: U.S. Government Printing Office; 1996. Bureau of Economic Analysis. [Google Scholar]
- U.S. Department of Commerce. Merchandise Line Sales. Washington: U.S. Government Printing Office; 1992. Bureau of the Census. [Google Scholar]


