Introduction
In marking Medicare's 30th year in operation, it is fitting to focus on the program's successes. The fiscal pressures facing Medicare on both its own financing base and that of the Federal Government as a whole, and the rapid changes occurring elsewhere in the health care system, have led to a raft of criticisms of the program in recent years. Although Medicare could certainly be improved, pausing to reflect on the positive aspects of the program can offer some balance to the current debate on Medicare's future.
Medicare is the largest public health program in the United States, providing the major source of insurance for the acute medical care needs of elderly and disabled persons. Its administrative costs are low, and it is popular with both its beneficiaries and the population as a whole. It has delivered on its promises. The success of Medicare from the perspective of older Americans can be summarized in four broad areas.
Universal Coverage
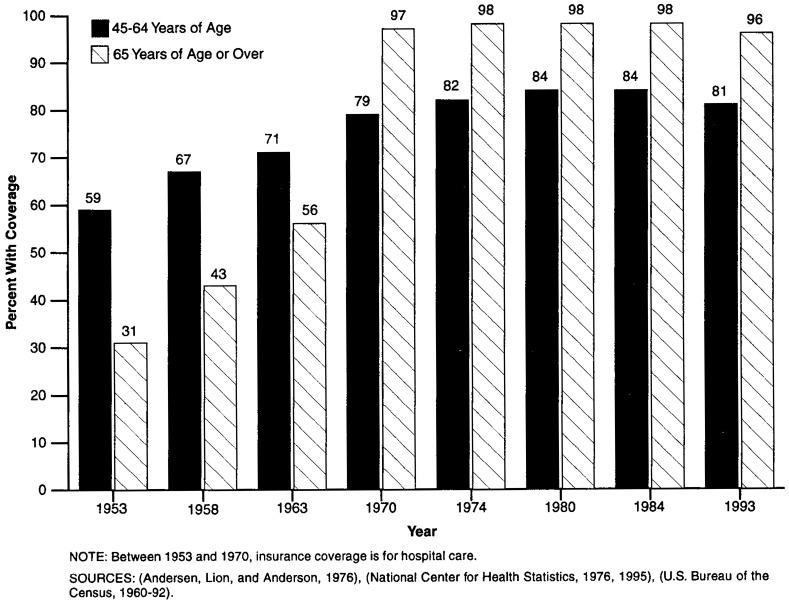
The Medicare program has achieved nearly universal coverage for persons 65 years of age or over—a major achievement on behalf of older Americans. When Medicare was introduced in 1965, only a little more than one-half of older persons had even hospital insurance, and elderly persons were considerably less well insured than younger families. For example, in 1963, just 56 percent of all persons 65 years of age or over had insurance against the costs of hospital care, compared with 75 percent of those 35-44 years of age and 71 percent of those 45-54 years of age (Andersen, Lion, and Anderson, 1976). But that share of the population covered rose immediately for those 65 years of age or over upon the introduction of Medicare. As shown in Figure 1, by 1970, the proportion of the population covered by insurance had increased to 97 percent of older Americans, while rising only modestly for younger persons. Since then, Medicare has steadily remained at around 97 percent of persons 65 years of age or over, while private coverage of younger persons has actually declined.1
Figure 1. Percent of Persons in Selected Age Groups Having Insurance Coverage: Selected Years, 1953-93.
Although attention is now focusing appropriately on future growth in the beneficiary population, Medicare has already successfully absorbed a doubling of the number of people it serves in its first 30 years. That is, Medicare has expanded from 19.1 million elderly beneficiaries in 1966 to 33.4 million elderly and 4.8 million disabled persons in 1996 (Health Care Financing Administration, 1996). The share of the U.S. population now covered by Medicare stands at 14.3 percent, up from 9.7 percent in 1966 (U.S. Bureau of the Census, 1994). And by 2020, Medicare's share of the population will reach 18.4 percent. Thus, each year since its inception, Medicare has played an ever-more-important role in the overall system of health insurance in the United States. And that role is projected to rise steadily in the future.
For those eligible, coverage cannot be lost as beneficiaries get older or sicker, or face other changes of status such as widowhood or retirement. Thus, in addition to the share of persons covered, these protections for beneficiaries give Medicare a substantial advantage over our system of private insurance coverage. The employer-based system for younger workers has many more gaps in the certainty of coverage and continuity over time. Coverage is not fully portable for many Americans, despite recent legislation. At best, younger workers obtain coverage through a new plan if they change jobs, often resulting in discontinuities in care when it becomes necessary to choose new doctors, hospitals, and other providers of services. When workers move, new plans may be less generous or more restrictive than the previous plans. At worst, coverage for those with health problems may be denied for a period of time or new coverage may not be available at all. Medicare, on the other hand, offers some choices through its health maintenance organization (HMO) option, but people can always remain in the traditional program and are free to switch back and forth even when serious health problems arise.
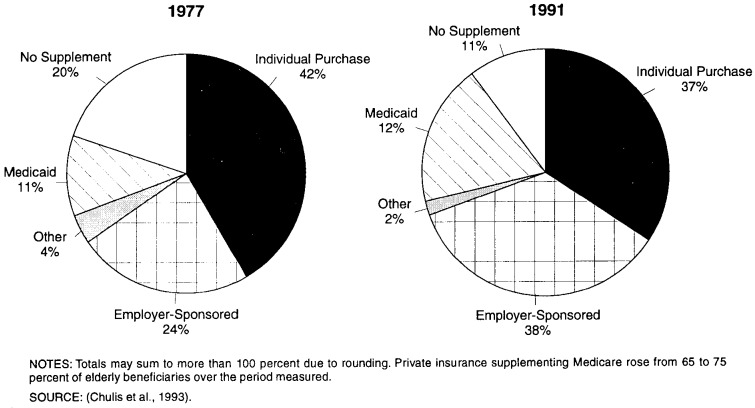
Medicare's presence also has stimulated the supplemental insurance market for this population (Figure 2). Almost from the beginning, private insurers have been willing to supplement Medicare, although they had not been willing to serve as primary insurers. This supplemental coverage extends beneficiaries' insurance protection, because the Medicare program offers a limited benefit package. But the willingness of private insurers to write such policies should not be taken as an indication that all would be willing to take on comprehensive insurance for everyone in this group. Nor are employers willing to foot the bill for unlimited retiree coverage.2 Rather, Medicare's basic coverage limits the risks for the private sector, which then is willing to fill in the gaps. Even this supplemental coverage is limited in terms of the ability of beneficiaries to move to new insurers after the initial period of open enrollment, and such coverage is often not available at all for disabled Medicare beneficiaries.
Figure 2. Percent of Elderly Persons With Health Insurance Supplementing Medicare: 1977 and 1991.
One of the consequences of the universal coverage that Medicare has achieved is also the common stake that many people feel in the system. Medicare remains one of the most popular of Federal programs. It has delivered on its original promise to change the nature of health care access for older Americans, and it has continued to serve its role as the primary insurer of acute health care services for those Americans who are least likely to be attractive to private companies.
Financial Relief
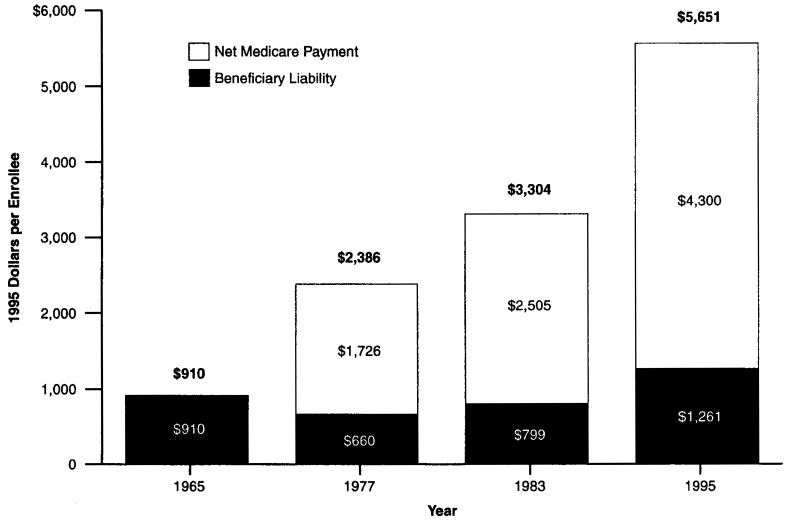
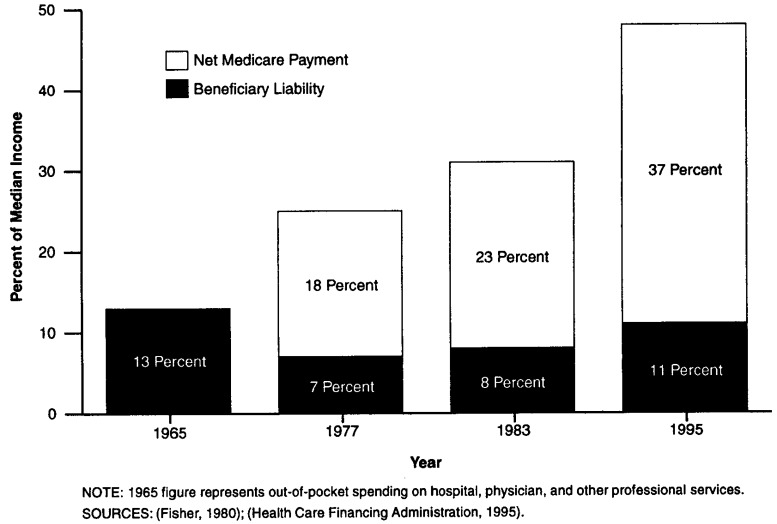
Although the costs of health care have gone up steadily over time, and the elderly pay a substantial share of their incomes toward these costs, Medicare still has brought considerable relief from the costs of care to its beneficiaries. Certainly without Medicare, the costs of care to older persons would be much higher than they are today. In 1995, Medicare expenditures averaged $5,561 per beneficiary—$4,300 of which was paid by Medicare. The remaining $1,261 represented the liability for beneficiaries in terms of Part B premiums, copayments, and deductibles (Figure 3). This liability averages about 11 percent of the income of a typical elderly beneficiary in 1995 (Figure 4).3 If the whole amount of Medicare spending were charged to beneficiaries, it would have consumed 47 percent of the median elderly person's income.
Figure 3. Per Capita Medicare Expenditures1: Net Medicare Payment and Beneficiary Liability: Selected Years, 1965-95.
1 Adjusted for inflation.
NOTES: 1965 figure represents out-of-pocket spending on hospital, physician, and other professional services. Bolded numbers at top of columns represent total per capita Medicare expenditures.
SOURCES: (Fisher, 1980), (Health Care Financing Administration, 1995).
Figure 4. Net Medicare Payment and Beneficiary Liability as a Percent of Median Income for the Elderly: Selected Years, 1965-95.
Compare this share with the 1965 out-of-pocket spending of an elderly person of $910, or 13 percent of the typical older person's income. The effects of health care inflation and the use of expanded services have driven up the costs of care faster than the incomes of the elderly otherwise could have absorbed. Although total expenditures on all these services would likely be lower in the absence of Medicare, the savings to individuals are certainly substantial, cutting at least by half (and likely by even more) the share of income beneficiaries devoted to these services.
Although many analysts cite problems faced by the elderly from continuing high out-of-pocket spending, this is not because Medicare is doing very little but rather because the costs of health care are so large. For all Americans, spending on health care has risen substantially since 1965, and Medicare has shielded its beneficiaries from a substantial portion of that increase.
The large risk pool created by Medicare means that out-of-pocket costs for vulnerable groups are lower than they would otherwise be. Particularly in the case of Part B premiums, all beneficiaries pay the same monthly amount for Part B coverage. The very old and the sick would face much higher premiums in an environment with no cross-subsidies. That is, the Part B premium represents about 9.5 percent of the costs of total Medicare services received by Medicare beneficiaries. But for those 80 years of age or over, the Part B premium pays for only about 7.5 percent of benefits received.
Over time, Medicare has held the line on payments to providers of care, particularly hospitals and physicians, resulting in lower cost-sharing than would otherwise be the case. For example, coinsurance for physician services is 20 percent of what Medicare deems reasonable, and Medicare's fees tend to be below what physicians and hospitals charge others. Limits on balance billing and pressures on physicians to accept Medicare's fee as the total amount charged have also kept cost-sharing lower than it would otherwise be. In fact, balance-billing burdens on Medicare beneficiaries have declined from a high of $89 per enrollee in 1985 to just $15 in 1993 (Health Care Financing Administration, 1995).
Attention to the services not covered by Medicare often distracts from its benefits. Medicare does require high copayments and deductibles, and its lack of coverage of prescription drugs, long-term care, and other services means that older and disabled persons are still left with substantial burdens. But in counting Medicare's successes, it is crucial to recognize the high costs of the services covered. Indeed, because many persons also have supplemental coverage, they are often unaware of exactly what share of their health care costs are paid by what source. Medicare has always paid a larger share of the average beneficiary's expenses than private supplemental coverage, a fact not recognized by many older beneficiaries.
Expanded Access
One test of whether an insurance program expands not just insurance coverage but access to care rests on whether the most vulnerable beneficiaries receive benefits. When the Medicare legislation was passed in 1965, there was concern that providers of services would not accept Medicare beneficiaries or would provide substandard care (Moon, 1996). But the program proved to be remarkably successful from the beginning. Large numbers of the elderly enrolled, and use of services expanded rapidly. There was no noticeable boycott by health care providers. In the first 3 years of Medicare, about 100,000 eligible enrollees were admitted to hospitals each week (Myers, 1970). Medicare led to a major increase in the elderly's use of medical care. For example, hospital discharges averaged 190 per 1,000 elderly persons in 1964 and 350 per 1,000 by 1973, with most of the change occurring in the early years (Davis and Schoen, 1978). Another study found that the proportion of the elderly using physician services jumped from 68 to 76 percent between 1963 and 1970 (Andersen et al., 1973). Since that time, use of services under Medicare has continued to climb. In 1993, 81.2 percent of all beneficiaries received Medicare services (Health Care Financing Administration, 1995).
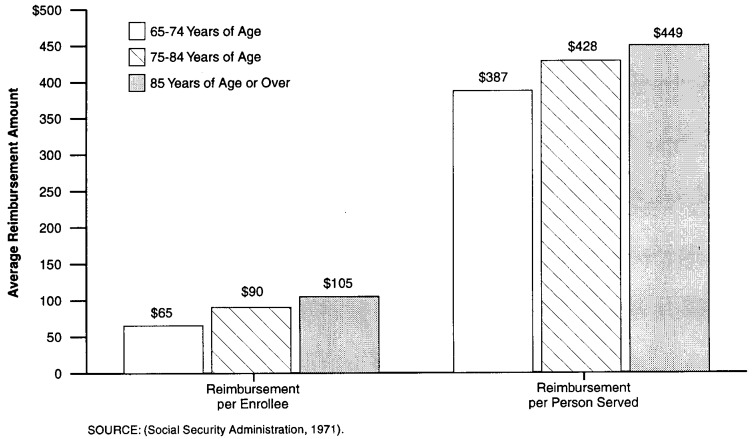
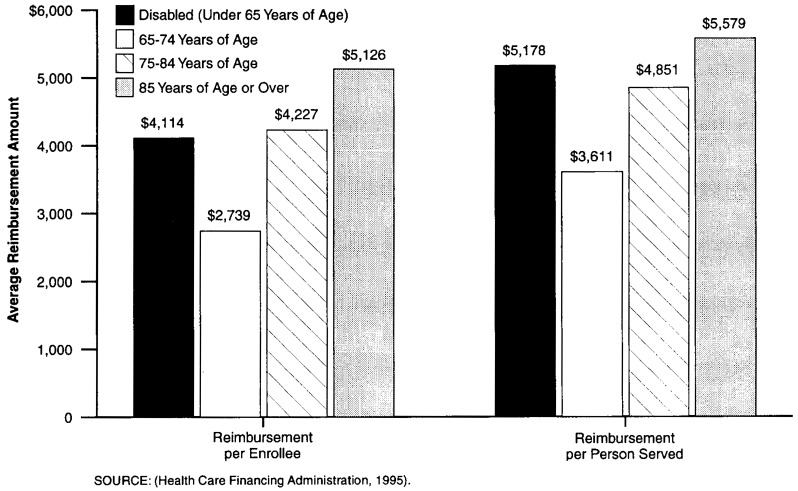
If coverage is truly universal, we should expect to see groups with high levels of need receiving high levels of services. The oldest old, those with chronic illnesses, and the disabled should be disproportionately served by the program. Indeed, between 1966, when Medicare first came into being, and 1993, the differences in reimbursement per enrollee and per person served increased by age category (Figures 5 and 6). By 1993, the very old, whose needs are greater, were receiving considerably more in benefits than younger enrollees.
Figure 5. Average Medicare Reimbursement per Enrollee and per Person Served: 1966.
Figure 6. Average Medicare Reimbursement per Enrollee and per Person Served: 1993.
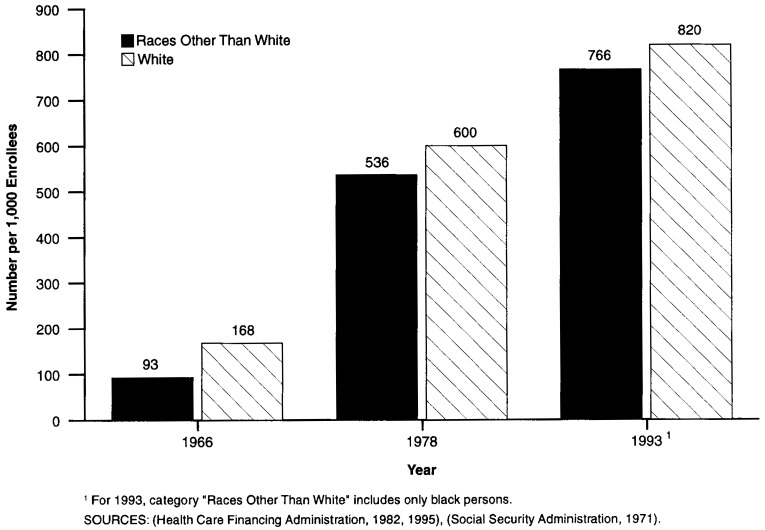
In other areas where income or discrimination might play a role in denying access, a successful universal program should reduce differences among beneficiaries when their varying characteristics do not reflect differences in the need for care. That is, equal access should, over time, diminish differences by income, race, and geographic location, unless warranted by differences in health status. Although Medicare is not yet a fully uniform program by these standards, between 1966 and 1993, differences between the percentage of white persons and persons of races other than white receiving services declined4 (Figure 7). Although the appropriate level should not necessarily be exactly the same, there certainly is no good reason for the large differences that existed in 1966 to be sustained.5 Medicare may still have a problem in ensuring reasonable access for minorities, but certainly major progress has been made over the period.
Figure 7. Number of Persons Served per 1,000 Medicare Enrollees, by Race: 1966, 1978, 1993.
Differences by income status have also declined, further aided by the introduction of the Qualified Medicare Beneficiary (QMB) and Specified Low-Income Beneficiary (SLMB) programs (discussed in greater detail in Rowland, 1996). These programs reduce the problems of affordability of health care posed by Medicare's premiums and copayments. The QMB and SLMB programs are part of Medicaid, however, and require considerable documentation to obtain eligibility. Partly as a consequence, participation in the programs remains low. Nonetheless, because of benefits to those participating in the QMB program, the share of incomes spent by the poor on health care is now lower than for the near-poor, as about two-thirds of those eligible are receiving subsidies of nearly $2,000 per year (Moon, Kuntz, and Pounder, 1996).
Access To Mainstream Medical Care
Another of Medicare's goals was to ensure that beneficiaries receive mainstream medical care, that they have access to the best and latest treatments on equal footing with other health care consumers. Indeed, when Medicare was passed, efforts were made to make the program look as much like other private insurance as possible, so that doctors and hospitals would agree to participate in the program. Although a national strike by physicians was threatened at the time of Medicare's passage, in practice, beneficiaries were almost immediately accepted and use of services and access to care occurred as planned.
Beneficiaries have unlimited access to specialists, nearly all of whom participate in the program. As the health care system has changed, so has Medicare. Delivery of health care in the United States has increasingly shifted from inpatient to ambulatory settings. Although Medicare's basic package of benefits has changed little since 1965, delivery of care has changed with the times. In 1966, inpatient hospital services constituted two-thirds of Medicare's total payments (National Center for Health Statistics, 1994). In 1995, that share was just under one-half (Health Care Financing Administration, 1996).
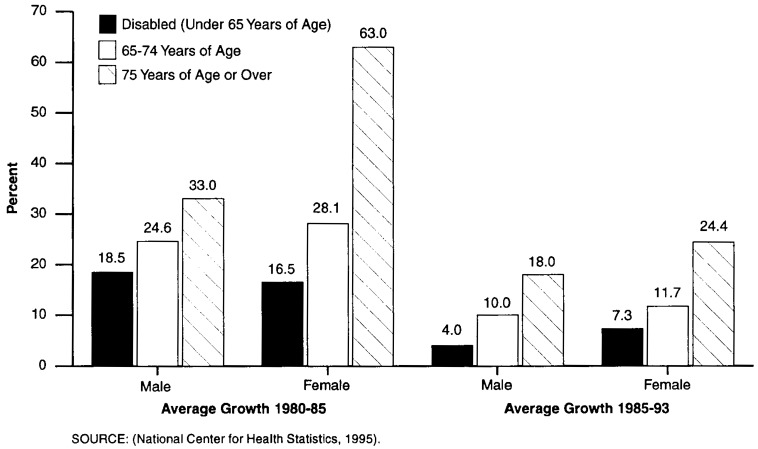
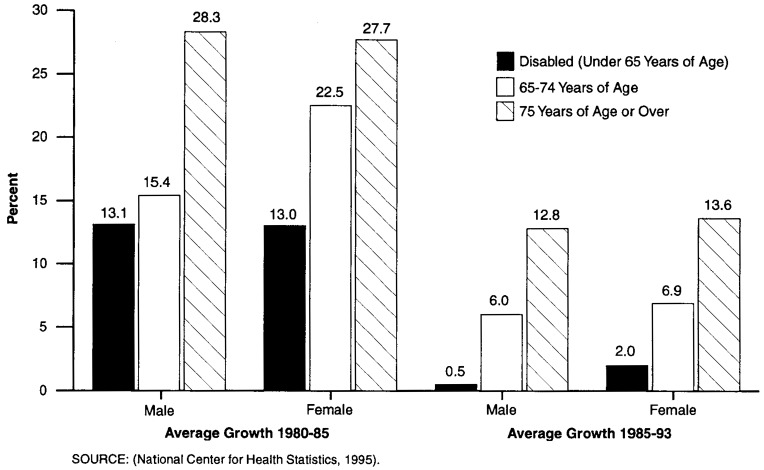
An additional way to track Medicare's ability to offer mainstream care is to look at the use of various types of new treatments and procedures to see whether older patients are able to obtain such services on an equal footing with younger patients. Again, more careful analysis would be necessary to determine what the relationship should be in terms of levels of use, but the appropriate question to ask is this: Is the rate of diffusion comparable across the groups? This should give some indication of general access to care. Two examples are shown in Figures 8 and 9, which show the increases in rates of angiocardiography and cardiac catheterization for different age groups. These high-technology procedures are generally delivered in inpatient settings, and these two figures track the growth rates of the procedures by age group. In both cases, growth in the use of treatments expanded rapidly from 1980 through 1985 as they were being introduced and then slowed through 1993 on an adjusted-annual-rate-of-growth basis. In these two examples, growth for the population 65 years of age or over was much greater than for those 45-64 years of age over both periods. At least in these cases, as well as others not shown here, Medicare beneficiaries do not appear to be disadvantaged in terms of their access to services. They are benefiting from new technology and at a rate sometimes greater than that of younger persons.
Figure 8. Growth in Use of Angiocardiography Procedures, by Sex and Age Group: 1980-85 and 1985-93.
Figure 9. Growth in Use of Cardiac Catheterization Procedures, by Sex and Age Group: 1980-85 and 1985-93.
Another indicator of how our medical care system is changing rapidly is the movement toward managed care arrangements for the delivery of health care services. Although Medicare is behind the national average in this regard, the option of enrolling in an HMO is available for many beneficiaries. Since 1991, when enrollment reached a little more than 2 million, the number of beneficiaries signing up for HMOs has increased dramatically. By the end of 1995, 3.8 million were enrolled (Health Care Financing Administration, 1996). Rapid expansion in the number of participating plans means that more and more beneficiaries will be able to choose these options should they wish to do so in the future. New offerings, including point-of-service plans (in which HMO enrollees can be reimbursed for out-of-network services), are also helping to keep Medicare closer to the mainstream of activity in the private sector. In fact, Medicare may benefit by lagging a bit behind the times, adopting private plans only after they have proven themselves in the employer-based environment.
And because beneficiaries can choose whether to go into managed care or remain in the traditional fee-for-service system, they have more choice than many younger families in the employer-based market.
Finally, although it is not easy to link overall health care spending with the health of the Nation, Medicare is ensuring that the most up-to-date care is available for older persons. The longer lives of these senior citizens attest to this and other efforts to improve their quality of life. Since 1960, the life expectancies of men and women 65 years of age or over have risen by 2.7 and 3.1 years, respectively. This compares with increases in life expectancy of only 1.3 and 3.6 years for the period 1900-60 (National Center for Health Statistics, 1996).
Conclusion
Medicare will face daunting challenges over the next 30 years, and it seems likely that major reforms will be legislated. But to a considerable degree, pressures arise because of the successes of the program. Medicare will go from serving 1 in 10 Americans to caring for nearly 1 in 5, as baby boomers begin to retire. Because Medicare serves the most vulnerable members of our population with up-to-date care, it should not be surprising that costs of the program are high. Each older beneficiary can also expect to draw more years of coverage from the system as a result of increased life expectancy. All of these factors have contributed to the costs of the program, but they are not indicators of failure.
Future reforms should build on Medicare's strengths as well as learn from its weaknesses, recognizing the crucial role the program has played in the lives of older Americans.
Acknowledgments
The author would like to acknowledge the help of Crystal Kuntz in developing the figures used in this article. The author would also like to thank the Commonwealth Fund for its sponsorship of related research.
Footnotes
Marilyn Moon is a Senior Fellow at The Urban Institute. The opinions expressed are those of the author and do not necessarily reflect those of The Urban Institute or the Health Care Financing Administration (HCFA).
Not only is this an important issue in itself, but it also reminds us that comparisons between the costs of Medicare and private health insurance should always be undertaken on a per capita basis, because the number of beneficiaries under Medicare is rising each year at a rate much faster than that for private insurance.
Moreover, there are early signs that many employers may begin to cut back on what they are willing to offer to future retirees in the form of health benefits (Mazo, 1994).
Most beneficiaries would pay an even higher share of their income once other non-Medicare expenditures are taken into account. For 1994, expenditures by the elderly out of pocket and on various insurance premiums claimed 21 percent of the average elderly person's income (Moon and Mulvey, 1995).
Forty-five percent fewer persons of races other than white received services in 1966; in 1978, that figure was 11 percent, and in 1993, 7 percent.
Other articles in this issue also describe Medicare's crucial role in desegregating hospitals in the United States.
Reprint Requests: Marilyn Moon, Ph.D., Senior Fellow, The Urban Institute, 2100 M Street, NW, Washington, DC 20037.
References
- Andersen R, Lion J, Anderson OW. Two Decades of Health Services: Social Survey Trends in Use and Expenditure. Cambridge, MA.: Ballinger Publishing Co.; 1976. [Google Scholar]
- Andersen R, Kravits J, Anderson OW, Daley J. Expenditures for Personal Health Services: National Trends and Variations, 1953-1970. Washington, DC.: U.S. Department of Health, Education, and Welfare; 1973. [Google Scholar]
- Chulis GS, Eppig F, Hogan M, et al. Health Insurance and the Elderly: Data From MCBS. Health Care Financing Review. 1993 Spring;14(3):163–181. [PMC free article] [PubMed] [Google Scholar]
- Davis K, Schoen C. Health and the War on Poverty: A Ten-Year Appraisal. Washington, DC.: The Brookings Institution Press; 1978. [Google Scholar]
- Fisher C. Differences by Age Groups in Health Care Spending. Health Care Financing Review. 1980 Spring;1(3):65–90. [PMC free article] [PubMed] [Google Scholar]
- Health Care Financing Administsration. Medicare Summary, Use and Reimbursements by Person, 1976-1978. Washington, DC.: U.S. Government Printing Office; 1982. [Google Scholar]
- Health Care Financing Administration. Profiles of Medicare, 30th Anniversary. Washington, DC.: U.S. Government Printing Office; 1996. [Google Scholar]
- Health Care Financing Administration. Health Care Financing Review Medicare and Medicaid Statistical Supplement, 1995. Washington, DC.: U.S. Government Printing Office; 1995. [Google Scholar]
- Mazo JF. Introduction to Retiree Health Benefits. In: Mazo JF, Rappaport AM, Schieber SJ, editors. Providing Health Care Benefits in Retirement. Philadelphia: Pennsylvania Press; 1994. [Google Scholar]
- Moon M. Medicare Now and in the Future. Second Edition. Washington, DC.: The Urban Institute Press; 1996. [Google Scholar]
- Moon M, Kuntz C, Pounder L. Protecting Low Income Medicare Beneficiaries. Washington, DC.: The Urban Institute; Jul, 1996. Urban Institute Discussion Paper prepared for The Commonwealth Fund. [Google Scholar]
- Moon M, Mulvey J. Entitlements and the Elderly: Protecting Promises, Recognizing Realities. Washington, DC: The Urban Institute Press; 1995. [Google Scholar]
- Myers RJ. Medicare. Homewood, IL.: Richard D. Irwin; 1970. (McCahan Foundation Book Series). [Google Scholar]
- National Center for Health Statistics. Health United States 1975. Hyattsville, MD.: Public Health Service; May, 1976. [Google Scholar]
- National Center for Health Statistics. Health United States 1993. Hyattsville, MD.: Public Health Service; May, 1994. [Google Scholar]
- National Center for Health Statistics. Health United States 1994. Hyattsville, MD.: Public Health Service; May, 1995. [Google Scholar]
- National Center for Health Statistics. Health United States 1995. Hyattsville, MD.: Public Health Service; May, 1996. [Google Scholar]
- Social Security Administration. Health Insurance for the Aged, 1966, Section 1: Summary — Utilization and Reimbursement by Person. Washington, DC.: U.S. Government Printing Office; 1971. [Google Scholar]
- U.S. Bureau of the Census. Statistical Abstract of the United States: 1994. 114th edition. Washington, DC.: U.S. Government Printing Office; 1994. [Google Scholar]


