

The near-infrared (NIR) window refers to a range of wavelengths (700–1300 nm) in which biological tissues are highly transparent.[1] Consequently, biological imaging and therapy modalities employ light at these wavelengths for the monitoring[1] and triggering[2] of biological events in vitro and in vivo. For instance, photothermal ablation takes advantage of NIR absorbing materials for transducing light into heat.[2] The resultant thermal energy can be used for a number of applications, such as tissue ablation and drug release. Despite the intense interest in NIR photothermal agents, their development has suffered from considerable challenges. In particular, few nanomaterials display the requisite absorption profiles required for NIR photothermal transduction.
The initial development of NIR photothermal agents largely focused on anisotropic gold particles[3] such as nanorods,[2] nanocages,[4] and nanostars.[5] These shapes serve as local plasmon antennas for NIR absorbance, but they are encumbered by complicated syntheses. More importantly, because of the non-equilibrium morphologies, anisotropic gold nanostructures inevitably tend to evolve into spheres upon heating.[5]
Consequently, researchers have begun to investigate the NIR photothermal properties of graphene derivatives such as graphene oxide (GO)[6] and reduced graphene oxide (rGO).[7] The exceptional surface-area-to-mass ratio of these two-dimensional (2D) materials makes them promising photothermal candidates that can be loaded with high cargo concentrations. Previously graphene,[8] rGO,[9] and MoS2[10] among others[11] have been explored for their use as photo-dectectors. However, a NIR photocurrent response for mechanically exfoliated MoS2 phototransistors was negligible.[10] Additionally, the efficacy of GO as a NIR photothermal transducer has been debated,[7a] prompting investigation of rGO, as a 2D nanomaterial with potentially improved NIR absorbance.[7a] Unfortunately, rGO is hydrophobic,[12] and thus requires complex surface modifications to be useful in aqueous environments.[7]
As an alternative to the aforementioned materials, we report the NIR-photothermal properties of chemically exfoliated MoS2 (ceMoS2). ceMoS2 is a mixed phase, two-dimensional amphiphile that is easy to synthesize in large batches and is directly dispersible in water.[13] Further, the magnitude of its ζ potential (−45 mV, comparable to GO)[14] provides great colloidal stability in aqueous media. We show that owing to an absorbance profile reaching into the NIR, ceMoS2 heats up rapidly upon NIR irradiation. Because of its high surface-area-to-mass ratio, ceMoS2 also possesses loading capacities on par with GO, the current best-in-class.[15] Clearly, ceMoS2 possesses many desirable traits present in the aforementioned photothermal agents.
To synthesize ceMoS2, we use the Morrison method[13a,c] which breaks the weak interlayer forces in bulk MoS2 through ultrasonication and the formation of H2 gas. Compared to mechanical exfoliation[16] or vapor-deposited films on wafer templates,[17] the MoS2 sheets obtained through this method tend to lack the crystallinity required for usage as semiconducting active layers.[13c,18] However, this method renders the resulting sheets water dispersible (they are natively hydrophobic), is scalable, and can be readily adapted for other transition metal dichalcogenides.[13c,19] A typical synthesis produces approximately 300 mL of MoS2 at a concentration ≥300 ppm (see the Experimental Section) and is easily scalable. Physical characterization of the resultant sheets using atomic force microscopy (n = 100) revealed mean longest diagonals of 0.80 μm with an average thickness of 1.56 nm (n = 40 sheets), which is consistent with a MoS2 monolayer[20] (Figure 1 and Figure S1 in the Supporting Information).
Figure 1.
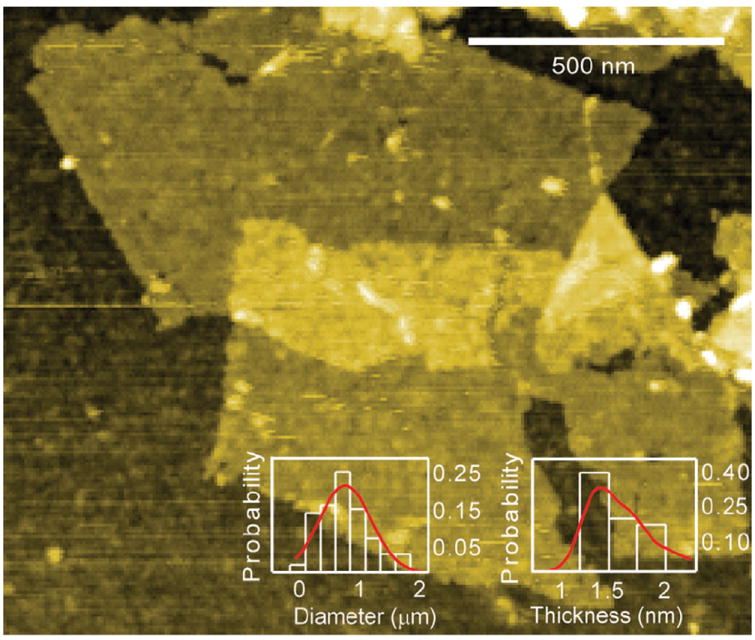
Atomic force microscopy (AFM) micrograph of ceMoS2 sheets. The insets show diameter and thickness profiles.
NIR absorbance by ceMoS2 was then characterized (Figure 2a). Here, the concentration of ceMoS2 was determined using induction-coupled plasma mass spectroscopy (ICP-MS), which provides parts-per-billion sensitivity (ppb). This enabled the accurate quantification of the ceMoS2 mass extinction coefficient (λ = 800 nm, 29.2 Lg−1 cm−1), which represents a ≈7.8-fold increase compared to nano-GO (3.6 Lg−1 cm−1) and is comparable to nano-rGO (24.6 Lg−1 cm−1).[7a] It also represents a two times increase over gold nanorods (13.9 Lg−1 cm−1).[7a]
Figure 2.
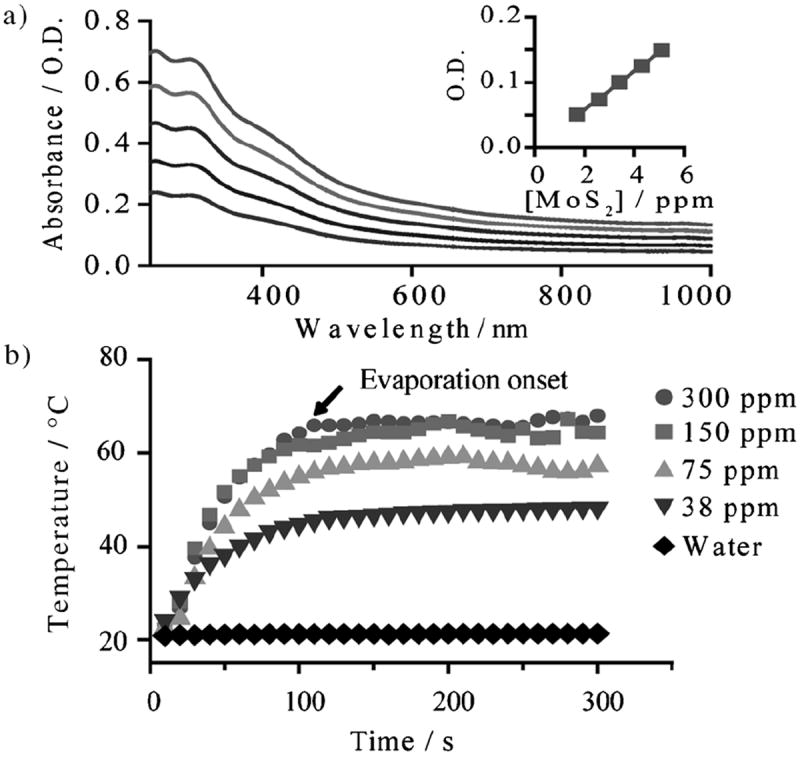
a) Absorbance profile of ceMoS2. The top curve is 5 ppm. Each subsequent curve is 0.5 times diluted. The inset is the Beer’s law plot at 800 nm (O.D. = optical density). b) Photothermal heating curves of ceMoS2 across a range of concentrations.
Next, we investigated photothermal heating of solutions of ceMoS2, prepared over a range of concentrations, by irradiation with a continuous wave laser at λ = 800 nm (0.8 W cm−2) and measurement of the solution temperature as a function of time (Figure 2b.). Here, the superior NIR photothermal transduction by ceMoS2 is demonstrated, as we observed solution temperatures above 40°C, the figure of merit for thermal ablation therapy,[21] to be generated with very low concentrations of ceMoS2 (<38 ppm). This is a marked improvement over GO.[7a] Thus, ceMoS2 combines the NIR heating features of rGO,[7a] with the water dispersibility of GO using a simple and readily scalable batch process. Additionally, x-ray photoelectron spectroscopy (XPS) showed no significant oxidation of as prepared and IR-irradiated ceMoS2 (Figure S2).
To show that ceMoS2, in the absence of NIR irradiation, is otherwise biocompatible, we examined its capability to form non-denaturing host–guest interactions with α-chymotrypsin (ChT), a serine protease. Here, ChT was chosen for its broad bio-sensing applicability and its well documented loading capacity in a wide variety of materials, including gold nanoparticles,[22] polymeric micelles,[23] dendrimers,[24] porphyrins,[25] carbon nanotubes,[26] and GO.[14a,15] As ChT contains a cationic active site that can complex with anionic materials through electrostatic complementation, its loading can be quantified by monitoring enzymatic inhibition by ceMoS2. To investigate ChT loading on ceMoS2, we incubated a range of concentrations of ceMoS2 with 16 μm ChT in 96 well plates. After 30 minutes of incubation, N-succinyl-l-phenylalanine-p-nitroanilide (SPNA), a chromogenic substrate for measuring ChT activity was added to a final concentration of 2 mm. The data were then fitted using nonlinear regression. From the resulting inhibition curve (Figure 3a), it can be seen that 50% of ChT is inhibited by 5 ppm of ceMoS2. Full inhibition (> 95%) is attained at 11 ppm. This value is significant, as it demonstrates that ceMoS2 has a ChT dose-inhibition capacity comparable to GO, which is the current benchmark material (full comparison in the Supporting Information).[15]
Figure 3.
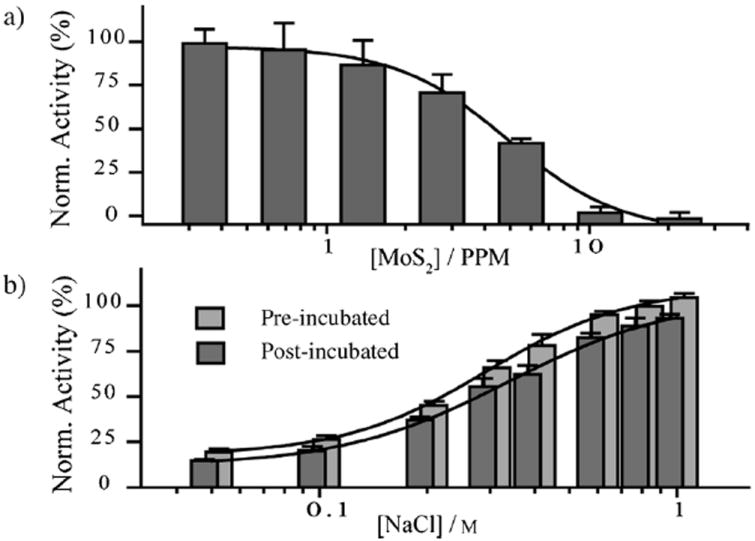
a) Inhibition of ChT using increasing doses of ceMoS2. b) Activity of ChT–ceMoS2 pre-incubated and post-incubated with increasing concentrations of NaCl.
To show that the host–guest interaction between ChT and ceMoS2 is reversible, we incubated ChT with 11 ppm of ceMoS2 (full inhibition concentration) in media of increasing ionic strength to negate electrostatic interactions.[27] In one set of experiments, ceMoS2 was added to ChT in media prespiked with NaCl (pre-incubated). In another set of experiments, NaCl was added after first allowing ceMoS2 and ChT to form a complex for 30 minutes (post-incubated). In the case of pre-incubation with NaCl, 100% of ChT activity was observed to be recovered at [NaCl] = 750 mm. Comparatively, only 90% of ChT activity was recovered if NaCl was added after ceMoS2 was allowed to first form a complex with ChT (Figure 3b). Interestingly, the rate of recovery did not change with increased pre-incubation times (24 h, see the Supporting Information). These observations suggest that either some part of ChT is denatured following complexation with ceMoS2, or that there may be a two component complexation process where one component acts through non-electrostatic forces.[15]
To distinguish between these mechanisms, we investigated the protein structure of ChT after complexation with ceMoS2 using circular dichroism (CD) and fluorescence spectroscopy. Here, using CD, it can be seen that native ChT structure presents characteristic minima at 232 and 204 nm (Figure 4a and Figure S3).[15] Upon denaturation (DChT), the minimum at 232 nm diminishes and the minimum at 204 nm intensifies and shifts toward 198 nm (Figure S3). It can also be seen that ChT, once inhibited by complexation with ceMoS2, displays identical CD spectra to free ChT (Figure 4a). In fact, the CD spectra of ChT remained consistent even after 24 h of incubation with ceMoS2, thus indicating complexation does not lead to protein denaturation.
Figure 4.
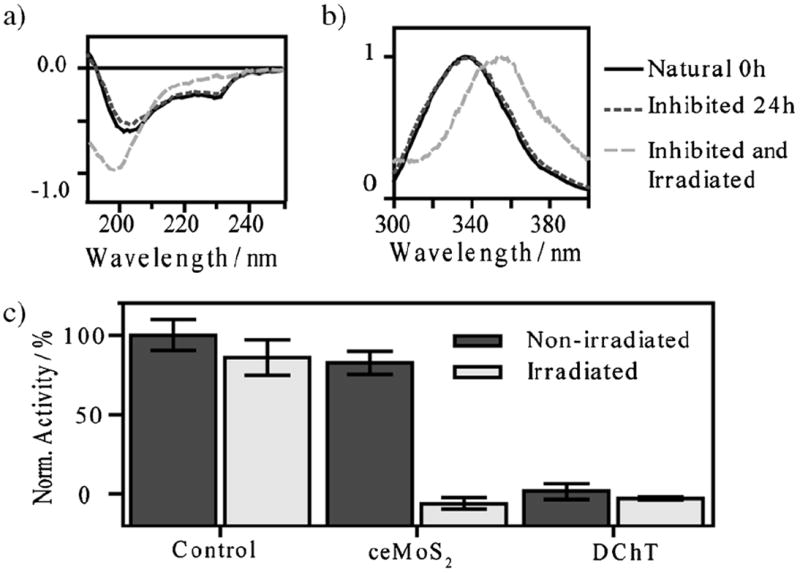
a) Normalized CD and b) fluorescent spectra of select ChT samples after various treatments. A full set of samples is available in the Supporting Information (Norm. = normalized intensity). c) Normalized activity assay of ceMoS2-ChT or decoupled ChT in 750 mm NaCl after various treatments.
The preservation of the ChT structure was also corroborated by fluorescence spectroscopy. Here, as the secondary structure of ChT unravels, its tryptophan (trp) residue becomes increasingly exposed to water. This causes a red-shift in its fluorescence peak, from 334 to 352 nm (Figure S3).[28] As this shift was not observed with the inhibited ChT–ceMoS2, the fluorescence spectroscopy data corroborates the findings of the CD study (Figure 4b). It is therefore likely that the 90% recovery seen for ceMoS2-complexed ChT post-incubated with NaCl is due to a two-component binding process, with the majority due to electrostatic complementarity, and the remaining (non-recovered) binding due to weak intermolecular forces[15,22] attributable to the amphiphillic properties of ceMoS2[13b].
The combination of biomolecular friendliness, high protein loading, and favorable photothermal characteristics of ceMoS2 suggests its potential as an effective NIR photothermal agent. To demonstrate this potential, we irradiated aliquots of ChT-complexed ceMoS2 with NIR light for 15 minutes (λ = 800 nm, 0.8 W cm−2). After treatments, secondary structures of ChT were examined with CD and fluorescence spectroscopy (Figure 4a,b and Figure S3). Residual activity was monitored by spiking samples with NaCl (750 mm) and reversing the ChT–ceMoS2 complexation. The activity of ChT after various treatments is shown in Figure 4c.
In these experiments, it can be seen that the ChT–ceMoS2 complexes irradiated with NIR laser light showed complete denaturation (Figure 4a,b and Figure S3). Further, they show little enzymatic activity (Figure 4c). This demonstrates ceMoS2 as an effective enzymatic receptor capable of selective destruction of its targets through NIR photothermal transduction.
To demonstrate the photothermal ablation therapy for mammalian cells, we then examined its administration in vitro. Here, we collected Hela cells at a concentration of 105 mL−1. The solution was then spiked with ceMoS2 to final concentrations of 20 and 40 ppm. These dosages are roughly an order of magnitude lower than those reported in previous GO studies.[6b,29] As with ChT experiments, parallel aliquots were used for controls. All experiments were performed in independent triplicates. After various treatments (irradiated, non-irradiated, with and without ceMoS2), cells were washed with phosphate-buffered saline (PBS; three times) and then incubated in a 96 well plate for 24 hrs (10000/well). Cell viabilities were then measured using Celltiter 96 (Promega), a negatively charged, water-soluble MTT agent that does not interfere with cell activity measurements.[12]
As shown in Figure 5, cells treated with ceMoS2 and NIR irradiation (λ = 800 nm, 20 minutes) show zero viability at both ceMoS2 concentrations. This is not surprising as solution temperatures reached 57 and 64°C, respectively, well above thermal ablation thresholds. Optical micrographs of the treated cells confirm the Celltiter results (Figure S4). This presents a stark contrast to cells treated with ceMoS2 without irradiation. There, cell viabilities of 82 and 81% were observed. It is thus consistent with previous reports showing MoS2 materials to be relatively non-toxic to cells.[30] Cells irradiated with NIR without ceMoS2 showed a viability of 89%. This observation shows that the photothermal process of ceMoS2 can be extended for cellular destruction.
Figure 5.
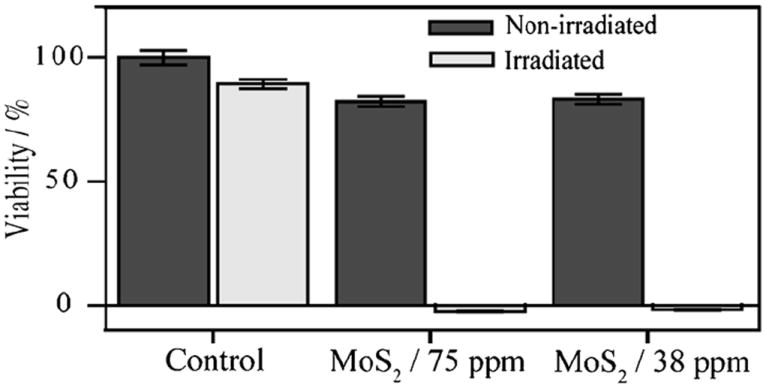
Hela cell viabilities after various treatments.
As the cellular viability is closely related to the temperature rise induced from the ceMoS2 photothermal transduction, we examined the physical processes driving the temperature rise in the cellular matrix by measuring the rate of heat transfer from the ceMoS2 into an aqueous medium with time-domain thermo-transmission (TDTT).[31] TDTThas been used previously by several groups to quantify the thermal boundary conductance[32] between nanosystems suspended in elastically softer media.[31, 33] In short, TDTT uses a brief laser pulse to heat the optically absorbing ceMoS2 while a time-delayed probe pulse monitors the temperature change of the ceMoS2. The thermal decay of the ceMoS2 over several nanoseconds is related to the heat flow from the ceMoS2 to the surrounding media, as described in detail elsewhere.[34, 35] For our specific TDTT experiments, we measured the thermal decay of 30 ppm of ceMoS2 suspended in deionized water. We monitored the temperature decay at 800 nm to directly mimic the previously described experiments and find the thermal boundary conductance from the ceMoS2 to its surrounding to be (77.5±9) MW m−2 K−1. To put this into perspective, this is comparable to the interfacial heat transfer between two solids[36] or between carbon nanotubes and water.[31, 33b] This relatively low resistance (high conductance) offers an equivalent resistance of about 10 nm of a typical mammalian cell matrix (assuming a cytoplasmic water content of 70%), indicating the high efficacy of thermal coupling between the ceMoS2 and the surrounding media. Using this measured value of thermal boundary conductance, from steady-state heat transfer theory[34, 37] we calculate a 30 K temperature rise in the intracellular medium for a 30 ppm ceMoS2 suspensions irradiated at λ=800 nm (0.8 W cm−2).
In summary, we have described the optical and photothermal properties of ceMoS2 and report its effectiveness as a NIR photothermal agent. ceMoS2 displays approximately 7.8 times greater absorbance in the NIR relative to GO, with an extinction coefficient at 800 nm of 29.2 Lg−1 cm−1, which is higher than that of gold nanorods (13.9 Lg−1 cm−1) and is comparable to rGO (24.6 Lg−1 cm−1).[7a] Unlike the hydrophobic rGO, however, ceMoS2 is also directly water dispersible after exfoliation, and easily purified (dialysis under water flow). It also possesses an enhanced biomolecular protein loading capacity comparable to GO, the current bestin- class material.[15] These characteristics provide a foundation to explore the use of ceMoS2 for a wide range of biological applications and beyond (e.g., solar paints and coatings), where broad light absorption into the NIR is desirable.
Experimental Section
Synthesis of ceMoS2
Procedures were adapted from Joensen et al.[16] In a nitrogen environment, ≈350 mg of MoS2 powder was immersed in ≈3.5 mL of n-butyllithium (1.6m in hexane) and stirred for 48 h. Mixture was then filtered over Whatman #41 filter and rinsed with 100 mL of hexane. To the semi-dry mixture, 300 mL of H2O (18.2 MΩ cm at 25°C) was added. The mixture was sonicated for 1 h to achieve exfoliation. The MoS2 nanosheets were then centrifuged and washed with H2O five times. It was then collected and dialyzed against H2O for 5 days. The concentration was determined by ICP-MS.
Additional experimental details are provided in the Supporting Information.
Supplementary Material
Footnotes
B.K. and C.J.B. acknowledge support from the U.S. Department of Energy (DOE), Office of Science, Office of Basic Energy Sciences (BES), Division of Materials Sciences and Engineering. Sandia National Laboratories is a multi-program laboratory managed and operated by Sandia Corporation, a wholly owned subsidiary of Lockheed Martin Corporation, for the U.S. Department of Energy’s National Nuclear Security Administration under contract number DE-AC04-94AL85000. S.C. thanks D.H.S. for a fellowship and Dr. Y. Lin for helpful discussions. V.P.D. acknowledges support by the National Cancer Institute Center for Cancer Nanotechnology Excellence (CCNE) initiative at Northwestern University award number U54A119341. J.H. acknowledges support from the National Science Foundation (DMR CAREER grant number 0955612) and the Alfred P. Sloan Research Foundation.
Supporting information for this article is available on the WWW under http://dx.doi.org/10.1002/anie.201209229.
Contributor Information
Stanley S. Chou, Email: s-chou@northwestern.edu, Department of Materials Science and Engineering, International Institute of Nanotechnology, Northwestern University, Evanston, IL 60208 (USA).
Dr. Bryan Kaehr, Email: bjkaehr@sandia.gov, Advanced Materials Laboratory Sandia National Laboratories, Albuquerque, NM 87106 (USA); Department of Chemical and Nuclear Engineering Center for Micro-engineered Materials, University of New Mexico, Albuquerque, NM 87106 (USA).
Jaemyung Kim, Department of Materials Science and Engineering, International Institute of Nanotechnology, Northwestern University, Evanston, IL 60208 (USA).
Brian M. Foley, Department of Materials Science and Engineering, International Institute of Nanotechnology, Northwestern University, Evanston, IL 60208 (USA)
Dr. Mrinmoy De, Department of Materials Science and Engineering, International Institute of Nanotechnology, Northwestern University, Evanston, IL 60208 (USA)
Prof. Patrick E. Hopkins, Department of Mechanical and Aerospace Engineering, University of Virginia, Charlottesville, VA 22904 (USA)
Prof. Jiaxing Huang, Department of Materials Science and Engineering, International Institute of Nanotechnology, Northwestern University, Evanston, IL 60208 (USA)
Prof. C. Jeffrey Brinker, Advanced Materials Laboratory Sandia National Laboratories, Albuquerque, NM 87106 (USA) Department of Chemical and Nuclear Engineering Center for Micro-engineered Materials, University of New Mexico, Albuquerque, NM 87106 (USA).
Prof. Vinayak P. Dravid, Department of Materials Science and Engineering, International Institute of Nanotechnology, Northwestern University, Evanston, IL 60208 (USA)
References
- 1.Jöbsis-vanderVliet FF. J Biomed Opt. 1999;4:392–396. doi: 10.1117/1.429952. [DOI] [PubMed] [Google Scholar]
- 2.Huang X, El-Sayed IH, Qian W, El-Sayed MA. J Am Chem Soc. 2006;128:2115–2120. doi: 10.1021/ja057254a. [DOI] [PubMed] [Google Scholar]
- 3.Zhao W, Karp JM. Nat Mater. 2009;8:453–454. doi: 10.1038/nmat2463. [DOI] [PubMed] [Google Scholar]
- 4.Skrabalak SE, Chen J, Sun Y, Lu X, Au L, Cobley CM, Xia Y. Acc Chem Res. 2008;41:1587–1595. doi: 10.1021/ar800018v. [DOI] [PMC free article] [PubMed] [Google Scholar]
- 5.Xie J, Lee JY, Wang DIC. Chem Mater. 2007;19:2823–2830. [Google Scholar]
- 6.a) Tian B, Wang C, Zhang S, Feng L, Liu Z. ACS Nano. 2011;5:7000–7009. doi: 10.1021/nn201560b. [DOI] [PubMed] [Google Scholar]; b) Yang K, Zhang S, Zhang G, Sun X, Lee S-T, Liu Z. Nano Lett. 2010;10:3318–3323. doi: 10.1021/nl100996u. [DOI] [PubMed] [Google Scholar]
- 7.a) Robinson JT, Tabakman SM, Liang Y, Wang H, Sanchez Casalongue H, Vinh D, Dai H. J Am Chem Soc. 2011;133:6825–6831. doi: 10.1021/ja2010175. [DOI] [PubMed] [Google Scholar]; b) Yang K, Wan J, Zhang S, Tian B, Zhang Y, Liu Z. Biomaterials. 2012;33:2206–2214. doi: 10.1016/j.biomaterials.2011.11.064. [DOI] [PubMed] [Google Scholar]
- 8.Xia F, Mueller T, Lin Y-m, Valdes-Garcia A, Avouris P. Nat Nanotechnol. 2009;4:839–843. doi: 10.1038/nnano.2009.292. [DOI] [PubMed] [Google Scholar]
- 9.a) Chang H, Sun Z, Yuan Q, Ding F, Tao X, Yan F, Zheng Z. Adv Mater. 2010;22:4872–4876. doi: 10.1002/adma.201002229. [DOI] [PubMed] [Google Scholar]; b) Chitara B, Panchakarla LS, Krupanidhi SB, Rao CNR. Adv Mater. 2011;23:5419–5424. doi: 10.1002/adma.201101414. [DOI] [PubMed] [Google Scholar]
- 10.Yin Z, Li H, Li H, Jiang L, Shi Y, Sun Y, Lu G, Zhang Q, Chen X, Zhang H. ACS Nano. 2012;6:74–80. doi: 10.1021/nn2024557. [DOI] [PubMed] [Google Scholar]
- 11.Rao CNR, Matte HSSR, Subrahmanyam KS. Acc Chem Res. 2013;46:149–159. doi: 10.1021/ar300033m. [DOI] [PubMed] [Google Scholar]
- 12.Liao K-H, Lin Y-S, Macosko CW, Haynes CL. ACS Appl Mater Interfaces. 2011;3:2607–2615. doi: 10.1021/am200428v. [DOI] [PubMed] [Google Scholar]
- 13.a) Joensen P, Frindt RF, Morrison SR. Mater Res Bull. 1986;21:457–461. [Google Scholar]; b) Divigalpitiya WMR, Frindt RF, Morrison SR. Science. 1989;246:369–371. doi: 10.1126/science.246.4928.369. [DOI] [PubMed] [Google Scholar]; c) Eda G, Yamaguchi H, Voiry D, Fujita T, Chen M, Chhowalla M. Nano Lett. 2011;11:5111–5116. doi: 10.1021/nl201874w. [DOI] [PubMed] [Google Scholar]
- 14.a) Chou SS, De M, Luo J, Rotello VM, Huang J, Dravid VP. J Am Chem Soc. 2012;134:16725–16733. doi: 10.1021/ja306767y. [DOI] [PMC free article] [PubMed] [Google Scholar]; b) Luo J, Cote LJ, Tung VC, Tan ATL, Goins PE, Wu J, Huang J. J Am Chem Soc. 2010;132:17667–17669. doi: 10.1021/ja1078943. [DOI] [PubMed] [Google Scholar]
- 15.De M, Chou SS, Dravid VP. J Am Chem Soc. 2011;133:17524–17527. doi: 10.1021/ja208427j. [DOI] [PMC free article] [PubMed] [Google Scholar]
- 16.a) Radisavljevic B, Radenovic A, Brivio J, Giacometti V, Kis A. Nat Nanotechnol. 2011;6:147–150. doi: 10.1038/nnano.2010.279. [DOI] [PubMed] [Google Scholar]; b) Ramakrishna Matte HSS, Gomathi A, Manna AK, Late DJ, Datta R, Pati SK, Rao CNR. Angew Chem. 2010;122:4153–4156. doi: 10.1002/anie.201000009. [DOI] [PubMed] [Google Scholar]; Angew Chem Int Ed. 2010;49:4059–4062. doi: 10.1002/anie.201000009. [DOI] [PubMed] [Google Scholar]
- 17.a) Liu K-K, Zhang W, Lee Y-H, Lin Y-C, Chang M-T, Su C-Y, Chang C-S, Li H, Shi Y, Zhang H, Lai C-S, Li L-J. Nano Lett. 2012;12:1538–1544. doi: 10.1021/nl2043612. [DOI] [PubMed] [Google Scholar]; b) Lee Y-H, Zhang X-Q, Zhang W, Chang M-T, Lin C-T, Chang K-D, Yu Y-C, Wang JT-W, Chang C-S, Li L-J, Lin T-W. Adv Mater. 2012;24:2320–2325. doi: 10.1002/adma.201104798. [DOI] [PubMed] [Google Scholar]
- 18.Joensen P, Crozier ED, Alberding N, Frindt RF. J Phys C. 1987;20:4043. [Google Scholar]
- 19.Zeng Z, Yin Z, Huang X, Li H, He Q, Lu G, Boey F, Zhang H. Angew Chem. 2011;123:11289–11293. doi: 10.1002/anie.201106004. [DOI] [PubMed] [Google Scholar]; Angew Chem Int Ed. 2011;50:11093–11097. doi: 10.1002/anie.201106004. [DOI] [PubMed] [Google Scholar]
- 20.Late DJ, Liu B, Matte HSSR, Rao CNR, Dravid VP. Adv Funct Mater. 2012;22:1894–1905. [Google Scholar]
- 21.a) Huang H-C, Rege K, Heys JJ. ACS Nano. 2010;4:2892–2900. doi: 10.1021/nn901884d. [DOI] [PMC free article] [PubMed] [Google Scholar]; b) Huang X, Jain PK, El-Sayed IH, El-Sayed MA. Photochem Photobiol. 2006;82:412–417. doi: 10.1562/2005-12-14-RA-754. [DOI] [PubMed] [Google Scholar]; c) Overgaard J. Int J Radiat Oncol Biol Phys. 1989;16:535–549. doi: 10.1016/0360-3016(89)90470-7. [DOI] [PubMed] [Google Scholar]
- 22.Fischer NO, McIntosh CM, Simard JM, Rotello VM. Proc Natl Acad Sci USA. 2002;99:5018–5023. doi: 10.1073/pnas.082644099. [DOI] [PMC free article] [PubMed] [Google Scholar]
- 23.Sandanaraj BS, Vutukuri DR, Simard JM, Klaikherd A, Hong R, Rotello VM, Thayumanavan S. J Am Chem Soc. 2005;127:10693–10698. doi: 10.1021/ja051947+. [DOI] [PMC free article] [PubMed] [Google Scholar]
- 24.Chiba F, Hu T-C, Twyman LJ, Wagstaff M. Chem Commun. 2008:4351–4353. doi: 10.1039/b806517a. [DOI] [PubMed] [Google Scholar]
- 25.Kano K, Ishida Y. Chem Asian J. 2008;3:678–686. doi: 10.1002/asia.200700383. [DOI] [PubMed] [Google Scholar]
- 26.Zhang B, Xing Y, Li Z, Zhou H, Mu Q, Yan B. Nano Lett. 2009;9:2280–2284. doi: 10.1021/nl900437n. [DOI] [PMC free article] [PubMed] [Google Scholar]
- 27.Verma A, Simard JM, Rotello VM. Langmuir. 2004;20:4178–4181. doi: 10.1021/la036183v. [DOI] [PubMed] [Google Scholar]
- 28.a) Ladokhin AS. Encyclopedia of Analytical Chemistry. Wiley; Hoboken: 2006. [Google Scholar]; b) Fischer NO, Verma A, Goodman CM, Simard JM, Rotello VM. J Am Chem Soc. 2003;125:13387–13391. doi: 10.1021/ja0352505. [DOI] [PubMed] [Google Scholar]
- 29.Note: Value calculated from reference [7b] using the reported dose (20 mg kg−1) by assuming a typical mouse weight of 250 g and a blood volume of 1.5 mL.
- 30.Wu H, Yang R, Song B, Han Q, Li J, Zhang Y, Fang Y, Tenne R, Wang C. ACS Nano. 2011;5:1276–1281. doi: 10.1021/nn102941b. [DOI] [PubMed] [Google Scholar]
- 31.Huxtable ST, Cahill DG, Shenogin S, Xue L, Ozisik R, Barone P, Usrey M, Strano MS, Siddons G, Shim M, Keblinski P. Nat Mater. 2003;2:731–734. doi: 10.1038/nmat996. [DOI] [PubMed] [Google Scholar]
- 32.Swartz ET, Pohl RO. Rev Mod Phys. 1989;61:605–668. [Google Scholar]
- 33.a) Huxtable ST, Cahill DG, Shenogin S, Keblinski P. Chem Phys Lett. 2005;407:129–134. [Google Scholar]; b) Kang SD, Lim SC, Lee E-S, Cho YW, Kim Y-H, Lyeo H-K, Lee YH. ACS Nano. 2012;6:3853–3860. doi: 10.1021/nn2049762. [DOI] [PubMed] [Google Scholar]
- 34.Cahill DG. Rev Sci Instrum. 2004;75:5119–5122. [Google Scholar]
- 35.a) Hopkins PE, Serrano JR, Phinney LM, Kearney SP, Grasser TW, Harris CT. J Heat Transfer. 2010;132:081302. [Google Scholar]; b) Schmidt AJ, Chen X, Chen G. Rev Sci Instrum. 2008;79:114902. doi: 10.1063/1.3006335. [DOI] [PubMed] [Google Scholar]
- 36.Pop E. Nano Res. 2010;3:147–169. [Google Scholar]
- 37.Oh D-W, Ko C, Ramanathan S, Cahill DG. Appl Phys Lett. 2010;96:151906. [Google Scholar]
Associated Data
This section collects any data citations, data availability statements, or supplementary materials included in this article.