Abstract
We report a novel in-situ electrochemical synthesis approach for the formation of functionalized graphene–graphene oxide (fG–GO) nanocomposite on screen-printed electrodes (SPE). Electrochemically controlled nanocomposite film formation was studied by transmission electron microscopy (TEM) and Raman spectroscopy. Further insight into the nanocomposite has been accomplished by the Fourier transformed infrared spectroscopy (FTIR), thermal gravimetric analysis (TGA) and X-ray diffraction (XRD) spectroscopy. Configured as a highly responsive screen-printed immunosensor, the fG–GO nanocomposite on SPE exhibits electrical and chemical synergies of the nano-hybrid functional construct by combining good electronic properties of functionalized graphene (fG) and the facile chemical functionality of graphene oxide (GO) for compatible bio-interface development using specific anti-diuron antibody. The enhanced electrical properties of nanocomposite biofilm demonstrated a significant increase in electrochemical signal response in a competitive inhibition immunoassay format for diuron detection, promising its potential applicability for ultra-sensitive detection of range of target analytes.
Keywords: Functionalised graphene–graphene oxide, Nanocomposites, Specific antibodies, Diuron, Electrochemical immunosensor
1. Introduction
Graphene, a monolayer of a hexagonal network of carbon atoms densely packed into a two-dimensional honeycomb crystal lattice, has attracted considerable attention in the recent years because of its unique optical, chemical and electronic properties (Geim and Novoselov, 2007; Katneson, 2007; Liu et al., 2008). These intrinsic nanostructure properties of graphene make it a promising candidate for potential device applications such as field-effect transistors, gas sensors and electromechanical resonators (Bunch et al., 2007; Gilje et al., 2007; Schedin et al., 2007; Li and Kraner, 2008). Furthermore, graphene has substantial potential for its use as a biosensing platform because of its unique facile surface modified characteristics, high charge mobility and photoluminescence characteristics which provide for remarkably versatile signal transduction modalities (Mohanty and Berry, 2008; Sun et al., 2008; Yang et al., 2010). Recently, graphenebased nanocomposite films have been used for constructing enhanced electrochemical sensors and biosensors, because of its synergistic effects of the electrochemical and catalytic activity (Wang et al., 2010; Li et al., 2011; Sheng et al., 2011). Zhang and colleagues have reported construction of a hybrid film consisting of GO nanosheets together with the Prussian blue (PB) by electropolymerizing onto the GO modified glassy carbon electrode (GCE) for electrochemical sensing applications (Zhang et al., 2011a). In a different approach, an in-situ chemical synthesis approach has been developed to prepare graphene–gold nanoparticles nanocomposites for biosensing applications (Dong et al., 2011).
The new emerging role of graphene for sensing applications would require commercial large scale production. The existing methods of preparing graphene sheets include chemical exfoliation i.e., oxidation of graphite and subsequent reduction of the exfoliated graphite oxide sheets (Park and Ruoff, 2009). However, it often employs hazardous chemicals (e.g., hydrazine) as reductants, besides showing poor electronic properties of the synthesized material that make it incompatible for biosensing applications (Ling et al., 2010). Electrochemical methods are one of the most promising environment friendly methods to obtain graphene via graphene oxide (GO), an oxidized form of graphene, which is an inexpensive precursor decorated by hydroxyl and epoxy functional groups on the hexagonal network of carbon atoms with carboxyl groups at the edges (Shao et al., 2010). The electrochemical reduction of graphene oxide offers a convenient and efficient means to obtain graphene (Allen et al., 2010). But the study could not address a controlled electrochemical conversion process which is an important aspect of synthesizing reproducible monolayers of functionalized graphene for its potential applicability in ultra-sensitive immunosensing applications.
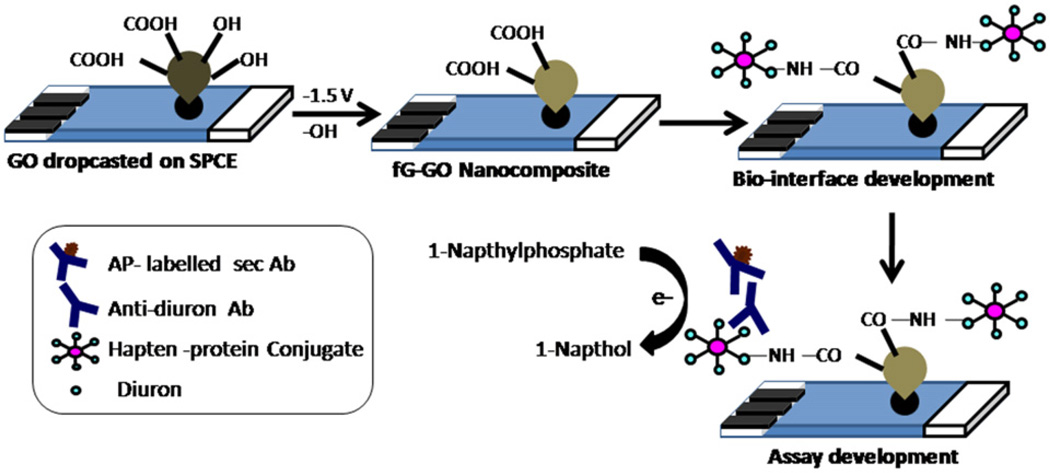
In our previous study, we generated highly specific antibodies against diuron (Sharma and Suri, 2011) and used these receptor molecules for tagging on a PB-AuNPs nanocomposite film formed on a gold electrode (Sharma et al., 2011). The present study illustrates the role of chemical and electrical synergies between functionalized graphene and graphene oxide by offering the integrated dual properties of the fG–GO nanohybrid (i.e., good electronic properties of functionalized graphene and facile chemical functionality of graphene oxide) for bio-interface development. A novel fG–GO hybrid film using in-situ electrochemical synthesis route was developed by controlling the number of reductive scans of the optimized concentration of GO on SPE surface and used further for electrochemical immunosensing applications. Antibody functionalized nanocomposite exhibited much higher electrochemical response in the developed immunoassay format using alkaline phosphatase labeled secondary antibody and naphthyl phosphate as substrate. The modified SPE electrodes were able to detect herbicide diuron [3-(3,4-dichlorophenyl)-1, 1-dimethylurea] with ultrahigh sensitivity showing detection limit down to the sub-ppt (parts per trillion) level. Scheme 1 depicts the in-situ synthesis of fG–GO nanocomposite on SPE surface and their application in immunosensor development.
Scheme 1.
Illustration of in-situ electrochemical synthesis of fG–GO nanocomposite on screen printed electrodes and subsequent immunoassay development.
2. Materials and methods
2.1. Reagents
Natural graphite flakes, standard phenylurea herbicide diuron, 1-ethyl-3-(3-dimethylaminopropy) carbodiimide (EDC) and N-hydroxysuccinimide (NHS), bovine serum albumin (BSA) and naphthyl phosphate (NP) were purchased from Sigma Chemical Co. (USA). Dylight 650 NHS ester and dylight 488 were procured from Thermo Scientific, USA. Screen printed electrodes (SPE) were products of CH Instruments (USA, Model TE 100) with 3 mm diameter carbon paste working electrode, a counter electrode and Ag/AgCl reference electrode. AP labeled rabbit anti-IgG and protein-A, BSA sepharose column were purchased from Bangalore Genei, India. All other reagents used in the present study were of analytical grade and used as received. Ultrapure distilled water from a Millipore system was used in all studies. Highly specific anti-diuron antibodies were generated in-house as described previously (Sharma and Suri, 2011). For this, a well characterized protein-hapten conjugate with optimum hapten density was used for antibody production against diuron. Immunoglobulin G (IgG) fractions were purified from the sera using a protein-A sepharose column and subsequently passed through BSA-sepharose column to remove anti-BSA antibody fractions. The eluted antibody fractions were pooled, and its activity and specificity was confirmed by ELISA.
2.2. Synthesis of fG–GO nanocomposites
Graphite oxide was synthesized by the oxidation of exfoliated graphite using the modified Hummer’s method from graphite powders using NaNO3, H2SO4, and KMnO4 in an ice bath as reported in literature (Cote et al., 2009). A stock solution of GO single layers (~0.20 mg mL−1) was obtained after multiple sedimentation steps to remove unexfoliated materials. GO thin films were obtained by filtration through anodized aluminum oxide (AAO) membrane with a nominal pore size of 0.02 µm. The thin GO film can be peeled off from the AAO filter after drying. For preparing fG–GO nanocomposite on SPE, a suspension of GO (1 mg mL−1) was first prepared by dissolving in water followed by 1 h sonication. 10 µL of GO (2.5 µg mL−1) was drop-casted on the working area of SPEs followed by an incubation for 2 h at 37 °C. A potential reductive scan from 0 to −1.5 V with the scan rate of 50 mV s−1 was applied for electrochemical conversion of GO to fG–GO nanocomposite on SPE.
2.3. fG–GO characterization
2.3.1. Cyclic voltammetry
Cyclic voltammetry (CV) was carried out in 2.5 mM ferrocyanide solution using electrochemical workstation (CH Instruments, 600D). Voltammograms were recorded by taking three successive reductive scans between 0 and −1.5 V at a scan rate of 50 mV s−1. Different concentrations (2.5–10 µg mL−1) of GO were selected to dropcast on SPE and the concentration was optimized by taking CV scans after each reductive scan.
2.3.2. Spectroscopic characterization
For FTIR analysis (Thermo Scientific Nicolet IS10 system), samples were prepared electrochemically on indium tin oxide (ITO) films by applying the potential between 0 and −1.5 V. The samples were scraped off from the surface and spectra were recorded in dry KBr pellet in the range of 400–4000 cm−1. The UV–vis spectra of the samples prepared on ITO films were recorded on Specord 600 (Analytikjena) in the range of 200–600 nm.
2.3.3. Thermogravimetric analysis
Thermogravimetric analysis was carried out using TA Instruments UK (Model: SDT Q600) in the temperature range from ambient to 700 °C at a heating rate of 5 °C min−1. Samples were loaded on alumina pan and the analysis was done in nitrogen environment (10 mL min−1). The corresponding weight loss percentage with decomposition temperatures of graphite, GO and nanocomposite were recorded by normalized TGA spectra.
2.3.4. High resolution TEM and XRD analysis
HR-TEM with selective area diffraction (SAD was conducted in FEI-TECNAI G2 F20 twin microscope) operating at 200 kV was used for morphological characterization of fG–GO nanocomposite formed. For HR imaging 2000 µm condenser 1 and 150 µm condenser 2 apertures were used at spot size 3 at 4200 V extraction voltage. Aberrations were removed by correcting the condenser and objective astigmatism. Micrographs were captured on Gatan Orius CCD camera after doing gain and dark references. Copper grids were used for viewing and the same concentration of GO was drop casted on grids as on SPE. fG–GO nanocomposite was formed on the grids by keeping them on the working electrode on SPE and the same potential was applied. X-Ray diffraction (XRD) spectroscopy was carried out to confirm the interspacing between the layers of nanocomposite in a powder XRD system (Bruker AXS D8) equipped with Cu Kα radiation (λ=0.1–10 nm) and SOL XE detector.
2.3.5. Raman spectroscopy
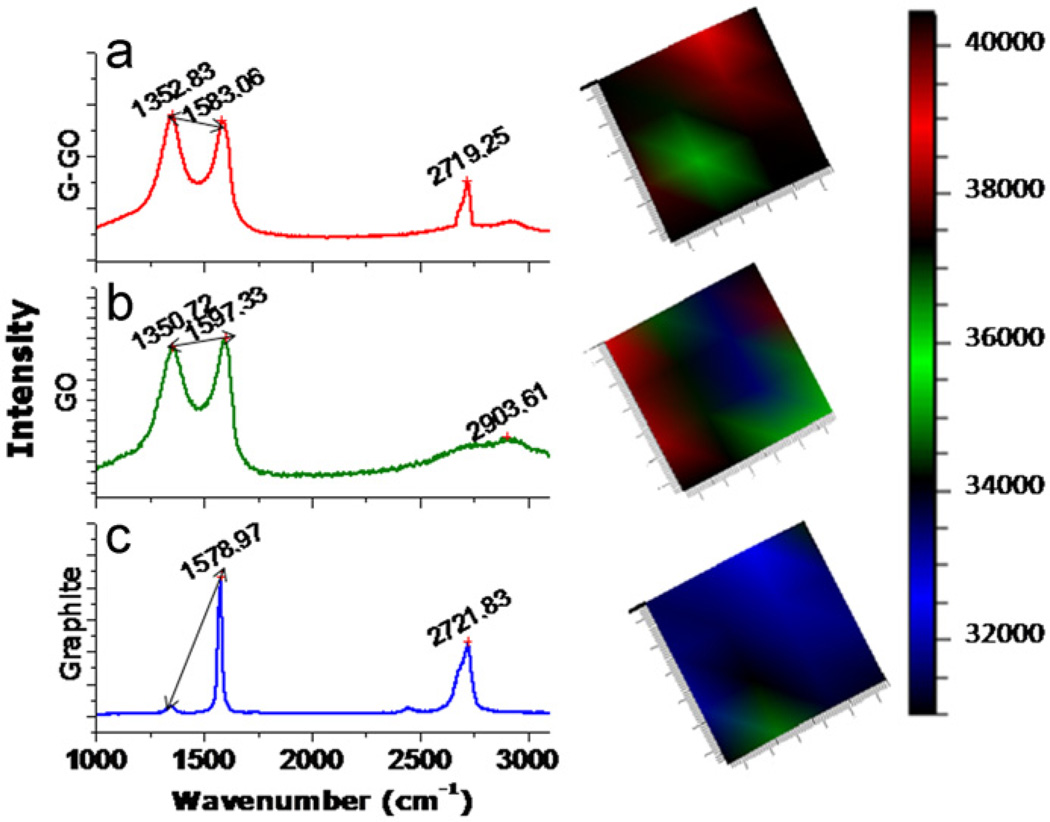
Raman area scans on SPE (grating: 1200 lines mm−1) along with mapping studies were performed in a Raman spectrometer attached with confocal microscope (Renishaw) setup using 785-HP-NIR laser. The optical microscope imaging was used to locate randomly the selected area on SPE. The spectra of first order Raman scattering (D and G peaks) were observed around 1350 cm−1 and 1600 cm−1 respectively. The mapping studies were done in the G band region at 1580 cm−1. Different colors in the mapping reflected different layer thicknesses. The prism color sequence red–green–blue corresponds to decreasing Raman intensity.
2.4. Electrochemical immunoassay using fG–GO nanocomposite
The intact carboxyl groups (–COOH) of the fG–GO nanocomposite were used for bio-interface development using aqueous phase carbodiimide activation chemistry. The carboxyl groups present on fG–GO nanocomposite were first activated by adding 50 µL of 100 mM borate buffer having a mixture of 100 mM EDC and 100 mM NHS. The electrodes were incubated for 2 h at 37 °C followed by washing with buffer to remove excess EDC and NHS. BSA–DCPU (protein–hapten) conjugate of 1:10 M ratio (Sharma and Suri, 2011) was drop casted (50 µL) on activated fG–GO electrodes, and incubated for 2 h at 37 °C followed by washing to remove unbound conjugate. A competitive inhibition immunoassay was performed, in which the target molecule (diuron) interacts with the limited number of antibody binding sites (antidiuron antibodies) and competes with protein–hapten conjugate (BSA–DCPU) bound to the surface of electrodes. The optimized concentration of antibody (25 µg mL−1) and varying concentrations of diuron from 1 pg mL−1 to 1 µg mL−1 (50 µL each) were mixed together and incubated for 20 min at RT. The respective solutions were drop casted on the electrodes and incubated for 1 h at 37 °C followed by washing with PBS. 50 µL of anti-rabbit IgG-alkaline phosphatase (1:20 K diluted in PBS) was incubated for 30 min at 37 °C. The electrodes were finally washed 4 times with PBS and 2 times with PBS/T. For the electrochemical immunoassay development, 50 µL of substrate solution (1-napthyl phosphate) at concentration of 2 mg mL−1 prepared in 0.1 M Tris–HCl (pH 10) containing 10 mM MgCl2 was added to the electrodes and incubated for 15 min at 37 °C. The electrodes were subjected to voltammetric scan from −0.1 V to+0.6 V at amplitude of 25 mV and frequency of 15 Hz. The height of resulting 1-naphthol oxidation peak waveform was recorded using electrochemical workstation.
3. Results and discussion
3.1. Electrochemical synthesis of fG–GO nanocomposite
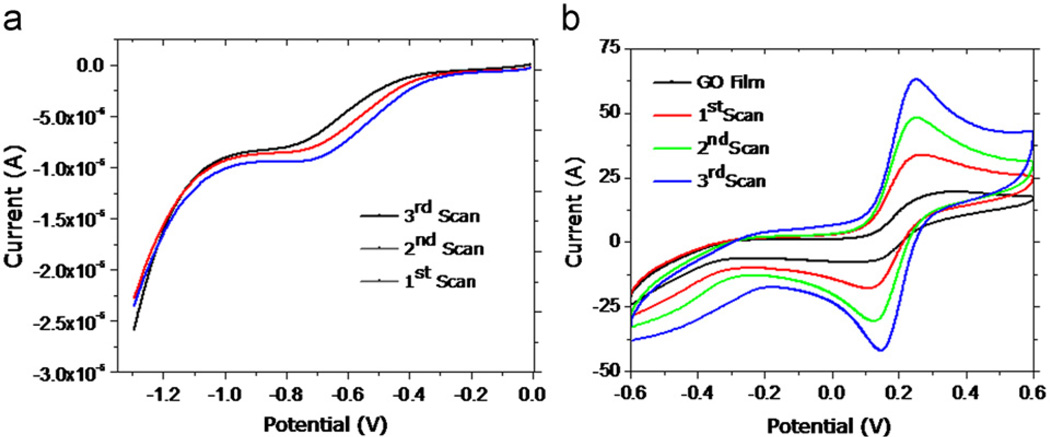
Nanocomposite (fG–GO) on SPE was prepared electrochemically after the successive reductive scans of GO in PBS. The cyclic voltammetry (CV) response revealed that a concentration of 2.5 µg mL−1 was optimum as indicated by showing maximum current signal response at this concentration (Fig. S1). Higher concentrations of GO on SPE probably inhibit ion diffusion (Na+ in PBS buffer) due to restacking of GO thereby affecting the current response (Ling et al., 2010). For electrochemical conversion, different scan rates were selected and on the basis of maximum current obtained in CV scans, 50 mV s−1 was optimized for further studies. For the confirmation of efficient electrochemical reduction of GO, three successive reductive scans were carried out at potential between 0 and −1.5 V, leading to the formation of the fG–GO nanocomposite on SPE surface (Fig. 1a). From the voltammograms, it was confirmed that most of the GO on SPE was reduced during 1st scan itself. After the 3rd scan, we could see only a small change in the reductive peak, probably because of the concentration of Na+ decreases with subsequent scans. The corresponding cyclic voltammogram (CV) scans recorded for the redox of small ion (Fe2+) showed an increased intensity of current signal for oxidative and reductive peaks from 1st to 3rd reductive scan of GO (Fig. 1b). This can be explained because some ions mainly Na+ ions present in electrolyte (PBS buffer) have accessibility to different graphene oxide layers. It has also been reported earlier that the electrochemical reduction removes partial oxygen from GO, leading to the increase in the hydrophobicity of graphene sheets (Huang and Chen, 2010). However the electrochemical reduction can only take place at the electrochemical triple-phase boundary, which is accessible to both electrons from the electrode and ions from the electrolyte at very low potentials. Under such condition the positively charged ions present in the electrolyte could be intercalated between graphene oxide layers. The intercalation of these ions prevents electrochemically reduced graphene sheets from restacking (Alcantara et al., 2001).
Fig. 1.
In-situ synthesis of fG–GO nanocomposites on SPE surface. An optimum concentration of GO (2.5 µg mL−1) was drop-casted on SPE: (a) Three successive reductive scans carried out between 0 and −1.5 V at the scan rate 0.05 V s−1. (b) Corresponding cyclic voltammograms recorded in ferrocyanide solution after each reductive scan of GO.
3.2. Structural and morphological characterization of fG–GO nanocomposite
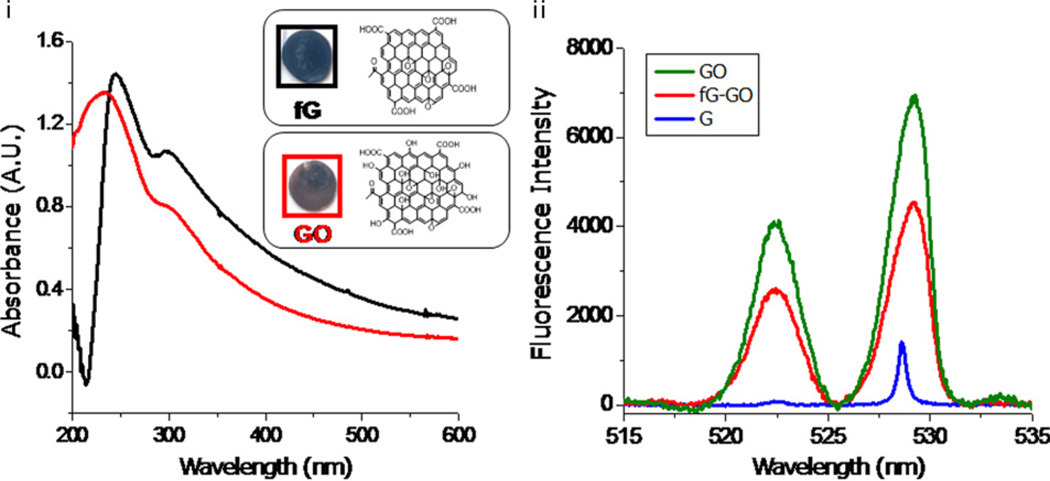
The spectral analysis by FTIR reveals that the electrochemically converted nanocomposite from chemically synthesized GO is left with inadequate major detrimental oxygen functionalities (–OH) (Fig. S2). It was observed that the characteristic O–H stretching vibrations (oxygen functionalities) at 3400 cm−1 found in GO were significantly reduced in fG–GO nanocomposite. However, stretching vibrations from C=O at 1720 cm−1 are still observed in synthesized nanocomposite, while C–O stretching vibrations reflected at 1110 cm−1 becomes sharper. This may be attributed due to intact carboxyl groups after electrochemical reduction (Rodil et al., 2009). The electrochemically conversion of fG–GO from GO was further confirmed by visualizing from their respective colors on the substrate (inset of Fig. 2a). The color of the deposited film changes from brown to black after reduction. This may be attributed to the removal of hydroxyl groups in functionalized graphene. Similar observations were also reported by Kim and his colleagues, justifying that when graphene is deposited on a substrate the background absorption increases which hinders the identification of graphene sheets on a substrate (Kim et al., 2010). The UV–vis spectra of GO and fG–GO nanocomposite in solution depicts peaks at 225 nm and 245 nm respectively (Fig. 2a). A red-shift from 225 nm to 245 nm was observed, indicating that there is a less degree of π–π conjugation in GO which is revived within fG–GO nanocomposite upon electrochemical reduction of (–OH) groups of GO. Also, there is a small absorption peak observed at ~305 nm which may arise due to incomplete reduction of GO to fG–GO nanocomposite. Further surface characterization of nanocomposite was carried out by measuring the fluorescence intensity of GO and the composites formed with respect to graphite (Fig. 2b). The fluorescence signal intensity obtained for GO was higher than fG–GO nanocomposite and graphite as such. Although GO is known to show a weaker fluorescence signal than graphene (Dong et al., 2011), yet it is an efficient fluorescence quencher through both the short-range interactions such as electron or charge transfer, and long-range energy transfers. Because of the quenching effect of GO on nanocomposite, we observed lower fluorescence values for nanocomposite than GO, thus confirming the formation of fG–GO nanocomposite on electrode surface.
Fig. 2.
(a) The UV–vis spectra of the GO and fG–GO nanocomposite in solution. Inset shows the corresponding images on ITO substrate. (b) Fluorescence intensity of GO and the fG–GO nanocomposites formed with respect to graphite.
The thermogravimetric analysis was carried out to analyze the thermal stability of synthesized fG–GO nanocomposite over its precursor molecule GO. The parent molecule, graphite was found to be highly stable even up to 600 °C, showing a very little mass loss (2–3%). This is mainly attributed due to the desorption of physically adsorbed water. In case of GO, a significant mass drop (9.9%) was observed even at 100 °C (Fig. S3) indicating the presence of large number of –OH functionalities. Two other significant mass losses at 204 °C and 300 °C respectively are mainly due to the decomposition of the labile oxygen-containing functional groups, yielding CO and CO2. Similar mass drops at respective temperatures have also been reported previously by Stankovich et al. (2007). On the other hand, the fG–GO nanocomposite did not present a significant mass drop (~4%) due to loss of detrimental oxygen functionality (–OH) over the entire temperature range (before pyrolysis). Weight loss pattern of labile oxygen- containing functional groups in TGA studies thus indicated that the electrochemical reduction process efficiently transformed GO into nanocomposite.
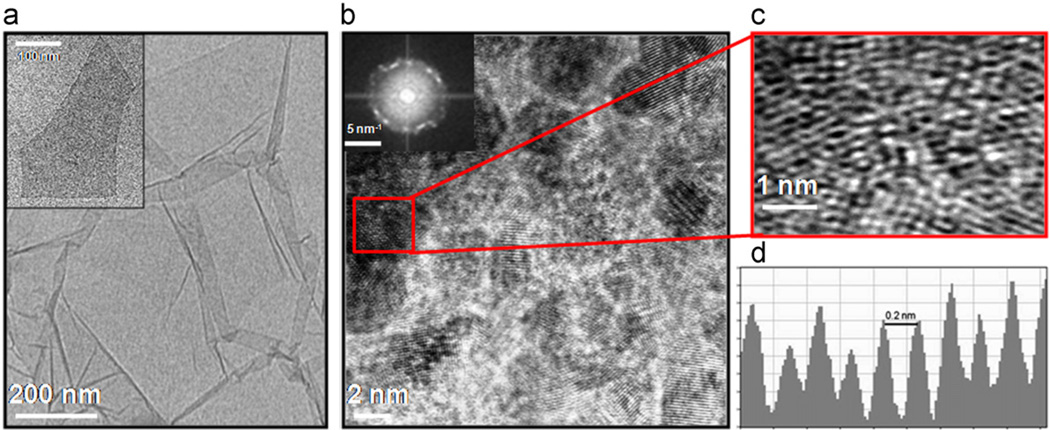
Fig. 3 shows the TEM micrographs of the chemically synthesized multi-layered GO film (3a) with single sheet shown in the inset of the figure. At low magnification the GO sheets appeared to have many fold as clearly visible in the micrograph whereas a single sheet is highly transparent. Fig. 3b depicted the formation of nanocomposite after electrochemical reduction presenting the crystalline lattice structure. The enlarged crystalline lattice patterns are clearly visible in TEM micrograph (Fig. 3c), However, some scarcely obscured patterns, visible in the micrograph, are probably due to stacking of GO sheets during electrochemical transformation process (Fig. 3b). The respective selective area diffraction pattern (inset of Fig. 3b) shows some of the characteristic spots in ring form indicating the formation of fG–GO sheets. The average interlayer distance (2 Å) of the selected area marked as red is depicted in Fig. 3d demonstrating crystalline order of the underlying lattice over length-scales of 1.8 nm. 10 layers of fG–GO nanocomposite were formed in a stack of ~1.8 nm. Further characterization of the nanocomposite by XRD (Fig. S4) reveals that the basal distance of GO obtained from the XRD spectra is approximately 10.39 Å (2y~9°) which is significantly lower as compared to that of graphite (34 Å). With the increase of the reduction scan numbers, the intensity of the peak at 9° is significantly reduced, and a new broad peak appeared at 2y=19.7°. This may be attributed due to the removal of some oxygen-containing functional groups in the nanocomposite. Further reduction leads to complete disappearance of the peak at 9° (Fan et al., 2011). The inter spacing of the electrochemically synthesized nanocomposite was also studied by XRD. A small variation in the interlayer distance (~1.39 Å) as determined by XRD (3.39 Å) in comparison to TEM (2 Å) could be explained by the fact that intercalated water molecules evaporate when focusing the electron beam on the sample under vacuum (Kudin et al., 2008).
Fig. 3.
(a) HR-TEM micrograph of the chemically synthesized multi-layered GO film with single sheet shown in the inset. (b) Crystalline lattice structure of nanocomposite after electrochemical reduction with corresponding SAD pattern (left top). (c) Enlargement as marked, showing the crystalline lattice patterns of the nanocomposite. The average interlayer distance of fG–GO is shown in (d).
The Raman spectroscopy was done to extract the characteristic features of band gap of GO and the nanocomposite formed. The Raman spectra in Fig. 4(a) graphite flakes, (b) GO and (c), fG–GO nanocomposite exhibit the characteristic D and G bands, at ~1350 cm−1 and 1600 cm−1 corresponding to the A1g and the E2g mode respectively (Kudin et al., 2008). The Raman spectra of G–GO nanocomposite, GO film and graphite flakes (Fig. 4 a–c) suggested that there is a remarkable shift in G band from 1578 cm−1 (graphite), 1597 cm−1 (GO) to 1583 cm−1 (fG–GO nanocomposite). However, the electrochemical reduction of GO restores the G band corresponding to the recovery of hexagonal network of carbon atoms with defects. A similar shift was observed in D band i.e. 1350 cm−1 (GO)–1352 cm−1 (fG–GO nanocomposite). The ratio of the integrated intensities of the D and G bands (ID/IG) is usually taken as an indicator of the relative disorder present in graphitic structures (Rodil et al., 2009). In the present study, ID/IG ratio for both GO and fG–GO comes out to be 0.94 and 1.0 indicating high degree of orderness due to restoration of the sp2 network during the chemical as well as electrochemical reduction respectively. If the reduction process is not sufficient, the aromatic areas will remain in the structure and thus the relative intensity of D band can rise, leading to the increase in ID/IG. Similar finding was also observed by Stankovich and colleagues highlighting the Raman spectrum of the reduced GO that contains both G and D bands (at 1584 and 1352 cm−1 respectively). The significantly small increase in ID/IG intensity ratio compared to that in fG–GO nanocomposite clearly depicts the formation of new graphitic domains that are smaller in size (but more in number) to the one present in GO before reduction. Also due to second-order phonon scattering the spectra of graphite and fG exhibit characteristic peak at about 2721 and 2719 cm−1 respectively. The relative intensity and sharpness of the lower-frequency peak in this region increases with decreasing graphene thickness and remains as the only peak around 2700 cm−1 for a single layer graphene (Ferrari et al., 2006). The Raman spectroscopy further supports the electrochemical observation by putting an insight vision that the 3 reductive scans are essential for the reduction of GO to fG–GO nanocomposite. Fig. 4(a–c) (right) displays the mapping of the Raman intensity of G band at 1580 cm−1. The color sequence red–green–blue corresponds to decreasing Raman intensity. Different colors in the image reflect different layer thicknesses. It was observed that the most oriented structure with highest Raman intensity was observed in fG–GO nanocomposite.
Fig. 4.
The Raman spectra of (a) graphite flakes (b) GO film and (c) fG–GO nanocomposites. The figures in right display the mapping of the Raman intensity of G band at 1580 cm−1. The color sequence red–green–blue corresponds to decreasing Raman intensity.
Taken together, TEM, Raman mapping and fluorescence observations indicate that the formation of fG–GO nanocomposite on SPE was successful and fG–GO nanocomposite remained as individual, almost single-layer objects on electrode surface.
3.3. fG–GO nanocomposite based electrochemical immunoassay
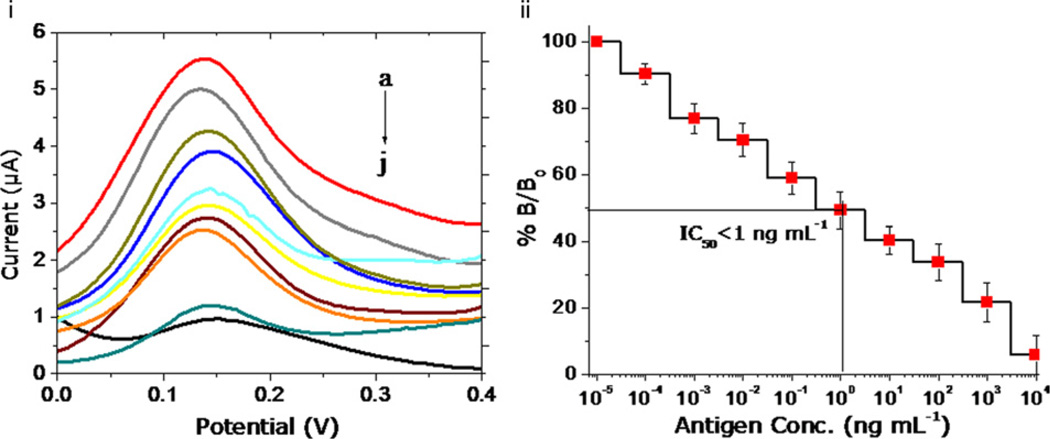
The characterized fG–GO nanocomposite, as synthesized by controlled electrochemical process was used for biofunctionalization and immunoassay development. The enhanced electrical and functionalized properties of fG–GO hybrid film on SPE were further subjected to study the electrochemical performance of developed immunosensor system for diuron detection. A nanocomposite film of fG–GO on SPE, as synthesized electrochemically, was used for functionalization of a protein–hapten (BSA– DCPU) conjugate via available—COOH groups on nanocomposite. The immunoassay in the competitive inhibition approach generates an electroactive compound (1-napthol) corresponding to the concentration of analyte. Standard diuron samples prepared at different concentration were pre-incubated with anti-diuron antibody, and the mixture was spread on the DCPU–BSA conjugate coated electrodes. The employed secondary antibody labeled with alkaline phosphatase (AP) converted napthyl phosphate into its electroactive form napthol. Fig. 5i shows the resulting square wave voltammogram presenting an oxidation peak for 1-naphthol at a potential of +150 mV v/s screen printed Ag/AgCl reference electrodes.
Fig. 5.
(i) Electrochemical response curve of fG–GO modified SPE in a competitive immunoassay format for the different concentrations of standard diuron samples (a) 0, (b) 0.0001, (c) 0.001, (d) 0.01, (e) 0.1, (f) 1, (g) 10, (h) 100, (i) 1000, and (j) 10,000 ng mL−1. (ii) Calibration plot for diuron in the range from 0.1 pg mL−1 to 10 µg mL−1 (n=3). The antibody concentration of 25 µg mL−1 was selected for immunoassay development.
The signal response with increasing concentration of free diuron (picogram to microgram per milliliter range) was normalized by % B/B0 transformation (Sharma et al., 2010). This has been depicted in Fig. 5ii demonstrating the concentration profile of diuron induced electrochemical signal change in a competitive assay format. It exhibited a dynamic range of diuron (0–1000 ngmL−1) with a low detection limit (LOD of ~0.01 pg mL−1) as compared to conventional ELISA (LOD of ~10 pg mL−1) in standard diuron samples (Sharma et al., 2011). The increase in sensitivity of the developed immunosensor system has been attributed since the functionalized graphene in fG–GO nanocomposite possess the good electrochemical characteristics due to the oxygen containing groups (epoxy) leading to rapid electron transfer (Zhang et al., 2011).
4. Conclusions
A novel fG–GO nanocomposite synthesized by controlled in-situ electrochemical approach offers the dual electrical and chemical synergies by showing good electronic properties of functionalized graphene and chemical functionality of GO for the development of a highly sensitive immunoassay format. Together, TEM, XRD, TGA, Raman mapping and fluorescence observations indicate that the formation of fG–GO nanocomposite remained as individual, almost single-layer objects on electrode surface. Modified electrodes used in competitive inhibition immunoassay format exhibited an excellent sensitivity with a limit of detection around 0.01 pg mL−1 for diuron. These results significantly demonstrated that a well characterized nano-hybrid can easily be prepared electrochemically on any transducer surface, thus promising their practical use in ultrahigh sensitive immuosensing applications.
Supplementary Material
Acknowledgments
Authors gratefully acknowledge the support of Prof. Samrat Mukhopadhyay for Laser Raman facility of IISER Mohali, Mr. William Goossens for Confocal imaging (CMRC, Chicago, US). This work was also supported by the Indo-Russia Joint Research Grant ILTP A-1.29. The authors greatly acknowledge Prof. Jiaxing Huang and Laura Cote for valuable suggestions and discussions on GO synthesis.
Footnotes
Appendix A. Supporting information
Supplementary data associated with this article can be found in the online version at http://dx.doi.org/10.1016/j.bios.2012.06.061
References
- 1.Alcantara R, Jimenez-Mateos JM, Lavela P, Tirado JL. Electrochemistry Communications. 2001;3:639–642. [Google Scholar]
- 2.Allen MJ, Tung VC, Kaner RB. Chemical Reviews. 2010;110:132–145. doi: 10.1021/cr900070d. [DOI] [PubMed] [Google Scholar]
- 3.Bunch JS, Van der Zande AM, Verbridge SS, Frank IW, Tanenbaum DM, Parpia JM, Craighead HG, McEuen PL. Science. 2007;315:490–493. doi: 10.1126/science.1136836. [DOI] [PubMed] [Google Scholar]
- 4.Cote LJ, Kim F, Huang J. Journal of the American Chemical Society. 2009;131:1043–1049. doi: 10.1021/ja806262m. [DOI] [PubMed] [Google Scholar]
- 5.Dong X, Huang W, Chen P. Nanoscale Research Letters. 2011;6:60–65. doi: 10.1007/s11671-010-9806-8. [DOI] [PMC free article] [PubMed] [Google Scholar]
- 6.Fan ZJ, Kai W, Yan J, Wei T, Zhi LJ, Feng J, Ren Y, Song LP, Wei F. ACA Nano. 2011;5:191–198. doi: 10.1021/nn102339t. [DOI] [PubMed] [Google Scholar]
- 7.Ferrari AC, Meyer JC, Scardaci V, Casiraghi C, Lazzeri M, Mauri F, Piscanec S, Jiang D, Novoselov KS, Roth S, Geim AK. Physical Review Letters. 2006;97:187401–187404. doi: 10.1103/PhysRevLett.97.187401. [DOI] [PubMed] [Google Scholar]
- 8.Geim AK, Novoselov KS. Nature Materials. 2007;6:183–191. doi: 10.1038/nmat1849. [DOI] [PubMed] [Google Scholar]
- 9.Gilje S, Han S, Wang M, Wang KL, Kaner RB. Nano Letters. 2007;7:3394–3398. doi: 10.1021/nl0717715. [DOI] [PubMed] [Google Scholar]
- 10.Huang YS, Chen P. Advanced Materials. 2010;22:2818–2823. doi: 10.1002/adma.200904235. [DOI] [PubMed] [Google Scholar]
- 11.Katneson MI. Materials Today. 2007;10:20–27. [Google Scholar]
- 12.Kim J, Kim F, Huang J. Materials Today. 2010;13:28–38. [Google Scholar]
- 13.Kudin KN, Ozbas B, Schniepp HC, Prud’homme RK, Aksay IA, Car R. Nano Letters. 2008;8:36–41. doi: 10.1021/nl071822y. [DOI] [PubMed] [Google Scholar]
- 14.Li D, Kraner RB. Science. 2008;320:1170–1171. doi: 10.1126/science.1158180. [DOI] [PubMed] [Google Scholar]
- 15.Li YC, Du B, Yang M, Li Y, Wu D, Zhao Y, Dai Y, Wei Q. Biomaterials. 2011;32:2117–2123. doi: 10.1016/j.biomaterials.2010.11.058. [DOI] [PubMed] [Google Scholar]
- 16.Ling Q, Xiaowei Y, Xinglong G, Wenrong Y, Zi-Feng M, Gordon GW, Dan L. Chemistry—A European Journal. 2010;16:10653–10658. [Google Scholar]
- 17.Liu Z, Robinson JT, Sun X, Dai H. Journal of the American Chemical Society. 2008;130:10876–10877. doi: 10.1021/ja803688x. [DOI] [PMC free article] [PubMed] [Google Scholar]
- 18.Mohanty N, Berry V. Nano Letters. 2008;8:4469–4476. doi: 10.1021/nl802412n. [DOI] [PubMed] [Google Scholar]
- 19.Park S, Ruoff RS. Nature Nanotechnology. 2009;4:217–224. doi: 10.1038/nnano.2009.58. [DOI] [PubMed] [Google Scholar]
- 20.Rodil SV, Paredes JI, Alonso AM, Tascón JMD. Journal of Materials Chemistry. 2009;19:3591–3593. [Google Scholar]
- 21.Schedin F, Geim AK, Morozov SV, Hill EW, Blake P, Katsnelson MI, Novoselov KS. Nature Materials. 2007;6:652–655. doi: 10.1038/nmat1967. [DOI] [PubMed] [Google Scholar]
- 22.Sheng L, Miao JRY, Wang J, Wang E. Biosensors and Bioelectronics. 2011;26:3494–3499. doi: 10.1016/j.bios.2011.01.032. [DOI] [PubMed] [Google Scholar]
- 23.Shao Y, Wang J, Engelhard M, Wang C, Lin Y. Journal of Material Chemistry. 2010;20:743–748. [Google Scholar]
- 24.Sharma P, Gandhi S, Chopra A, Sekar N, Suri CR. Analytica Chimica Acta. 2010;676:87–92. doi: 10.1016/j.aca.2010.07.042. [DOI] [PubMed] [Google Scholar]
- 25.Sharma P, Suri CR. Bioresource Technology. 2011;102:3119–3125. doi: 10.1016/j.biortech.2010.10.076. [DOI] [PubMed] [Google Scholar]
- 26.Sharma P, Sablok K, Bhalla V, Suri CR. Biosensors and Bioelectronics. 2011;26:4209–4212. doi: 10.1016/j.bios.2011.03.019. [DOI] [PubMed] [Google Scholar]
- 27.Stankovich S, Dikin DA, Piner RD, Kohlhaas KA, Kleinhammes A, Jia Y, Wu Y, Nguyen ST, Ruoff RS. Carbon. 2007;45:1558–1565. [Google Scholar]
- 28.Sun X, Liu Z, Welsher K, Robinson JT, Goodwin A, Zaric S, Dai H. Nano Research. 2008;1:203–212. doi: 10.1007/s12274-008-8021-8. [DOI] [PMC free article] [PubMed] [Google Scholar]
- 29.Wang Y, Wan Y, Zhang D. Electrochemistry Communications. 2010;12:187–190. [Google Scholar]
- 30.Yang W, Ratinac KR, Ringer SP, Thordarson P, Gooding JJ, Braet F. Angewandte Chemie International Edition in English. 2010;49:2114–2138. doi: 10.1002/anie.200903463. [DOI] [PubMed] [Google Scholar]
- 31.Zhang Y, Sun X, Zhu L, Shen H, Jia N. Electrochimica Acta. 2011a;56:1239–1245. [Google Scholar]
- 32.Zhang L, Li Y, Zhang L, Li DW, Karpuzov D, Long YT. International Journal of Electrochemical Science. 2011b;6:819–829. [Google Scholar]
Associated Data
This section collects any data citations, data availability statements, or supplementary materials included in this article.


