Abstract
High-throughput single-cell transcriptomics offers an unbiased approach for understanding the extent, basis, and function of gene expression variation between seemingly identical cells. Here, we sequence single-cell RNA-Seq libraries prepared from over 1,700 primary mouse bone marrow derived dendritic cells (DCs) spanning several experimental conditions. We find substantial variation between identically stimulated DCs, in both the fraction of cells detectably expressing a given mRNA and the transcript’s level within expressing cells. Distinct gene modules are characterized by different temporal heterogeneity profiles. In particular, a “core” module of antiviral genes is expressed very early by a few “precocious” cells, but is later activated in all cells. By stimulating cells individually in sealed microfluidic chambers, analyzing DCs from knockout mice, and modulating secretion and extracellular signaling, we show that this response is coordinated via interferon-mediated paracrine signaling. Surprisingly, preventing cell-to-cell communication also substantially reduces variability in the expression of an early-induced “peaked” inflammatory module, suggesting that paracrine signaling additionally represses part of the inflammatory program. Our study highlights the importance of cell-to-cell communication in controlling cellular heterogeneity and reveals general strategies that multicellular populations use to establish complex dynamic responses.
INTRODUCTION
Variation in the component molecules of individual cells1–7 may play an important role in diversifying population-level responses8–11, but also poses therapeutic challenges4,5. While pioneering studies have explored heterogeneity within cell populations by focusing on small sets of preselected markers1,2,4–6,8,12, single-cell genomics promises an unbiased exploration of the molecular underpinnings and consequences of cellular variation13–17.
We previously16 used single-cell RNA-Seq to identify substantial differences in mRNA transcript structure and abundance across 18 bone marrow-derived mouse dendritic cells (DCs) 4 hours (h) after stimulation with lipopolysaccharide (LPS, a component of gram-negative bacteria). Many highly expressed immune response genes were distributed bimodally amongst single cells, originating, in part, from closely related maturity states and variable activation of a key antiviral circuit. These observations raised several questions about the causes and roles of single-cell variability during the innate immune response: How does variability change during the response? Do different stimuli elicit distinct variation patterns, especially in stimulus-relevant pathways? Does cell-to-cell communication promote or restrain heterogeneity? Addressing these requires profiling large numbers of cells from diverse conditions and genetic perturbations.
Here, we sequenced over 1,700 SMART-Seq15 single-cell RNA-Seq libraries along time courses of DCs responding to different stimuli (Fig. 1, Extended Fig. 1a). Combining computational analyses with diverse perturbations – including isolated stimulation of individual cells in sealed microfluidic chambers and genetically and chemically altering paracrine signaling – we show how antiviral and inflammatory response modules are controlled by positive and negative intercellular paracrine feedback loops that both promote and restrain variation.
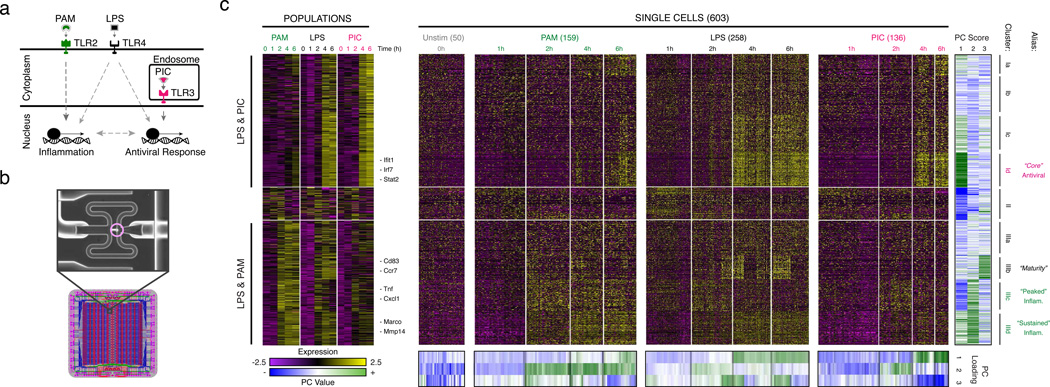
Figure 1. Microfluidic-enabled single-cell RNA-Seq of DCs stimulated with pathogenic components.
(a) Schematic of Toll-like receptor (TLR) sensing of PAM by TLR2, LPS by TLR4, and PIC by TLR3 (SI). (b) Microfluidic capture of a single DC (top, cell circled in purple) on a C1 chip (CAD drawing, bottom). (c) Time-course expression profiles for induced genes (rows) in DCs (columns) at 0,1,2,4,&6h post stimulation with PAM (green), LPS (black), and PIC (magenta) within populations (left) and individual cells (right). Far right: gene projection scores onto the first three PCs (columns); bottom: contributions of each cell (columns) to the first three PCs (rows).
RESULTS
Microfluidics-based Single-Cell RNA-Seq
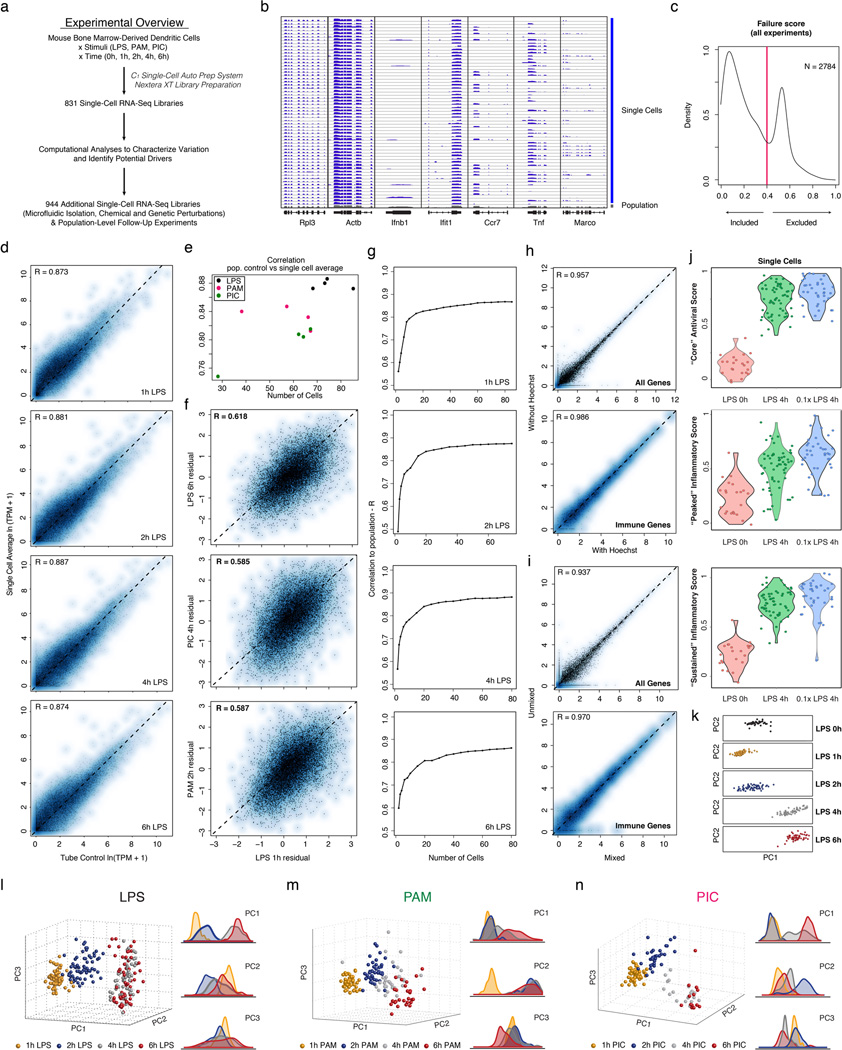
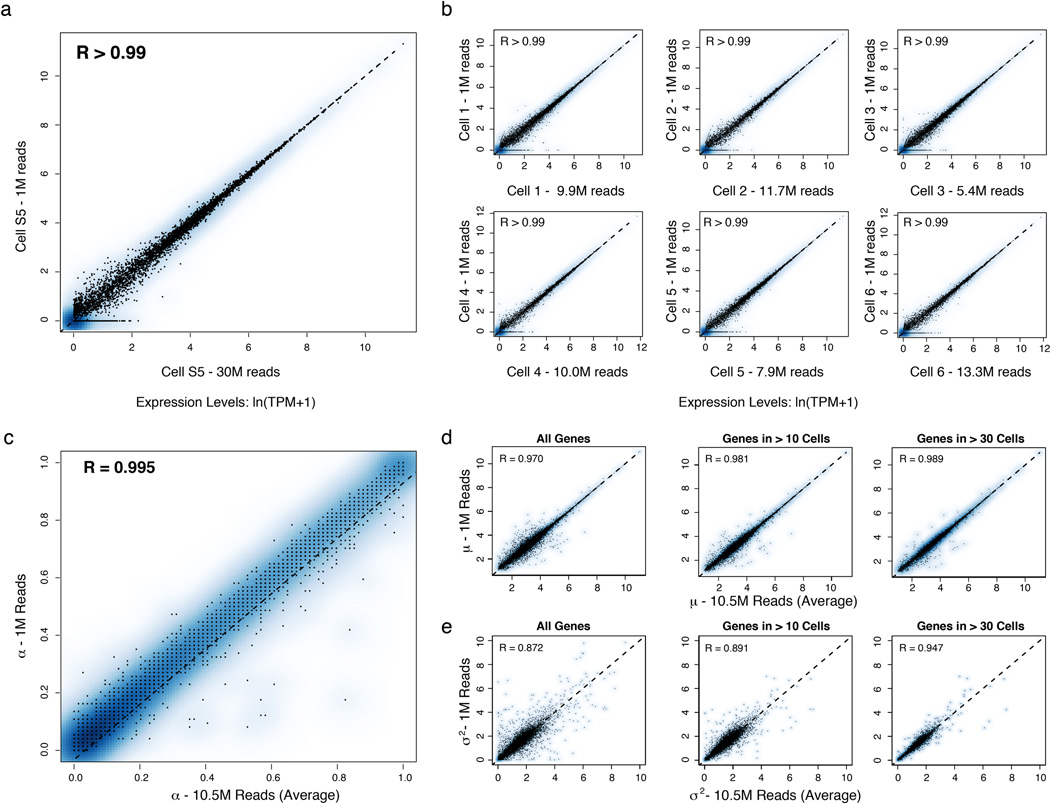
We used the C1 Single-Cell Auto Prep System (Fluidigm; Fig. 1b) and a transposase-based library preparation strategy to perform SMART-Seq15 (Supplementary Information (SI)) on 1,775 single DCs, including both stimulation time courses (0,1,2,4&6h) for three pathogenic components18 (LPS, PIC (viral-like double stranded RNA), and PAM (synthetic mimic of bacterial lipopeptides)) and additional perturbations (Fig. 1, Extended Fig. 1; SI). For most conditions, we captured up to 96 cells (87±8 (average ± standard deviation)), and generated a matching population control (Fig. 1c, SI, Supplementary Table 1). We prepared technically-matched culture and stimulation replicates for the 2h and 4h LPS stimuli, and independent biological replicates for the unstimulated (0h) and 4h LPS experiments (SI). We sequenced each sample to an average depth of 4.5±3.0 million read pairs, since single-cell expression estimates stabilized at low read-depths13,19 (Extended Fig. 2). Our libraries’ quality was comparable to published SMART-Seq data15,16 (Extended Fig. 1b, Supplementary Tables 1–2). Overall, we successfully profiled 831 cells in our initial time courses and 944 cells in subsequent experiments (Extended Fig. 1a, Supplementary Table 1–2). We excluded another 1,010 libraries with stringent quality criteria (SI, Extended Fig. 1c).
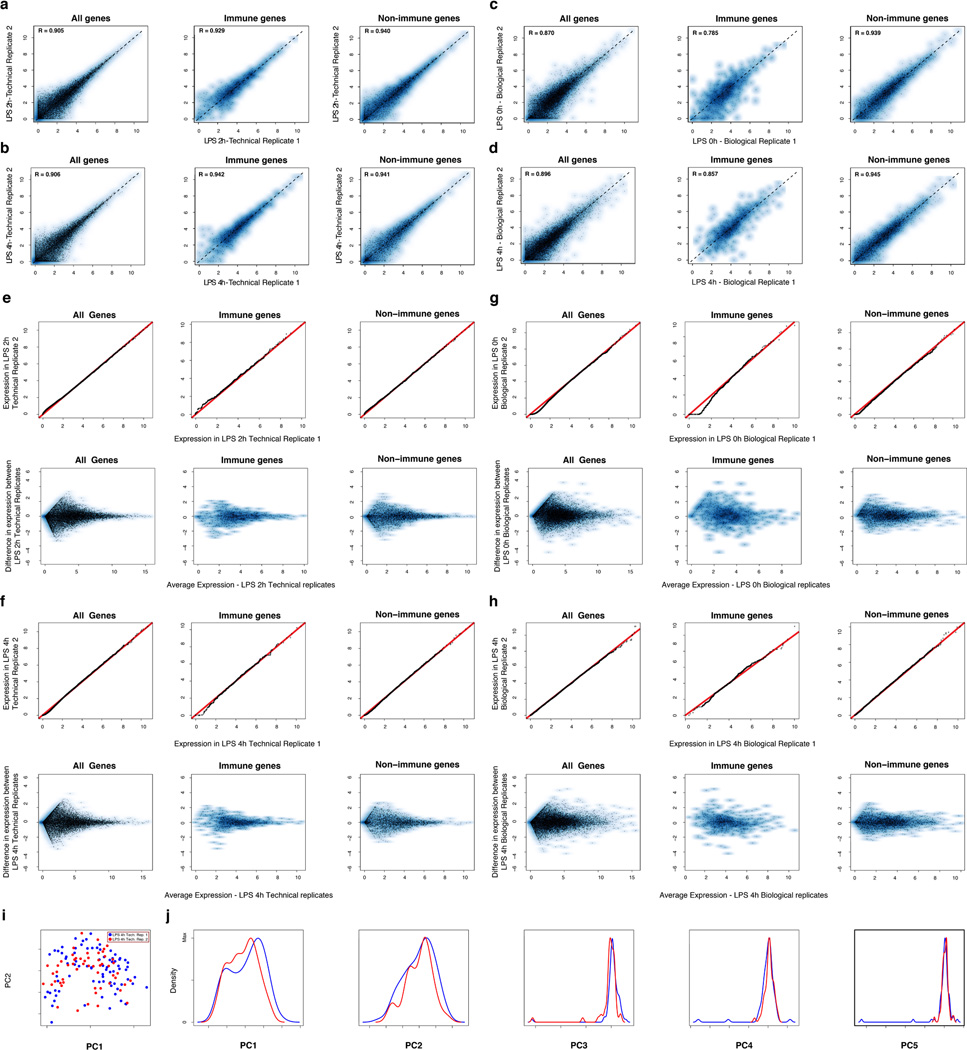
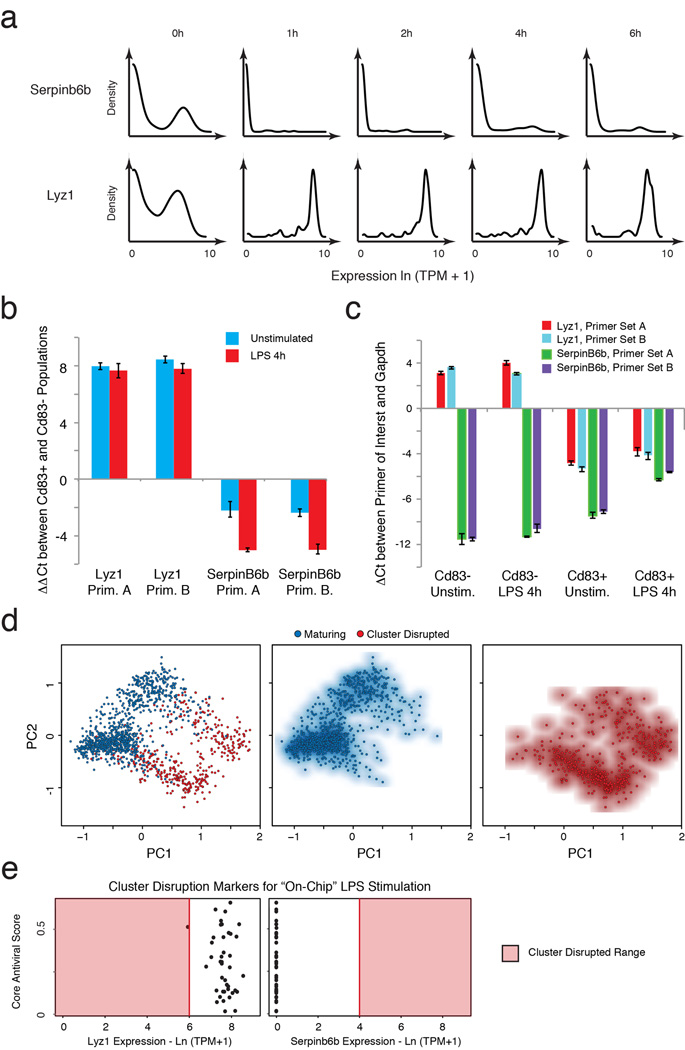
Aggregated in silico, single-cell expression measurements agreed with the matching population controls (R=0.87±0.05), with correlations plateauing once we had sampled ~30 cells (SI, Extended Fig. 1d–g). Technical and biological replicates were reproducible (technical: R>0.90, biological: R>0.87; Extended Fig. 3) and our results were robust to variation in several aspects of sample preparation (SI, Extended Figs. 1h–j). We removed 537 “cluster-disrupted” DCs16, a distinct subpopulation that matures as an artifact of isolation and culturing (SI, Extended Fig. 4), retaining 1,238 DCs for further analyses (Supplementary Tables 1–2).
Variability during immune responses
Principal components analysis (PCA) of gene expression profiles from all three time courses together showed that DCs spread along a continuum of expression variation in each principal component (PC) (Fig. 1c, Extended Figs. 1k–n). For example, while PC1 distinguished early from late time points for each stimulus, its scores also varied significantly between cells within any single stimulus and time point (Fig. 1c, Extended Figs. 1k–n), suggesting that some cells were “ahead” of others, especially early (1–2h).
Consistent with previous studies18, pathogen-responsive genes partitioned into co-regulated modules based on their population-level expression profiles (Fig. 1c, left, SI). Genes induced in cells stimulated with LPS or PIC (cluster I, Fig. 1c) were enriched for antiviral defense factors, including interferons and their targets (Bonferroni-corrected P<10−5), whereas genes induced in cells stimulated with LPS or PAM (cluster III, Fig. 1c) were enriched for inflammatory genes and NF-κB targets (Bonferroni-corrected P<10−6; Supplementary Table 3).
We used the single-cell gene expression profiles to partition these main clusters into finer modules (Fig. 1c, black lines, right, Supplementary Table 3, SI) and applied a resampling method20 (SI, Extended Fig. 5d) to identify four modules significantly associated with the three major PCs (Fig. 1c): Cluster Id (“core” antiviral module; enriched for annotated antiviral and interferon response genes; e.g., Ifit1, Irf7; Bonferroni-corrected P<10−8, Supplementary Table 3; Fig. 1c, Extended Fig. 5a) had high PC1 scores; Cluster IIIc (“peaked” inflammatory module; showing rapid, yet transient, induction under LPS; e.g., Tnf, Il1a, Cxcl2) and Cluster IIId (“sustained” inflammatory module; exhibiting continued rise in expression under LPS; e.g., Mmp14, Marco, Il6) had high PC2 scores; and Cluster IIIb (“maturity” module; containing markers of DC maturation; e.g., Cd83, Ccr7, and Ccl22, SI) had high PC3 scores.
Digital and analogue variability in gene expression between cells
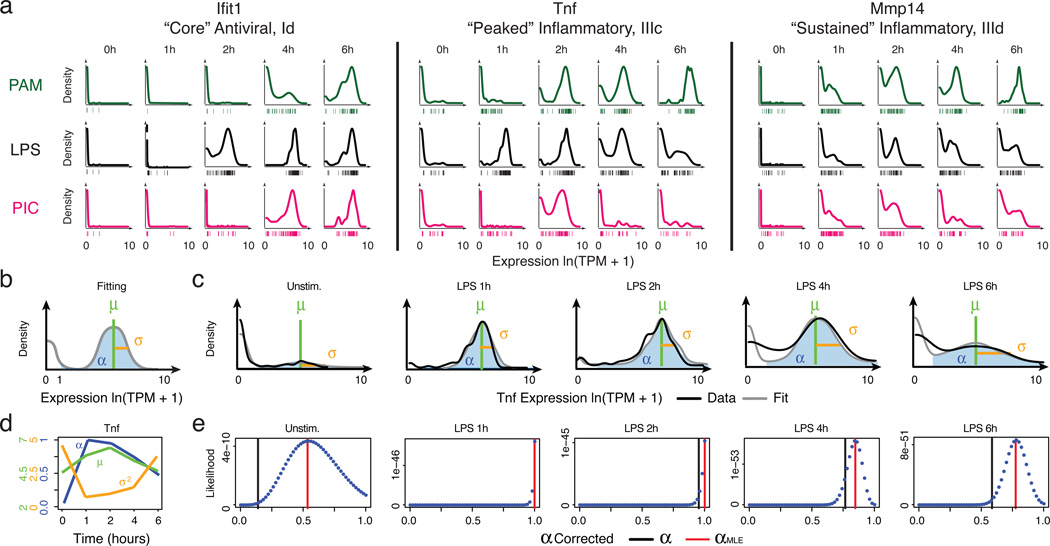
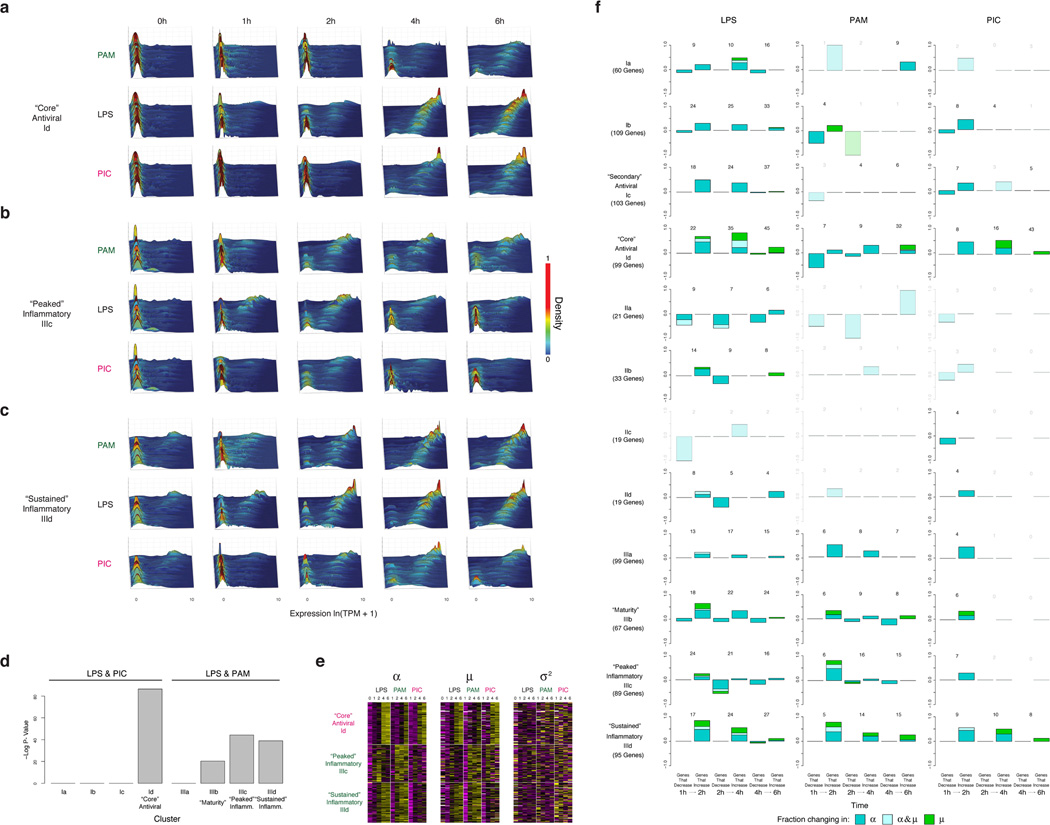
Genes from these four modules displayed distinct patterns of variation that changed with time and stimulus (Fig. 2a, Extended Figs. 5&6). For example, early after LPS stimulation, “core” antiviral response genes were detectably expressed only in some cells (i.e., bimodal) (Fig. 2a, Extended Figs. 5a&6), but turned on in most cells between 2 and 4h (i.e., became unimodal). In contrast, many “peaked” inflammatory genes were induced by LPS in all cells early, but were only detectable in some cells later (Fig. 2a, Extended Figs. 5b&6). Finally, “sustained” inflammatory genes were induced early in most cells and persisted at equal or elevated levels later (Fig. 2a, Extended Figs. 5c&6). Some variation patterns changed between stimuli (e.g., “peaked” inflammatory genes remained detectably expressed in most cells late (6h) in PAM), while others patterns were similar for distinct pathogens (e.g., the antiviral modules Ia-Id under LPS and PIC) (Fig. 1&2a, Extended Fig. 5a–c).
Figure 2. Time-dependent behaviours of single cells.
(a) Single-cell expression distributions for three genes at each time point after stimulation with PAM (top, green), LPS (middle, black), or PIC (bottom, magenta). Distributions are scaled to have the same maximum height. Individual cells are plotted as bars underneath each distribution. (b) Three parameters describing single-cell expression distributions: µ (green) and σ2 (gold), the mean and variance of RNA abundance in detectably expressing cells, respectively, and α (blue), the fraction cells with detectable expression (at ln(TPM+1)>1). (c) Examples of fit (grey) and measured Tnf expression distributions (black). (d) The values of µ, σ2, and α (Y axes, left to right) computed for Tnf at each time point (X axis). Units for µ and σ2 are ln(TPM+1). (e) Maximum likelihood estimate α(αMLE). Shown are the likelihood functions (dotted blue line) for Tnf (matching c) used to determine αMLE (red line; black bar: nominal α; SI).
As noted previously from single-cell quantitative real-time polymerase chain reaction (qRT-PCR) data21, we distinguished two types of heterogeneity: (1) digital variation, reflecting the percentage of cells detectably expressing a transcript; and (2) analogue variation, representing expression level variation among detectably expressing cells. Using the variance calculated over all cells as a metric of heterogeneity6,16 conflates these two types of variation. We therefore explicitly modeled our data using three parameters (Fig. 2b, Extended Fig. 7): the mean (µ) and variance (σ2) of a gene’s expression among detectably expressing cells, and the fraction of detectably expressing cells (α)21: in this scheme, σ2 and α signify analogue and digital variation, respectively.
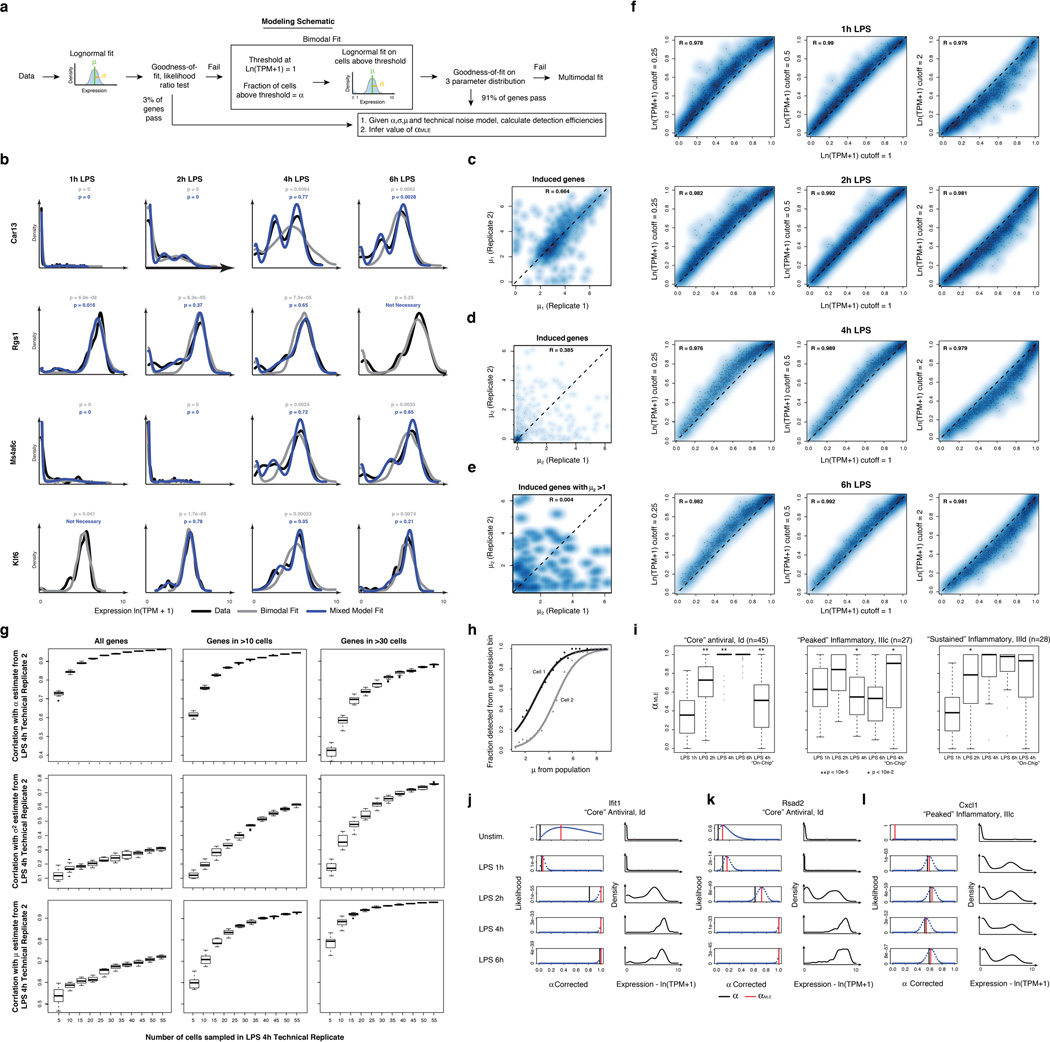
We computed α based on a fixed threshold for appreciable expression (ln(TPM+1)>1, SI, Extended Fig. 7a,f), and then estimated µ and σ2 across appreciably expressing cells. This three-parameter model effectively described most (91%) of our single-cell data (Fig. 2c,d, SI, Extended Fig. 7b). Our data did not support fitting with either a single lognormal or a mixture two, fully parameterized lognormals (for expressing and unexpressing cells; SI, Extended Fig. 7c–e). Computed α values were consistent between technical and biological replicates, but µ and σ2 estimates were reproducible only when genes are expressed in at least 10, or 30 cells, respectively (Supplementary Note, SI, Extended Figs. 2c–e,7g&8).
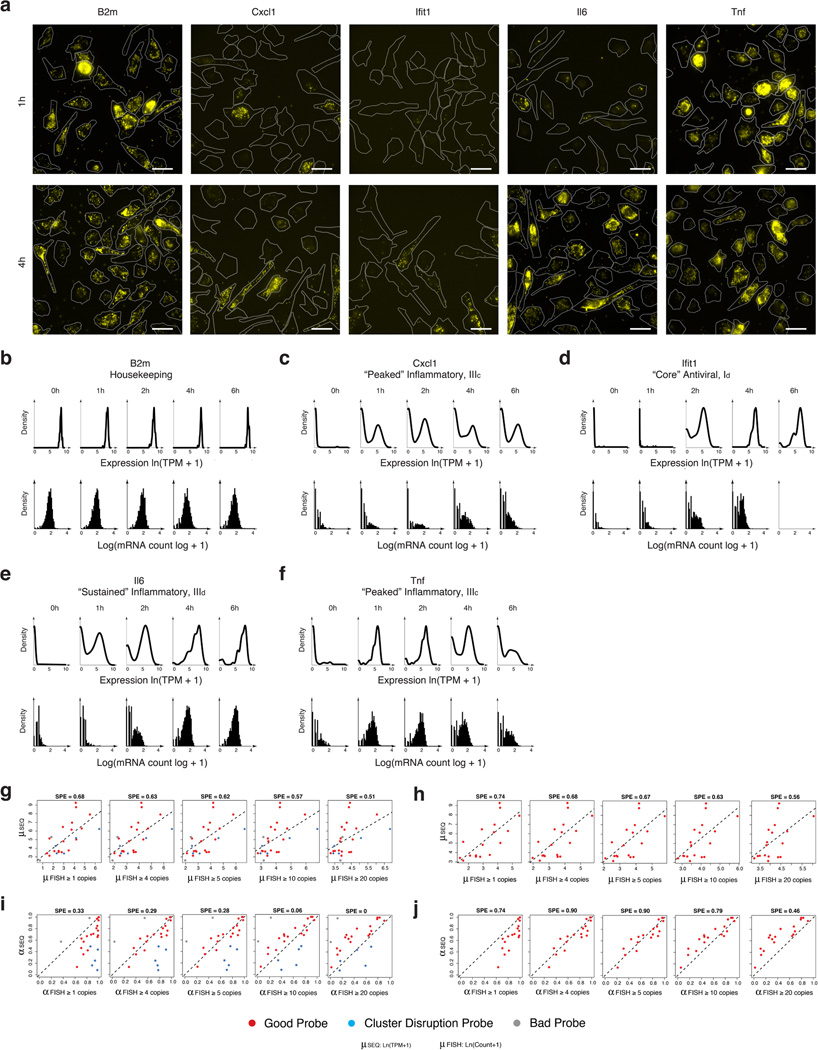
Our nominal α estimates are likely deflated due to the detection limits of single-cell RNA-Seq. Indeed, we observe higher α values when examining our existing RNA Fluorescence In-Situ Hybridization (RNA-FISH) data16 (Extended Fig. 6g–j). By comparing our single-cell RNA-Seq and RNA-FISH, we estimate that the transcript detection efficiency for our single-cell RNA-Seq is ~20%, consistent with previous reports14,22. We and others15,23 have also observed a strong relationship between a gene’s average expression and its probability of detection (Extended Fig. 7h). We thus employed a conservative null model, where this relationship results solely from technical limitations (SI, Extended Fig. 7h), and determined the maximum likelihood estimate of α (αMLE) for each gene after correcting for it (Fig. 2e, Extended Fig. 7j–l, SI). Based on this analysis, we estimate that ~45% of “core” antiviral genes and 30% of “peaked” inflammatory genes are significantly bimodal in the LPS response (Bonferroni-corrected p<0.01; SI, Extended Fig. 7i).
Quantitative chromatin levels correlate with digital variation
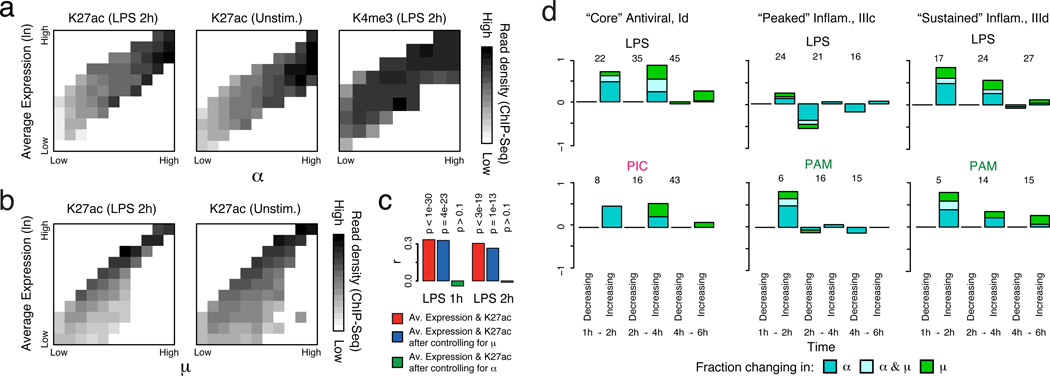
Since the presence of a chromatin marks is, by definition, discrete in a single cell, we reasoned that population ChIP-Seq profiles of active histone marks (e.g., histone 3 lysine 27 acetylation (H3K27ac)) should more closely reflect the fraction of cells with detectable transcripts (α) than population-level expression. Supporting this hypothesis, the observed α for a gene was strongly correlated (mean R for binned data=0.89; SI) to its promoter-associated ChIP-Seq density (collected under identical conditions24), even within a fixed population expression range (Fig. 3a top/middle, rows). In contrast, a gene’s population-level expression was not correlated (mean R for binned data=−0.02) to H3K27ac promoter levels within a fixed α range (Fig. 3a top, middle; columns). When controlling for µ instead of ±, highly significant correlations remained between H3K27ac and population-level expression (Fig. 3b). A partial correlation analysis limited to either all immune response genes or “bimodal” genes (likelihood ratio test (LRT), p>0.1 after controlling for α, Fig. 3c) yielded similar results. Digital variation did not correlate with histone 3 lysine 4 trimethylation (H3K4me3) levels (Fig. 3a, bottom), in line with previous observations24 that H3K4me3 is not as tightly correlated with active transcription. Emerging single-cell epigenomic technologies25 should help further explore this relationship.
Figure 3. Dynamic changes in variation during stimulation.
(a,b) The relationship between expression and H3K27ac binding depends on α (a), but not on µ (b). Plots show average promoter read density (black high; white low; scale bar, bottom) for H3K27ac in LPS 2h (a,b, left) and unstimulated cells (a, middle; b, right), or H3K4me3 in 2h LPS (a, right) in genes corresponding to each of 10 quantile bins of population expression (Y axis) and each of 10 quantile bins of α (a, X axis) or µ (b, X axis) (SI). (c) Bar plots showing p-values of correlation between average expression levels and K27ac only for immune response genes either as is (red) or when controlling for µ (blue) or α (green). (d) Dynamic changes in α and µ in each module. Bar plots showing for each module the fraction of genes (Y axis) with a significant change only in α (P < 0.01, likelihood ratio test, blue), only in µ (P < 0.01, Wilcoxon test, green), or in both (each test independently, light blue), at each transition (X axis), in different conditions (marked on top). The number of genes over which the proportion is calculated is marked on top of each bar (SI, Extended Fig. 5f).
Dynamic population-level responses involve shifts in both α and µ
An average (population) increase in the expression of bimodally expressed genes may represent changes in the amount of transcript made by expressing cells (shifts in µ), the proportion of expressing cells (shifts in α), or both. For each pair of consecutive time points, we examined the proportion of genes in each module with a significant change in: (1) µ (Wilcoxon rank-sum test); (2) α (LRT); or (3) both (SI). Given our limitations in estimating α and µ, we only considered genes that were annotated as bimodal in at least one time point in the relevant time course and expressed in at least 10 cells in both time points (SI). We excluded the unstimulated time point since most immune response genes were not yet expressed.
For LPS, we observed strong shifts in α (alone or with µ) at early time points for “core” antiviral and “sustained” inflammatory genes (Fig. 3d, top, Extended Fig. 5e,f), which transitioned to high and unimodal expression late in the response (Fig. 1&2). In contrast, α decreased at later time points for “peaked” inflammatory genes, especially from 2–4h (Fig. 3d, middle, Extended Fig. 5f). The temporal patterns in “core” antiviral activation were shared between LPS and PIC. However, unlike in LPS, “peaked” inflammatory expression did not diminish, and α did not decrease at later points under PAM (Fig. 3d). These coherent shifts suggest that variability reflects regulated immune response phenomena, rather than unconstrained stochastic transcription.
Intercellular determinants of Variation
Both differences in intracellular components1–4 and changes in the cellular microenvironment7,26 can affect heterogeneity. In particular, slow diffusion of cytokines and chemokines could lead to local variation in intercellular signals. Since the “core” antiviral module is enriched for targets of IFN-β, we hypothesized that upstream variability in IFN-β exposure may drive its heterogeneity (Extended Fig. 9), and thus profiled cells 2h after IFN-β stimulation. Supporting our hypothesis, compared to 2h of LPS where the “core” antiviral module is highly variable (median α=0.52; 30% of genes significantly “bimodal”, P<0.01, LRT, Extended Fig. 9b), cells stimulated with IFN-β for 2h exhibited sharply reduced digital variation in the “core” antiviral module (Fig. 4a, median α=0.82; 7% of genes significantly “bimodal”).
Figure 4. IFN-β feedback drives heterogeneity in the expression of “core” antiviral targets.
(a) Single-cell expression distributions for Rsad (top) and Stat2 (bottom) after stimulating with LPS (left, black) or IFN-β (right, magenta) for 2h. (b) The “core” antiviral score (Y axis; SI, Extended Fig. 9f&10a) for each LPS-stimulated cell at each time point (X axis) and cells simulated for 2h with IFN-β (rightmost). Two “precocious” cells (yellow stars) have unusually high antiviral scores at 1h LPS. (c) RNA-FISH confirms the presence of rare “precocious” responders (arrow; yellow star), positive for both Ifnb1 (magenta) and Ifit1 (cyan). Grey: cell outlines. Scale bar: 25 µm.
A few cells precociously express late-induced antiviral genes very early
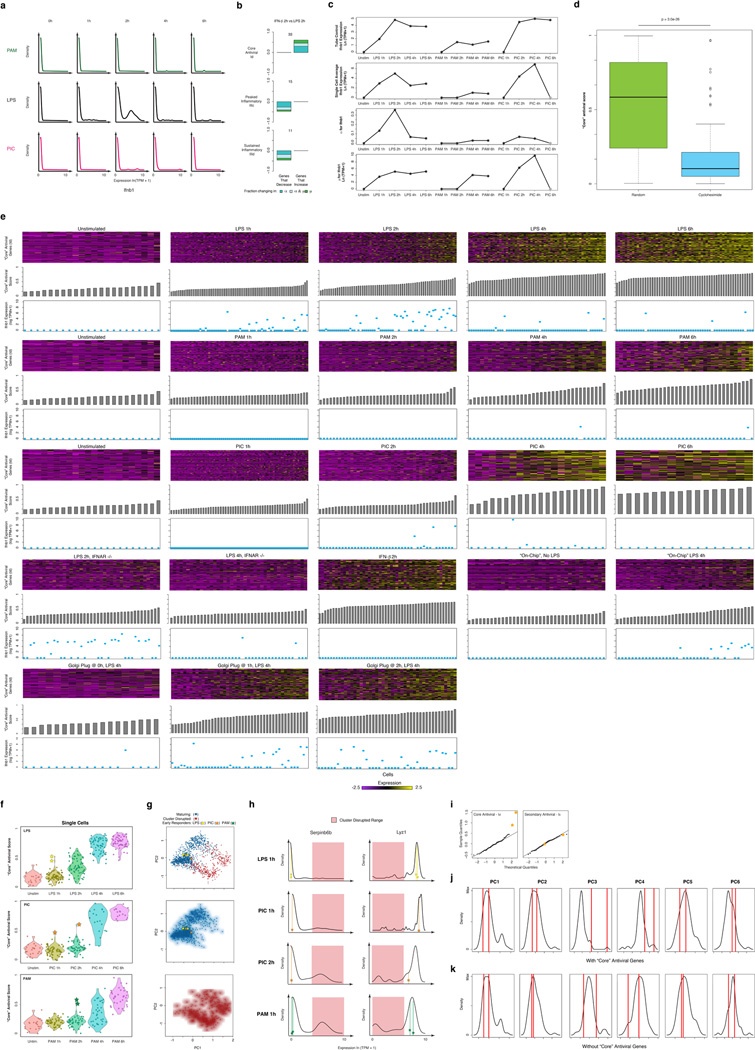
We next explored the cellular source of interferon in the native LPS response. At 2h following LPS, Ifnb1 was bimodally expressed (P<10−4, LRT) and correlated with the expression of the “core” antiviral module (Extended Fig. 9a,d,e). This observation, together with IFN-β stimulation’s suppression of digital variation, suggested that, in response to LPS, a few cells may first produce (Extended Fig. 9d) and secrete a wave of interferon, leading to a gradual coordination of the “core” antiviral module at later time points via paracrine signaling.
To test this hypothesis, we computed a “core” antiviral “activation score” (SI) for each cell and compared scores across the LPS time course (Fig. 4b, Extended Fig. 9e,f&10a, SI). Although most cells activated the module between 2h and 4h, we discovered two cells with strong “core” antiviral activation at 1h (Fig. 4b,c, Extended Fig. 9f,i, yellow stars). We verified the existence and scarcity of these “precocious” cells at 1h by RNA-FISH (Fig. 4c; SI). Appreciable Ifit1 and Ifnb1 coexpression was detected only in 0.8% of cells (23 of 2,960, mRNA count ≥ 5 copies, P=2×10⁻²⁸, proportion test). These “precocious” cells were indistinguishable from the others except in their expression of the ~100 “core” antiviral genes. We observed similar early responding cells following PIC and PAM stimuli (Extended Fig. 9f–h&10a).
While these “precocious” cells are reminiscent of the “sentinels” that have been reported in viral infections and stimulations of fibroblasts27,28 (Supplementary Note, SI), we note that, in those studies, only some cells sense and respond to the primary stimulus (e.g., due to lack of viral replication). In contrast, all DCs rapidly sense and respond to LPS, as evidenced by the unimodal activation of “peaked” inflammatory genes at early time points (Extended Figs. 5b–d,10a; Fig. 2a, Tnf).
Blocking intercellular communication dramatically alters cellular heterogeneity
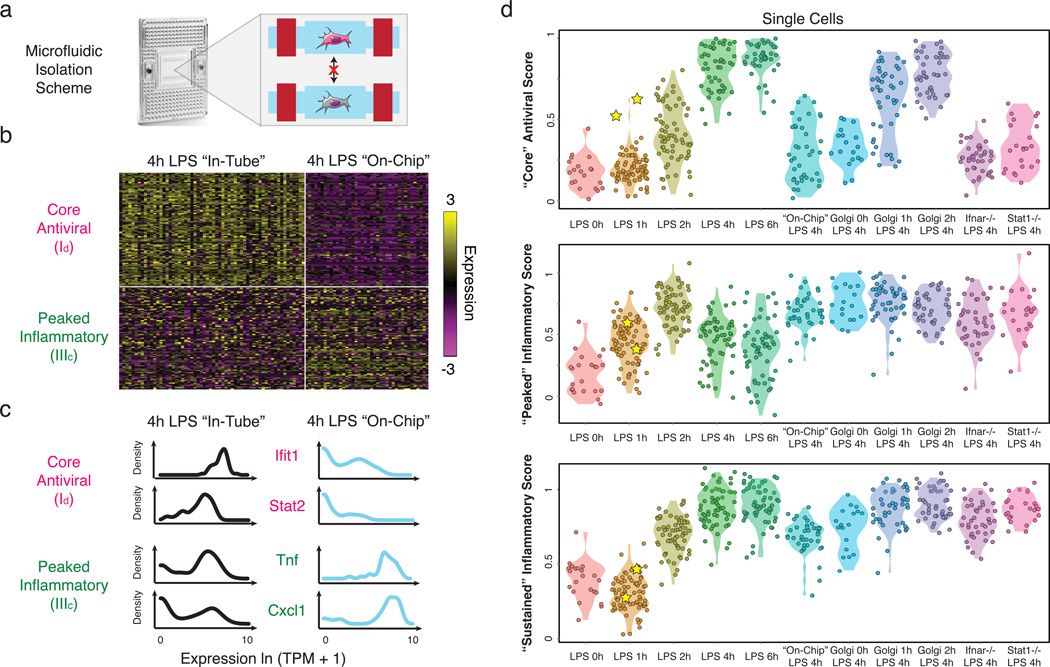
To examine whether the rare “precocious” cells are required for coordinating the “core” antiviral response, we developed an approach to stimulate cells in the absence of cell-to-cell communication. Modifying the standard C1 workflow, we captured individual unstimulated DCs in a C1 chip (SI), washed in LPS-containing media, and then immediately sealed each microfluidic chamber to isolate stimulated cells individually for 4h (“on-chip” stimulation, SI, Fig. 5a). Key experimental conditions, including cell density, were similar between the “in-tube” and “on-chip” experiments (SI).
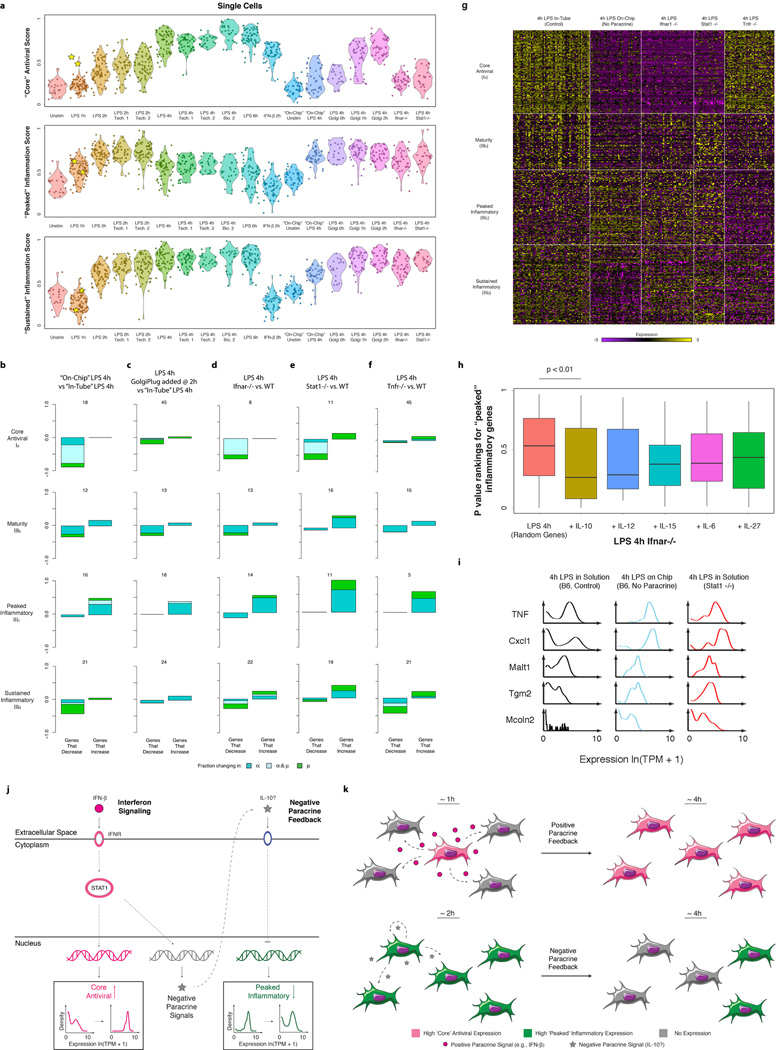
Figure 5. Microfluidic blocking of cell-to-cell signaling affects response heterogeneity in “core” antiviral and “peaked” inflammatory modules.
(a) Experimental blocking of cell-to-cell communication. Left: C1 chip; Right: On-chip stimulation, followed by actuation of microfluidic valves (red bars), seals the cells at individual chambers, preventing intercellular signaling. (b) Expression of the genes (rows) in the “core” antiviral (Id, top rows) and “peaked” inflammatory (IIIc, bottom rows) modules in single cells (columns) from the “in-tube” (left) and “on-chip” (right) stimulations. (c) Gene expression distributions for representative genes from the “core” antiviral (top) and “peaked” inflammatory (bottom) modules in the “in-tube” (left, black) or “on-chip” (right, blue) 4h LPS stimulation. (c) Violin plots of, top to bottom, “core” antiviral (SI, top), “peaked” inflammatory (middle), and “sustained” inflammatory (bottom) scores for individual cells from the stimulation conditions listed on the X axis. Yellow stars: the two “precocious” cells from Fig. 4 (Extended Fig. 10a).
Absent cell-to-cell communication, “core” antiviral module genes were bimodally expressed (Fig. 5) – only 8 cells (20%) weakly activated the “core” antiviral module at 4h (Fig. 5b–d, Extended Fig. 9e), likely mimicking the “precocious” cells observed “in-tube” at 1h. This observation suggests an upper bound for the number of cells capable of autonomously inducing a response by 4h. Removing cell-to-cell communication also down-regulated the expression of maturation markers in all cells and some of the “sustained” inflammatory genes (Extended Fig. 10a), though other key inflammatory genes were unaffected.
Surprisingly, blocking intercellular communication also sharply altered the single-cell expression of “peaked” inflammatory genes (Fig. 5b–d). Genes encoding key inflammatory cytokines (e.g., Tnf, Cxcl1) switched from bimodal (α=0.77, 0.56, respectively) to unimodal (α=1.0, 0.91; LRT for corresponding αMLE’s P<10−4, P<10−13, respectively) expression “on-chip” (Fig. 5b,c). Indeed, a large portion of the “peaked” inflammatory genes that were bimodal (LRT P<0.01) after 4h LPS “in-tube” shifted to unimodal expression “on-chip” (Extended Fig. 10a,b; P<0.01, hypergeometric test), indicating that cell-to-cell signaling is required for dampening the “peaked” inflammatory program at later time points following LPS. The opposite behaviors of the “core” antiviral and “peaked” inflammatory modules indicate that intercellular communication can have opposing effects on variation for different gene modules within the same cell.
Paracrine interferon signaling affects digital variation of “peaked” inflammatory genes
“On-chip” isolation conflates the effects of different paracrine signals and the loss of cell-to-cell contact. To distinguish these, we first profiled DCs from interferon receptor knockout mice (Ifnar1−/−). As expected, and consistent with previous findings16, antiviral gene expression was undetectable at 4h in all Ifnar1−/− DCs, implying that even the “precocious” cells require autocrine interferon feedback to activate and sustain their “core” antiviral responses (Extended Fig. 10g). This is further supported by the decoupling of the expression of Ifnb1 and the “core” antiviral module in Ifnar1−/− DCs stimulated with LPS for 2h (Extended Fig. 9e).
Removal of interferon signaling also strongly affected the “peaked” inflammatory module: at 4h LPS, Ifnar1−/− cells showed a similar increase in the fraction of activated cells as in the “on-chip” experiment (Fig. 5d, Extended Fig. 10a,d,g), suggesting that the absence of interferon signaling, rather than changes in cell-to-cell contact29, is the major driver. Furthermore, DCs lacking Stat1, a key mediator of interferon responses24, also exhibited increase activation and decreased digital variation in “peaked” inflammatory genes (P<0.01; hypergeometric test; Fig. 5d and Extended Fig. 10a,e,g,i). Conversely, the “sustained” inflammatory module was not appreciably affected by the absence of interferon signaling (Fig. 5d and Extended Fig. 10a,g), implying a different mechanism for its down-regulation “on-chip”.
Interferon acts early on the antiviral module and induces a second paracrine signal that down-regulates “peaked” inflammation
Interferon response targets can cross-inhibit inflammatory gene expression either through the direct formation of repressive complexes, e.g., the STAT1-inclusive ISGF-3, or by driving the production of anti-inflammatory cytokines30. The few cells with “on-chip” antiviral activation exhibited no change in “peaked” inflammatory gene expression (Fig. 5b). This suggests that the repression of “peaked” inflammatory genes, unlike antiviral activation, is not directly downstream of IFN-β signaling, but rather is mediated by a second IFN-β/STAT1-dependent paracrine signal. Peaked induction through two asynchronous paracrine signals is reminiscent of the activation and contraction of keratinocytes following wounding and immune infiltration, respectively31.
To test this hypothesis further, we added Brefeldin A (GolgiPlug), a secretion inhibitor, either simultaneously with LPS (“0h”) or at 1 or 2h after stimulation, and measured single-cell RNA-Seq profiles at 4h (Fig. 5d, Extended Fig. 10a–c). Inhibiting secretion at the time of LPS addition dramatically dampened the antiviral response, similar to the “on-chip” experiment. However, adding Brefeldin A at 2h did not affect the activation of the “core” antiviral module and adding it at 1h had only a modest impact. This indicates that the first hour represents the crucial paracrine window for this response. In contrast, for the “peaked” inflammatory module, addition at each of the three time points resulted in the module remaining aberrantly activated at 4h, as “on-chip”. Collectively, these experiments show that paracrine interferon signaling events prior to the 1h time point are crucial to antiviral activation, while subsequent, separate, signaling is responsible for inflammatory desynchronization (Supplementary Note, Discussion, SI).
DISCUSSION
Here, we have analyzed how variation between individual DCs changes with stimulus and time to dissect how heterogeneity is regulated across the immune response. Our statistical analysis reveals that changes in digital variation can encode a diversity of temporal response profiles (Fig. 3d, Extended Fig. 5f). For example, late-induced “core” antiviral genes are very weakly expressed, on average, early, but are highly expressed in a few “precocious” cells; the progressive dampening of “peaked” inflammatory genes originates from changes in the fraction of cells expressing these transcripts, rather than a uniform gradual decrease in the expression in all cells.
Such complex average responses can be generated not only through intricate intracellular circuits in each cell, but also through intercellular communication between cells, as we show for both modules. For example, we uncovered a small number of “precocious” cells that express Ifnb1 and “core” antiviral genes as early as 1h after LPS stimulation, and through the secretion of IFN-β, help activate “core” antiviral genes in other cells to coordinate the population response. These cells are indistinguishable from the rest, except in their expression of the “core” antiviral module (Extended Fig. 9j,k), and yet are crucial for an efficient and timely population response (Supplementary Note, SI).
IFN-β signaling also dampens a subset of induced inflammatory genes at later time points, and our Brefeldin A experiments suggest that a secondary, IFN-β dependent signal, is involved (Extended Fig. 10j,k). This is consistent with a model where IFN-β secreted by a few cells induces the expression and secretion of secondary anti-inflammatory cytokines from a subset of cells, which, in turn, attenuate the inflammatory responses of their neighbors. Computational analyses, genetic perturbations and recombinant cytokine experiments suggest that IL-10 may be involved in this second wave of negative signaling (Extended Fig. 10h, Supplementary Table 4), but further experiments are needed to fully elucidate the mechanism (Supplementary Note, SI). One involved component may be the RNA degradation factor ZFP36 (TTP), whose targets are enriched in the “peaked” inflammatory module32.
The ability of “precocious” cells to influence others via paracrine signaling may be an efficient strategy for “quorum sensing”33, but also may be perilous. If the activation threshold is too low, a few stochastically responding cells could induce an inappropriate immune response. Indeed, this is observed in autoimmune diseases like systemic lupus erythematosus (SLE), where excess IFN-β production potentiates auto-reactive DC activation34,35. Meanwhile, overly restrictive thresholds may limit rapid responses to a viral infection, or the dampening of chronic inflammation (e.g., in rheumatoid arthritis or ulcerative colitis30,35). Thus, individual cells likely place tight controls on the regulation of key cytokines, preferring different induction strategies under different stimuli to maximize the balance between responsiveness and control. Indeed, similar population-level Ifnb1 expression in LPS/PIC (Extended Fig. 9c) stems from different underlying phenomena: a substantial fraction of cells express Ifnb1 transcript moderately at 2h LPS (α=0.35, µ=5.1), while just a few cells express Ifnb1 very highly at 2h PIC (α=0.07, µ=6.31; uncorrelated with the cell’s activation of the antiviral response26,27: Extended Fig. 9e).
Using microfluidics, we achieved the statistical power needed to track transcriptome-wide changes in single-cell variation across a variety of conditions, as well as to identify novel rare responses. Microfluidics also allowed us to finely control the stimulation of our cells. Similar and improved techniques will be essential for characterizing other rare sub-populations, such as cancer stem cells, and for studying heterogeneous clinical samples and tissues. Further innovation in massively parallel manipulation and profiling of single cells will continue to improve our understanding of the rich diversity in, and dynamic functional communities that constitute, multicellular populations.
METHODS SUMMARY
Bone marrow derived mouse DCs were prepared as previously described18 and stimulated with pathogenic stimuli for specified time periods. The C1 Single-Cell Auto Prep System (Fluidigm) was used to perform SMARTer (Clontech) whole transcriptome amplification (WTA)15,16,19 on up to 96 individual cells. WTA products were then converted to Illumina sequencing libraries using Nextera XT (Illumina)15. RNA-Seq libraries were also made from 10,000 cells from each parent population (population control). Each sample was sequenced on an Illumina HiSeq 2000 or 2500, and expression estimates (transcripts per million; TPM) for all UCSC-annotated mouse genes were calculated using RSEM36. Data was further analyzed as described in the SI. Additional experiments were performed using RNA-FISH (Panomics), “on-chip” isolated stimulation, knockout mice, secretion blockers (GolgiPlug, BD Biosciences), protein synthesis blockers (Cycloheximide, Sigma), and recombinant cytokines. Full Methods and any associated references are provided in SI. Data are deposited in GEO under accession number GSE48968.
Extended Data
Extended Figure 1. Single-cell RNA-Seq of hundreds of DCs.
(a) Overview of experimental workflow. (b) Shown are read densities for seven representative genes (two housekeeping genes: Rpl3 and Actb and five immune response genes: Ifnb1, Ifit1, Ccr7, Tnf, Marco) across 60 single cells (blue) and one population control of 10,000 cells (grey) in 4h LPS. (c) Distribution of failure scores for all single cells. Single cells with failure scores above 0.4 were discarded (see SI). (d–g) Comparing expression estimates for the “average” single cell and the bulk population. (d) Scatter plots showing for each gene the relation between the average single-cell expression (Y axis) and bulk population level expression (X axis) for each of four time points following LPS stimulation (1, 2, 4, and 6h, left to right). (e) The Pearson correlation coefficients (Y axis) of each comparison, as in d, for each of the time points and stimuli presented in Fig. 1, as a function of the number of cells captured in the respective experiment (X axis). (f) Scatter plots showing the residual (population-level expression minus the single cell average) in an LPS 1h experiment (X axis) vs. the residual in each of 3 other experiments (Y axis, left to right): LPS 6h, PIC 4h and PAM 2h. (g) The Pearson correlation coefficient (Y axis) between the bulk population level expression and the single-cell expression average when a different number of sub-sampled cells (X axis) is included in the single-cell average. (h,i) Effects of Hoechst dye and periodic mixing on mRNA expression. (h) Comparable expression levels after 4h LPS with the addition of small amounts of Hoechst to aid in cell counting (X axis) and when no dye is used (Y axis), when looking at all genes (left) or only immune response genes (right). (i) Comparable expression levels after 4h LPS with hourly mixing (X axis) or with no mixing (Y axis), when looking at all genes (left) or only immune response elements (right). (j) “Core” antiviral, “peaked” inflammatory, and “sustained” inflammatory module activation scores for a 0.1× LPS stimulation. Shown are Violin plots of the scores (Y axis) for the “core” antiviral (SI, top), “peaked” inflammatory (SI, middle), and “sustained” inflammatory modules (SI, bottom) for each cell in (left to right): LPS 0h, 1× (100 ng/mL) LPS 4h, and 0.1× (10 ng/mL) LPS 4h. (k–n) PCA of stimulated DCs. (k) PCA for the first two PCs for samples from the LPS stimulation time course. From top to bottom: unstimulated/LPS 0h, LPS 1h, LPS 2h, LPS 4h, LPS 6h. (l–n) PCAs (left) and the distributions of scores (right) for each of the first three PCs for samples collected after stimulation with LPS (l), PAM (m), or PIC (n), for 1 (yellow), 2 (blue), 4 (grey) and 6 (red) hours. A single PCA was performed for all cells in all three time courses.
Extended Figure 2. Effects of shallow read depth on expression estimates.
(a–b) A million reads per cell are sufficient to estimate expression levels. (a) Scatter plot for a single cell (from Shalek et al., Nature, 201316) showing the relation between expression estimates calculated using 30M reads (X axis) or a sub-sample of 1M reads (Y axis). (b) Scatter plots for six different DCs stimulated for 4h with LPS. Each plot shows the relation between expression estimates calculated using all reads (X axis; number of reads marked on axis label) or a sub-sample of 1M reads (Y axis). In all cases, R > 0.99. Note that although, in principle, no gene should be estimated as present only in a subsample but not the full dataset, this does occur for a very small number of genes (e.g., four genes in Cell 3), representing a nuanced technical error in RNA-Seq estimation. Consider two expressed genes, A and B, from distinct loci, but with a short stretch of sequence identity. At low sequencing depth, if reads only map to the shared region, estimation tools such as RSEM36 used here can guess erroneously which gene is expressed, such that additional sequencing depth can “flip” the assignment of an uncertain read from gene A to gene B. These cases are extremely rare, and have a negligible effect. (c–e) A million reads per cell are sufficient to estimate µ, σ2, and α. Scatter plots showing the relation between α (c), µ (d), and σ2 (e) values estimated using 10M reads/cell (on average;×axis) or a sub-sample of 1M reads/cell (y axis) from RNA-Seq libraries prepared from individual DCs stimulated for 4h with LPS. (c) For the vast majority of genes, 1M reads are sufficient to estimate α. For a very small fraction (<0.1%) of weakly expressed genes, estimates of α are improved with increased sequencing depth. For ¼ (d) and σ2 (e), estimates are plotted for all genes (left), only genes detected in more than 10 cells (middle), or only those genes detected in more than 30 cells (right).
Extended Figure 3. Technical and biological reproducibility.
(a–d) Scatter plots showing the relation between the average single-cell expression estimates in either two technical replicates (LPS 2h (a), LPS 4h (b)) or two biological replicates (Unstimulated/LPS 0h (c), LPS 4h (d)) for all genes (top), immune response genes (middle), or non-immune response genes (bottom). (e–f) QQ plots (top) and MA plots (bottom) showing the similarity in expression estimates for the two LPS 2h technical replicates (e) or the two LPS 4h technical replicates (f). Plots are provided across all genes (left), non-immune response genes (middle), or immune response genes (right). (g–h) QQ plots (top) and MA plots (bottom) showing the similarity in expression estimates for all cells (including cluster-disrupted cells) in the two LPS 0h/unstimulated biological replicates (g) or the two LPS 4h biological replicates (h) across either all genes (left), non-immune response genes (middle), or immune response genes (right). Note, that slight variations in the fraction of cluster-disrupted cells and activation state of one of the two 0h samples results in mild deviations between immune response gene estimates in those biological replicates. (i–j) PCA for the two LPS 4h technical replicates. (i) The first two principal components (PC1 and PC2, X and Y axis, respectively) from a PCA from the two LPS 4h stimulation technical replicates (blue: replicate 1; red: replicate 2). (j) The distributions of scores for cells from each of the two technical replicates on each of the first five PCs (left to right: PC1 to PC5).
Extended Figure 4. Cluster disruption.
(a) Single-cell expression distributions for Serpinb6b (a positive marker of cluster disruption) and Lyz1 (a negative marker of cluster disruption) at each time point (marked on top) after stimulation with LPS (all cells included, see SI). Distributions are scaled to have the same maximum height. (b) Difference in mRNA expression as measured by qRT-PCR (with a Gapdh control) between Lyz1 or SerpinB6b in cells pre-sorted before stimulation to express or not express CD83 (CD83+ and CD83−, respectively), a known cell surface marker of cluster-disrupted cells (see SI). Pre-sorted cells were then either unstimulated (blue) or stimulated (red) with LPS for 4h. (c) Expression of cluster-disruption markers does not change with stimulation. qRT-PCR showing the difference between Gapdh (control) and Lyz1 or SerpinB6b expression in cells pre-sorted on Cd83 either in the presence or absence of simulation with LPS. (d) PCA showing the separation between “maturing” (blue dots) and “cluster-disrupted” (red dots) cells. (e) Expression of cluster disruption markers of cells stimulated with LPS “on chip”. For each cell (black dot) stimulated with LPS “on chip”, shown are the expression levels (X axis) of Serpin6b (cluster disruption cell marker, left) and Lyz1 (normal maturing cell marker, right) vs. its antiviral score (Y axis). With one exception, the cells are clearly “maturing” and not “cluster-disrupted”. Red shading: range of expression in cluster disrupted cells.
Extended Figure 5. Time-dependent behaviors of single cells from different modules and stimuli.
(a–c) For each of three key modules – “core” antiviral, Id (a), “peaked” inflammatory, IIIc (b), and “sustained” inflammatory, IIId (c) – shown are wave plots of all of its constituent genes in DCs stimulated with PAM (top), LPS (middle), or PIC (bottom) for 0,1,2,4 and 6h (left to right). X axis: expression level, ln(TPM+1); Y axis: genes; Z axis: single-cell expression density (proportion of cells expressing at that level). Genes are ordered from lowest to highest average expression value at the 4h LPS time point. (d) Contributions of each module to measured variation. Significance of the contribution of modules Ia-Id and IIIa-IIId from Fig. 1 to the variation measured throughout the stimulation time course. Shown is the p-value (Mann-Whitney test) of the tested association between each gene module and the first three PCs, calculated using a statistical resampling method (see SI). Only the “core” antiviral, maturity, and “peaked”/”sustained” inflammatory clusters show statistically significant enrichments with the three PCs. (e) Gene modules show coherent shifts in single-cell expression. Shown are heat maps of scaled α (left), µ (middle), and σ2 (right) values (color bar, bottom) in each time course (LPS, PAM, PIC) for the genes in each of the three key modules (rows, modules marked on left). Heat maps are row-normalized across all three stimuli, with separate scalings for each of the three parameters, to highlight temporal dynamics. Genes are clustered as in Fig. 1. (f) Dynamic changes in variation during stimulation in each module. For each module (rows) and stimulus (columns), shown are bar plots of the fraction of genes (Y axis) with a significant change only in α (by a likelihood ratio test, P<0.01, blue), only in µ (Wilcoxon test, P<0.01, green), or in both (each test independently, light blue), at each transition (X axis), in different conditions (marked on top) separated by whether they increase or decrease during that transition. In each module and condition, the proportion is calculated out of the genes in the module that are significantly bimodal (by a likelihood ratio test) in at least timepoint during the LPS response and are expressed in at least 10 cells in both conditions. Their number is marked on top of each bar; conditions with 3 or fewer genes changing are semi-transparent.
Extended Figure 6. Comparison of single-cell RNA-Seq to RNA-FISH.
(a–f) Single cell mRNA expression distributions by RNA FISH and single cell RNA-Seq. (a) Representative images of genes analyzed by RNA-FISH at 1 and 4h after LPS stimulation. (b–f) mRNA expression distributions for the housekeeping gene B2m (b), the “peaked” inflammatory gene Cxcl1 (c), the “core” antiviral gene Ifit1 (d), the “sustained” inflammatory gene Il6 (e), and the “peaked” inflammatory gene Tnf (f) measured using either single-cell RNA-Seq (top, black curves) or RNA-FISH (black histograms; no smoothing) in either unstimulated cells (LPS 0h) or cells stimulated with LPS for 1, 2, 4 or 6h. (g–j) Determining the detection limit of single-cell RNA-Seq by comparison to RNA-FISH. For each of 25 genes, we compared single-cell RNA-Seq data (Y axis, this study) to RNA-FISH data (X axis, from Shalek et al., Nature, 2013) based on either their µ values (g,h) or α values (i,j), where for RNA-FISH, “expressing” cells were defined for µ or α calculation at different thresholds (from left to right: at least 1, 4, 5, 10 or 20 copies per cell). (g,i) Data from all 25 genes. (h,j) Data after excluding probes from 5 “cluster-disrupted” gene markers (blue; Ccl22, Ccr7, Irf8, Serpinb6b, Stat4), which are less comparable since there are more cluster-disrupted cells in RNA-FISH experiments, and 2 low quality probes (grey; Pkm2, Fus) that showed very low expression in RNA FISH, but had high expression in both single cell and population-level RNA-seq experiments. SPE (square-root of percent explained, top) represents the square-root of the total variance in the RNA Seq parameter explained by the RNA FISH parameter, under the y=x model.
Extended Figure 7. Fitting gene expression distributions.
(a) Flow chart of model fitting. Shown are the key steps in fitting the 3-parameter model. (b) Examples of cases where fitting a multimodal distribution is required. Single-cell expression distributions for (top to bottom) Car13, Rgs1, Ms4a6c, and Klf6 at (left to right) 1, 2, 4, and 6h (marked on top) after stimulation with LPS. Distributions are scaled to have the same maximum height. Data: black lines; Bimodal fits: grey lines; Multimodal fits: blue lines. P values (color-coded) calculated using a goodness-of-fit test (a low P value rejects the fit; see SI). (c–e) Reproducibility of gene-specific fitting of the “undetected” mode, when fitting a mix of two normal distributions to all data points, including those with ln(TPM+1) < 1. (c,d) Scatter plot showing the correlation between µ1 and µ2 estimates for the two LPS 4h technical replicates (SI), where µ1 and µ2 are the two component means (in decreasing order of magnitude) of the two mixed normal distributions. Estimates for µ2 correlate poorly between technical replicates, particularly when focusing on genes for which µ2 is greater than 1 (e), suggesting that the current dataset does not support the use of this additional fit parameter. (f) Robustness of α estimates to small deviations in the threshold. Scatter plots showing the correlation between α estimates determined when using a cutoff of ln(TPM+1) = 1 (X axis) vs. when using a cutoff of ln(TPM+1) = 0.25 (Y axis, left); 0.5 (Y axis, middle) or 2 (Y axis, right) for the LPS time course (top to bottom: 1h, 2h, 4h, and 6h). (g) Saturation curves for estimates of µ, σ2, and α. Box plots depicting the Pearson correlation coefficient between α (top), µ (middle), or σ2 (bottom) in two LPS 4h technical replicates, as a function of the number of cells randomly drawn from each replicate (full details in SI). Plots are shown for all genes (left), as well as those detected in more than 10 (middle) or 30 cells, (right) in both replicates (full datasets). (h,i) Correcting for the relationship between mean expression and average detection. (h) The probability of detecting a transcript (Y axis) in a cell as a function of µ (X axis). Black, grey curves are two illustrative cells from the LPS 4h time point. (i) Differences in αMLE, a stringently-corrected MLE estimate of α (SI), across the LPS time course. Shown are the box plots of αMLE values (Y axis) for bimodally expressed genes (determined by a likelihood ratio test, SI) at each time point (1, 2, 4, and 6h) following LPS stimulation (X axis), as well as for the “On-chip” 4h LPS stimulation, for each of the “core” antiviral (left), “peaked” inflammatory (middle) and “sustained” inflammatory (right) modules. Stars represent intervals where there is a significant difference in a parameter between two consecutive time points, as determined by a Wilcoxon rank sum test (single star: P<10−2; double star: P<10−5). (j–l) Estimating an upper bound on α using a likelihood test. For each of three transcripts (Ifit1 (j); Rsad2 (k); and Cxcl1 (l)) shown are their expression distributions (red, left) and the matching likelihood function for a stringent upper estimate of α (blue dots, right), when considering a null model where expression is distributed in a lognormal fashion and any deviations are due to technical detection limits (SI). Red vertical line: αMLE; black vertical line: nominal α. Vertical green bars signify the “nominal” estimation of α, representing the fraction of cells with detected expression of a transcript.
Extended Figure 8. Reproducibility of estimates µ, σ2, and α parameters.
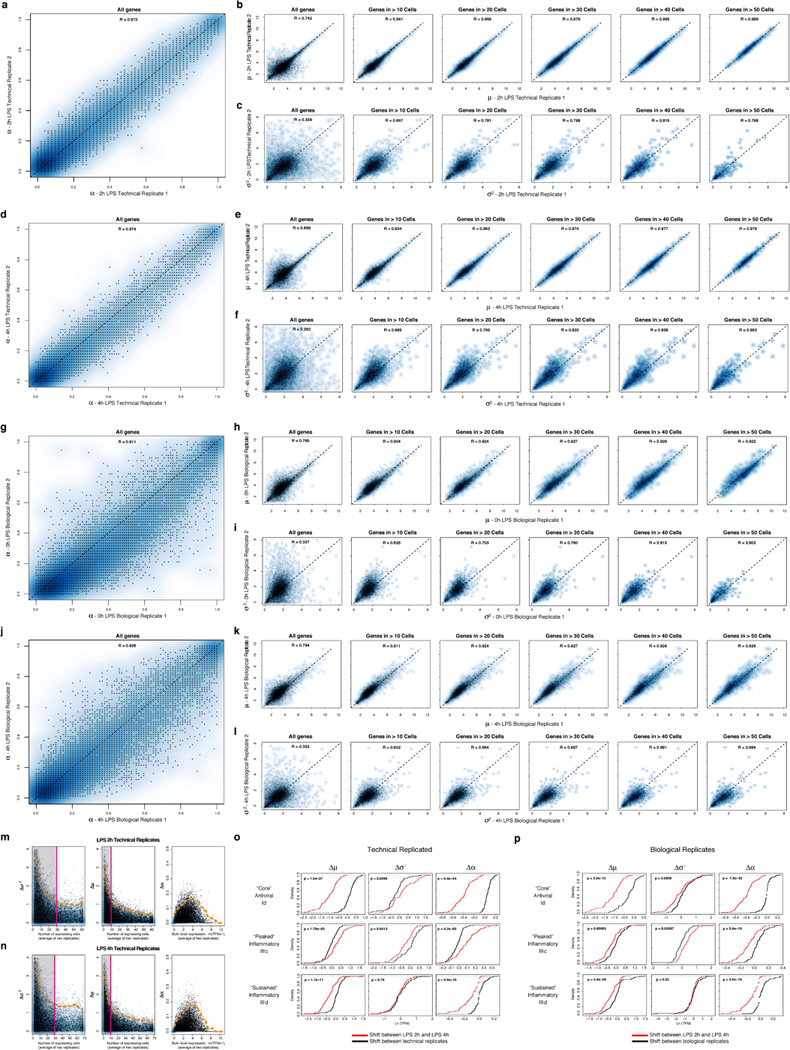
(a–f) Reproducibility of estimated µ, σ2, and α parameters between technical replicates. Scatter plots showing the relation between the estimated α (a), µ (b), and σ2 (c) values for the two unstimulated/LPS 0h technical replicates. For µ (b) and σ2 (c), estimates are plotted for all genes (leftmost), as well as (left to right) for genes only detected in more than 10, 20, 30, 40, or 50 cells, respectively. (d) – (f) show the same plots for the two LPS 4h technical replicates. (g–h) Reproducibility of estimated µ, σ2, and α parameters between biological replicates. Scatter plots showing the relation between the α (g), µ (h), and σ2 (i) values estimates for the two LPS 2h biological replicates. For µ (h) and σ2 (i), estimates are plotted for all genes (leftmost), as well as (left to right) for genes only detected in more than 10, 20, 30, 40, or 50 cells, respectively. (j) – (l) show the same plots for the two LPS 4h biological replicates. (m,n) Relation between per-gene errors for µ, σ2, and α and the number of cells in which the gene’s expression is detected, or its bulk expression level. Scatter plots displaying the differences in the σ2 (left), µ (middle), and α (right) estimates for each gene between technical replicates for LPS 2h (m) or LPS 4h (n) (Y axis) as a function of either the number of cells in which the transcript is detected (X axis, for µ and σ2), or the transcript’s bulk expression level (TPM, X axis, for α). Notably, Ã2 (left) estimates saturate (denoted by a magenta line and shaded box) after ~ 30 detectable events, while µ estimates saturate after ~ 10. Dashed orange line: 95% confidence interval. (o,p) Changes in µ, σ2, and α between time points are significant as compared to null models from both technical and biological replicates. Shown are the cumulative distribution functions (CDF) for shifts in µ (left), σ2 (middle), and α (right) between 2h and 4h (red CDF) for the “core” antiviral (top), “peaked” inflammatory (middle), and “sustained” inflammatory (bottom) modules compared to a null model (black CDF) derived from either technical (o) or biological (p) replicates (SI). In the vast majority of cases, the changes between time points are significant, as assessed by a Kolmogorov-Smirnof (KS) test (P-value of test in the upper left corner of each plot).
Extended Figure 9. Ifnb1 expression, production, and precocious cells.
(a–b) Ifnb1 mRNA expression and the effect of IFN-β on variation. (a) Single-cell expression distributions for the Ifnb1 transcript at each time point (top) after stimulation with PAM (top, green), LPS (middle, black), and PIC (bottom, magenta). Distributions are produced with the density function in R with default parameters, and scaled to have the same maximum density. (b) For each of three modules defined in Fig. 1 (core antiviral, top; peaked inflammatory, middle; sustained inflammatory, bottom), shown are bar plots of the fraction of genes (Y axis) with a significant change only in α (by a likelihood ratio test, P < 0.01, blue), only in µ (Wilcoxon test, P < 0.01, green), or in both (each test independently, light blue) between the 2h LPS stimulation and the 2h IFN-β stimulation separated by whether they increase or decrease during that transition. In each module and condition, the proportion is calculated out of the genes in the module that are significantly bimodal (by a likelihood ratio test) in at least time point during the LPS response and are expressed in at least 10 cells in both conditions. Their number is marked on top of each bar. (c–d) Ifnb1 mRNA expression patterns and effect of Cycloheximide. (c) From top to bottom, population average Ifnb1 mRNA expression (top), single-cell average Ifnb1 mRNA expression (second to top), α (second to bottom) and µ (bottom) estimates for Ifnb1 for each stimulation condition in Fig. 1. Grey star at 6h for PIC denotes uncertainty due to the small number of cells captured at that time point. (d) Shown are box plots of the “core” antiviral scores (population level, see SI) after a 4h LPS stimulation either where Cycloheximide was added at the time of stimulation (right, blue), or during a standard 4h LPS control (left, green). “Core” antiviral expression is dramatically decreased with addition of Cycloheximide, suggesting that newly produced protein is needed to initiate the antiviral response. (e) Relationship between “core” antiviral gene expression and Ifnb1 mRNA expression during the LPS, PAM, and PIC stimulation time courses and in follow-up experiments. Shown are the expression of “core” antiviral genes (heat maps: rows – gene; columns – cells) for cells stimulated for 0, 1, 2, 4, or 6 hours (left to right) with LPS (top), PAM (middle), or PIC (bottom). Beneath each heat map, grey bars depict the “core” antiviral score (middle panel, see SI) and blue dots show Ifnb1 mRNA expression for each cell in every heat map. (f–k) Identifying the “precocious” cells. (f) “Core” antiviral scores for cells stimulated with LPS, PIC, and PAM. Shown are violin plots of the core antiviral module scores (SI, Y axis) for each cell from time course experiments (from left: 0,1,2,4, and 6h) of DCs stimulated with LPS (top), PIC (middle) or PAM (bottom). Two “precocious” cells (yellow stars, top panel) have unusually high antiviral scores at 1h LPS (yellow stars, top); similarly “precocious” cells can be seen in PIC at 1 and 2h (orange stars, middle) or in PAM at 2h (turquoise stars, bottom). (g) “Precocious” cells in all three responses are typically maturing cells. PCA showing the separation between “maturing” (blue dots) and “cluster-disrupted” (red dots) cells (top), as well as only maturing (middle) or only cluster-disrupted (bottom) cells (all as also shown in Extended Fig. 4d). The “precocious” cells from each of the responses are marked as stars (colors as in (f)), and all fall well within the “maturing” cells. (h) “Precocious” cells in all three responses express Lyz1 and do not express Serpin6b. Shown are mRNA expression distributions for Serpin6b (cluster disruption cell marker, left) and Lyz1 (normal maturing cell marker, right) in LPS 1h, PIC 1 and 2h, and PAM 1h (top to bottom). The typical range for expression in cluster-disrupted cells is shaded in red. The “precocious” cells from each of the responses are marked as stars (colors as in (f)), and all fall well within the “maturing” cells. (i) Normal quantile plots of the expression of genes from the “core” (cluster Id, left) and secondary (cluster Ic, right) antiviral clusters at 1h LPS. The two “precocious” cells (yellow stars) express unusually high levels of “core” antiviral genes (left) but not of secondary genes (right). (j,k) The “precocious” cells are only distinguished by the expression of ~100 core antiviral genes. Shown are the distributions of scores for each of the first five PCs (right) for samples collected after stimulation with LPS for 1 hours with (j) or without (k) the inclusion of “core” antiviral genes. “Precocious” cells (vertical red bars), normally distinguished by the 3rd and 4th principle components (j), become indistinguishable from all other cells if the ~ 100 “core” antiviral genes are excluded (k) prior to performing the PCA.
Extended Figure 10. Characterizing the “precocious” cells.
(a) “Core” antiviral, “peaked” inflammatory, and “sustained” inflammatory module scores during the LPS time course and follow-up experiments. Shown are violin plots of the scores (Y axis) for the “core” antiviral (SI, top), “peaked” inflammatory (SI, middle), and “sustained” inflammatory (SI, bottom) modules for cells in each of the experiments (from left to right): LPS 0h, LPS 1h, LPS 2h, LPS 2h technical replicate 1, LPS 2h technical replicate 2, LPS 4h, LPS 4h technical replicate 1, LPS 4h technical replicate 2, LPS 4h biological replicate, LPS 6h, IFN-β 2h, “On-Chip” unstimulated, “On-Chip” LPS 4h, LPS 4h with GolgiPlug at 0h, LPS 4h with GolgiPlug at 1h, LPS 4h with GolgiPlug at 2h, LPS 4h with Ifnar−/− DCs, and LPS 4h with Stat1−/− DCs. Yellow stars: the two “precocious” cells at 1h LPS. (b) Changes in expression and variation during stimulation in the “on-chip”. For genes in the (from top to bottom) “core” antiviral, “maturity”, “peaked” inflammatory, and “sustained” inflammatory modules, shown are bar plots of the fraction of genes (Y axis) with a significant change only in α (by a likelihood ratio test, P<0.01, blue), only in µ (Wilcoxon test, P<0.01, green), or in both (each test independently, light blue) between either the 4h “on-chip” LPS stimulation and the 4h “in-tube” LPS stimulation separated by whether they increase or decrease during that transition. In each module and condition, the proportion is calculated out of the genes in the module that are significantly bimodal (by a likelihood ratio test) in at least timepoint during the LPS response and are expressed in at least 10 cells in both conditions. Their number is marked on top of each bar. (c–f) Bar plots, as in b, for a 4h wild-type LPS stimulation (in tube) and either a 4h “in-tube” LPS stimulation where GolgiPlug was added 2h after LPS (c), a 4h LPS stimulation of Ifnar−/− DCs (d), a 4h LPS stimulation of STAT1−/− DCs (e), or a 4h LPS Stimulation of TNFR−/− DCs (f). (g) Genetic perturbations alter expression and variation in different inflammatory and antiviral modules. Shown is the expression of the genes (rows) in – from top to bottom – the “core” antiviral (Id), “maturity” (IIIb), “peaked” inflammatory (IIIc), and “sustained” inflammatory (IIId) modules in single cells (columns) in – from left to right – the “in-tube”, “on-chip”, IFNAR−/−, STAT1−/−, and TNFR−/− conditions. Yellow/purple color scale: scaled expression values (z-scores). (h) Scores of the “peaked” inflammatory module for Ifnar−/− DCs with recombinant cytokines. Shown are box plots of the “peaked” inflammatory module scores (SI, Y axis) for three population-level replicates of a 4h LPS stimulation of Ifnar−/− DCs to which a recombinant cytokine (X axis) has been added at 2h after stimulation. Notably, adding IL-10 significantly reduces the “peaked” inflammatory module. (i) Stat1 knockout affects expression and variation of “peaked” inflammatory genes. Shown are expression distributions for five “peaked” inflammatory genes after 4h of LPS stimulation in each of three conditions: “in-tube” stimulation of WT DCs (control; left), “on-chip” stimulation of WT cells (no cell-to-cell signaling; middle), and a stimulation of DCs from Stat1−/− mice (performed “in-tube”; right). (j,k) Population-level paracrine signaling enhances and coordinates the “core” antiviral response while dampening and desynchronizing the “peaked” inflammatory ones. (j) Gene network model showing how positive IFN-β signaling induces the antiviral response and reduces its heterogeneity, while simultaneously activating a negative paracrine feedback loop, possibly including IL-10, which dampens the “peaked” inflammatory cluster and increases its heterogeneity. (k) Cell population model showing how positive and negative paracrine feedback alter antiviral (magenta) and inflammatory (green) gene expression variability across cells. Grey denotes no expression.
Supplementary Material
ACKNOWLEDGEMENTS
We thank B. Tilton, T. Rogers, and M. Tam for assistance with cell sorting; E. Shefler, C. Guiducci, D. Thompson, and O. Rozenblatt-Rosen for project management and the Broad Genomics Platform for sequencing. We thank J. West, R. Lebofsky, A. Leyrat, M. Thu, M. Wong, W. Yorza, D. Toppani, M. Norris, and B. Clerkson for contributions to C1 system development, B. Alvarado, M. Ray and L. Knuttson for assistance with C1 experiments, M. Unger for helpful discussions. Work was supported by an NIH Postdoctoral Fellowship (1F32HD075541-01, RS), an NIH grant (U54 AI057159, NH), an NIH New Innovator Award (DP2 OD002230, NH), an NIH CEGS (1P50HG006193-01, HP, NH, AR), NIH Pioneer Awards (5DP1OD003893-03 to HP, DP1OD003958-01 to AR), the Broad Institute (HP and AR), HHMI (AR), the Klarman Cell Observatory at the Broad Institute (AR), an ISF-Broad Grant (NF), and the ERC (NF).
Footnotes
AUTHOR CONTRIBUTIONS
AR, APM, HP, AKS, RS & JS conceived and designed the study. AKS, JS, JTT, DL, DG, PC, RSG, JTG, BF, SW, JW, XW, RD, & RR performed experiments. RS, AKS, SS, & NY performed computational analyses. RS, AKS, JS, NF, HP, APM & AR wrote the manuscript, with extensive input from all authors. JS, PC, BF, SW, JW, XW, & APM declare competing financial interests as employees and/or stockholders in Fluidigm Corp.
References
- 1.Tay S, et al. Single-cell NF-κB dynamics reveal digital activation and analogue information processing. Nature. 2010;466:267–271. doi: 10.1038/nature09145. [DOI] [PMC free article] [PubMed] [Google Scholar]
- 2.Raj A, Van Oudenaarden A. Single-Molecule Approaches to Stochastic Gene Expression. Annual Review of Biophysics. 2009;38:255–270. doi: 10.1146/annurev.biophys.37.032807.125928. [DOI] [PMC free article] [PubMed] [Google Scholar]
- 3.Slack MD, Martinez ED, Wu LF, Altschuler SJ. Characterizing heterogeneous cellular responses to perturbations. Proceedings of the National Academy of Sciences. 2008;105:19306–19311. doi: 10.1073/pnas.0807038105. [DOI] [PMC free article] [PubMed] [Google Scholar]
- 4.Sharma SV. A chromatin-mediated reversible drug-tolerant state in cancer cell subpopulations. Cell. 2010;141:69–80. doi: 10.1016/j.cell.2010.02.027. [DOI] [PMC free article] [PubMed] [Google Scholar]
- 5.Spencer SL, Gaudet S, Albeck JG, Burke JM, Sorger PK. Non-genetic origins of cell-to-cell variability in TRAIL-induced apoptosis. Nature. 2009;459:428–432. doi: 10.1038/nature08012. [DOI] [PMC free article] [PubMed] [Google Scholar]
- 6.Taniguchi Y, et al. Quantifying E. coli Proteome and Transcriptome with Single-Molecule Sensitivity in Single Cells. Science. 2010;329:533–538. doi: 10.1126/science.1188308. [DOI] [PMC free article] [PubMed] [Google Scholar]
- 7.Loewer A, Lahav G. We are all individuals: causes and consequences of non-genetic heterogeneity in mammalian cells. Current opinion in genetics & development. 2011;21:753–758. doi: 10.1016/j.gde.2011.09.010. [DOI] [PMC free article] [PubMed] [Google Scholar]
- 8.Feinerman O, et al. Single-cell quantification of IL-2 response by effector and regulatory T cells reveals critical plasticity in immune response. Molecular Systems Biology. 2010;6:1–16. doi: 10.1038/msb.2010.90. [DOI] [PMC free article] [PubMed] [Google Scholar]
- 9.Veening J-W, Smits WK, Kuipers OP. Bistability, Epigenetics, and Bet-Hedging in Bacteria. Annual Review of Microbiology. 2008;62:193–210. doi: 10.1146/annurev.micro.62.081307.163002. doi:110.1146/annurev.micro.62.081307.163002. [DOI] [PubMed] [Google Scholar]
- 10.Fang M, Xie H, Dougan SK, Ploegh H, Van Oudenaarden A. Stochastic Cytokine Expression Induces Mixed T Helper Cell States. PLoS biology. 2013;11:e1001618. doi: 10.1371/journal.pbio.1001618. [DOI] [PMC free article] [PubMed] [Google Scholar]
- 11.Chalancon G, et al. Interplay between gene expression noise and regulatory network architecture. Trends in genetics : TIG. 2012;28:221–232. doi: 10.1016/j.tig.2012.01.006. [DOI] [PMC free article] [PubMed] [Google Scholar]
- 12.Bendall SC. Single-Cell Mass Cytometry of Differential Immune and Drug Responses Across a Human Hematopoietic Continuum. Science (New York, NY) 2011;332:677–678. doi: 10.1126/science.1198704. [DOI] [PMC free article] [PubMed] [Google Scholar]
- 13.Hashimshony T, Wagner F, Sher N, Yanai I. CEL-Seq: Single-Cell RNA-Seq by Multiplexed Linear Amplification. Cell Reports. 2012 doi: 10.1016/j.celrep.2012.08.003. [DOI] [PubMed] [Google Scholar]
- 14.Islam S, et al. Characterization of the single-cell transcriptional landscape by highly multiplex RNA-seq. Genome Research. 2011 doi: 10.1101/gr.110882.110. [DOI] [PMC free article] [PubMed] [Google Scholar]
- 15.Ramskold D, et al. Full-length mRNA-Seq from single-cell levels of RNA and individual circulating tumor cells. Nature Biotechnology. 2012;30:777–782. doi: 10.1038/nbt.2282. [DOI] [PMC free article] [PubMed] [Google Scholar]
- 16.Shalek AK. Single-cell transcriptomics reveals bimodality in expression and splicing in immune cells. Nature. 2013;498:236–240. doi: 10.1038/nature12172. [DOI] [PMC free article] [PubMed] [Google Scholar]
- 17.Tang F, et al. mRNA-Seq whole-transcriptome analysis of a single cell. Nature Methods. 2009;6:377–382. doi: 10.1038/nmeth.1315. [DOI] [PubMed] [Google Scholar]
- 18.Amit I, et al. Unbiased reconstruction of a mammalian transcriptional network mediating pathogen responses. Science. 2009;326:257–263. doi: 10.1126/science.1179050. [DOI] [PMC free article] [PubMed] [Google Scholar]
- 19.Wu AR. Quantitative assessment of single-cell RNA-sequencing methods. Nature Methods. 2013 doi: 10.1038/nmeth.2694. [DOI] [PMC free article] [PubMed] [Google Scholar]
- 20.Storey JD, Tibshirani R. Statistical significance for genomewide studies. Proc Natl Acad Sci U S A. 2003;100:9440–9445. doi: 10.1073/pnas.1530509100. [DOI] [PMC free article] [PubMed] [Google Scholar]
- 21.McDavid A, et al. Data exploration, quality control and testing in single-cell qPCR-based gene expression experiments. Bioinformatics. 2013;29:461–467. doi: 10.1093/bioinformatics/bts714. [DOI] [PMC free article] [PubMed] [Google Scholar]
- 22.Islam S, et al. Highly multiplexed and strand-specific single-cell RNA 5' end sequencing. Nature Protocols. 2012;7:813–827. doi: 10.1038/nprot.2012.022. [DOI] [PubMed] [Google Scholar]
- 23.Marinov GK. From single-cell to cell-pool transcriptomes: Stochasticity in gene expression and RNA splicing. Genome Research. 2014;24:496–510. doi: 10.1101/gr.161034.113. doi:papers2://publication/doi/10.1101/gr.161034.113. [DOI] [PMC free article] [PubMed] [Google Scholar]
- 24.Garber M, et al. A High-Throughput Chromatin Immunoprecipitation Approach Reveals Principles of Dynamic Gene Regulation in Mammals. Molecular Cell. 2012;47:810–822. doi: 10.1016/j.molcel.2012.07.030. [DOI] [PMC free article] [PubMed] [Google Scholar]
- 25.Weibrecht I, et al. Visualising individual sequence-specific protein-DNA interactions in situ. New BIOTECHNOLOGY. 2011:1–10. doi: 10.1016/j.nbt.2011.08.002. [DOI] [PubMed] [Google Scholar]
- 26.Lee TK. A Noisy Paracrine Signal Determines the Cellular NF-κB Response to Lipopolysaccharide. Science Signaling. 2009;2 doi: 10.1126/scisignal.2000599. ra65-ra65. [DOI] [PMC free article] [PubMed] [Google Scholar]
- 27.Rand U, et al. Multi-layered stochasticity and paracrine signal propagation shape the type-I interferon response. Molecular Systems Biology. 2012;8 doi: 10.1038/msb.2012.17. [DOI] [PMC free article] [PubMed] [Google Scholar]
- 28.Zhao M, Zhang J, Phatnani H, Scheu S, Maniatis T. Stochastic Expression of the Interferon-β Gene. PLoS biology. 2012;10:e1001249. doi: 10.1371/journal.pbio.1001249. [DOI] [PMC free article] [PubMed] [Google Scholar]
- 29.Snijder B, et al. Population context determines cell-to-cell variability in endocytosis and virus infection. Nature. 2009;461:520–523. doi: 10.1038/nature08282. [DOI] [PubMed] [Google Scholar]
- 30.Benveniste EN, Qin H. Type I Interferons as Anti-Inflammatory Mediators. Science's STKE. 2007;2007 doi: 10.1126/stke.4162007pe70. pe70-pe70. [DOI] [PubMed] [Google Scholar]
- 31.Freedberg IM, Tomic-Canic M, Komine M, Blumenberg M. Keratins and the keratinocyte activation cycle. J. Invest. Dermatol. 2001;116:633–640. doi: 10.1046/j.1523-1747.2001.01327.x. [DOI] [PubMed] [Google Scholar]
- 32.Rabani M, et al. Metabolic labeling of RNA uncovers principles of RNA production and degradation dynamics in mammalian cells. Nature Biotechnology. 2011;29:436–442. doi: 10.1038/nbt.1861. [DOI] [PMC free article] [PubMed] [Google Scholar]
- 33.Waters CM, Bassler BL. QUORUM SENSING: Cell-to-Cell Communication in Bacteria. Annual Review of Cell and Developmental Biology. 2005;21:319–346. doi: 10.1146/annurev.cellbio.21.012704.131001. doi:110.1146/annurev.cellbio.21.012704.131001. [DOI] [PubMed] [Google Scholar]
- 34.Banchereau J, Pascual V. Type I Interferon in Systemic Lupus Erythematosus and Other Autoimmune Diseases. Immunity. 2006;25:383–392. doi: 10.1016/j.immuni.2006.08.010. [DOI] [PubMed] [Google Scholar]
- 35.Hall JC, Rosen A. Type I interferons: crucial participants in disease amplification in autoimmunity. Nature Reviews Rheumatology. 2010;6:40–49. doi: 10.1038/nrrheum.2009.237. [DOI] [PMC free article] [PubMed] [Google Scholar]
- 36.Li B, Dewey CN. RSEM: accurate transcript quantification from RNA-Seq data with or without a reference genome. BMC Bioinformatics. 2011;12:323–323. doi: 10.1186/1471-2105-12-323. [DOI] [PMC free article] [PubMed] [Google Scholar]
Associated Data
This section collects any data citations, data availability statements, or supplementary materials included in this article.


