Abstract
A study of the Mn K absorption pre-edges in oxides using resonant inelastic X-ray scattering (RIXS) spectroscopy is presented. The energy transfer dimension enhances the separation of the pre-edge (predominantly 1s to 3d transitions) from the main K-edge and a detailed analysis is thus possible. The RIXS spectra are sensitive to the Mn spin state. The technique thus yields detailed information on the electronic structure that is not accessible in conventional K-edge absorption spectroscopy. The line splittings can be understood within a ligand field multiplet model, showing the importance of (2p,3d) two-electron interactions that give rise to the spin-sensitivity.
Keywords: A inorganic compounds, C XAFS, D crystal fields, D electronic structure
1. Introduction
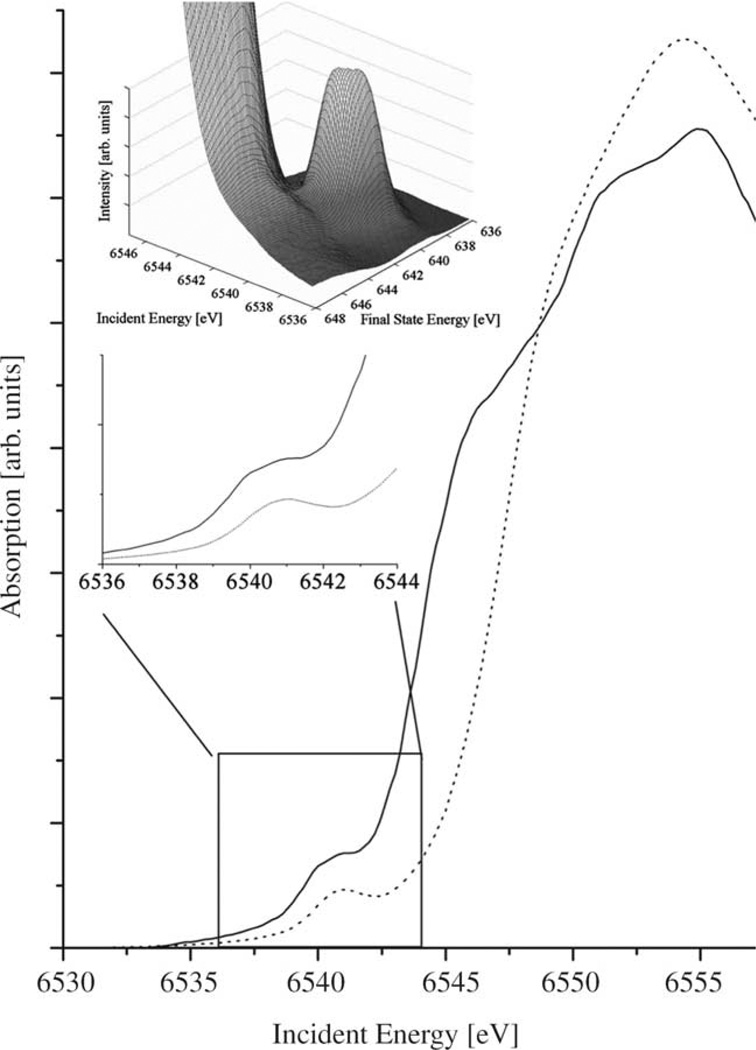
The X-ray absorption near edge structure (XANES) of the Mn K-edge absorption spectrum mainly reflects the Mn p-orbital contribution to the unoccupied orbitals due to the dipole selection rules. Mn XANES spectra have been used for example to monitor changes in the Mn oxidation state in biocatalysis [1]. Interpretation of XANES is difficult because of the many factors that influence the spectral shape [2]. A weak spectral feature arises at incident photon energies lower than the main K absorption edge (cf. Fig. 1). The potential of this K absorption pre-edge feature to extract information on the metal atom electronic structure and the local symmetry at the metal site is well known [3]. However, the K pre-edge spectral features are usually weak compared to the main edge because they mostly draw their intensities from quadrupole transition matrix elements. Furthermore, the energy separation between pre-edge and main edge decreases towards the early transition metals. A detailed analysis of the K pre-edge spectral features in conventional absorption spectroscopy is therefore often limited and associated with a rather large uncertainty because a strong background from dipole allowed transition at higher energies has to be subtracted. Hence, only few such studies are available for Mn [4].
Fig. 1.
Mn K-edge XANES in MnO (solid) and Mn(acac)2(H2O)2. The lower inset shows the pre-edge region. The upper inset shows the 1s2p (L3) RIXS surface plot at the pre-edge of MnO.
The resonant inelastic X-ray scattering (RIXS) process is theoretically described by the Kramers–Heisenberg formula [5]:
| (1) |
The intermediate state |n〉 is reached from the ground state |g〉 via a transition operator T1. In a simplified picture using atomic configuration we can write |g〉 = 3dn and |n〉 = 1s3dn+1, i.e. a 1s electron is resonantly excited into a 3d orbital. The intermediate states |n〉 in 1s2p RIXS spectroscopy are the final states in conventional K-edge absorption spectroscopy. T1 identifies with the quadrupole transition operator if the scattering atom is six-coordinated with identical ligands in an octahedral geometry (Oh symmetry). The K pre-edge can obtain some contribution from dipole transitions if the local symmetry is lower than Oh.
The final states are reached via a 2p to 1s transition and T2, therefore, identifies with the dipole operator. The 1s2p RIXS final state configuration |f〉 = 2p53dn+1 is identical to the final state configuration in soft X-ray L-edge absorption spectroscopy. Transition metal L-edge spectra with their pronounced chemical sensitivity have been discussed in depth by numerous authors [6, 7]. In particular, it was found that the strong (2p,3d) multiplet interaction makes the L-edge more sensitive to the metal spin state. The same interaction also occurs in the 1s2p RIXS final states. In a RIXS study of a series of Ni coordination complexes similar spectral shapes as in L-edge spectroscopy were found in the energy transfer direction of the RIXS data thus demonstrating that RIXS is also sensitive to the metal spin state [8].
The incident energy Ω as well as the emitted energy ω are varied in a RIXS experiment. The recorded intensity is proportional to F(Ω, ω) (cf. Eq. (1)) and is thus plotted versus a two-dimensional grid. In order to assign the total energy of an electronic state to the axes of the spectra we will use the energy transfer or final state energy Ω–ω The energy transfer axis relates to the excitation energy in L-edge absorption spectroscopy.
2. Materials and methods
2.1. Mn model complexes
MnO, Mn(acac)2(H2O)2, Mn3O4, Mn2O3 and MnO2 were purchased from Alpha products. In order to minimize fluorescence ‘saturation’ and transmission ‘leakage’ artifacts, the samples were made optically thin by diluting the pure sample with boron nitride [9]. In all systems, Mn is six-coordinated with oxygen ligands and the local symmetry can be approximated by octahedral (Oh).
2.2. Synchrotron beamline
The RIXS data were recorded on the BioCAT undulator beamline 18-ID at the Advanced Photon Source [10]. The energy of the incoming synchrotron beam was selected by means of a nitrogen-cooled Si double-crystal monochromator with a (1,1,1) orientation. The sample was oriented at 458 relative to the incident beam and the beam size on the sample was 2.8 mm horizontal and 0.2 mm vertical FWHM. Higher harmonics were rejected by the focusing mirror. Using the fundamental undulator peak, the maximum incident flux was ~1013 photons/s at 6.5 keV. The incident X-ray monochromator energy bandwidth (FWHM) is approximately 1.0 eV at 6540 eV. The monochromator energy calibration was constantly checked by recording the K pre-edge peak of KMnO4 using two additional ion-chambers downstream of the sample.
2.3. Spectroscopy measurements
The scattered X-rays were collected by means of a crystal array spectrometer [11]. The (3,3,3) Bragg reflection of four spherically bent Ge crystals arranged in Rowland geometry was used. The analyzer crystals captured a solid angle of 3.4 × 10⁻² sr. A nitrogen-cooled solid state (Ge) detector was placed at the common focus of the four crystals and the entire emitted beam path was enclosed by a He-filled bag. We determined an intrinsic analyzer bandwidth of 0.8 eV by measuring the elastically scattered peak and assuming a 1.0 eV primary monochromator energy bandwidth. The spectrometer was calibrated by measuring the absolute angle of the Bragg reflection using optical tools. We estimate that the upper limit for the error of the absolute analyzer energy calibration is 1 eV.
All samples were kept in a liquid He cooled cryostat below 10 K and surrounded by an exchange gas (He). Systematic radiation damage studies were performed for all compounds. The beam position on the sample could be adjusted vertically and horizontally and the total illumination time per sample position was kept below the time limit when damage occurred. To obtain the two-dimensional RIXS plane we recorded constant emission energy ω (CEE) scans (‘on-the-fly’ data acquisition) with the spectrometer energy changed stepwise. Each scan corresponds to a diagonal cut in the (Ω, Ω–ω) plane. The experimental RIXS plane was splined on an energy grid with equal energy steps of 0.1 eV in both directions. A constant background was subtracted from all RIXS spectra. Intensity due to excitations at incident energies higher than the pre-edge was subtracted from the RIXS spectra similar to main edge subtraction in conventional absorption spectroscopy [12].
3. Results and discussion
The 1s2p (L3) RIXS surface plot at the Mn K absorption pre-edge of MnO is shown in Fig. 1. Comparison with the conventional absorption spectrum shows how the pre-edge structure is better separated from the main edge in the RIXS spectrum. Subtraction of the main edge is now possible with less ambiguity than in conventional absorption spectroscopy.
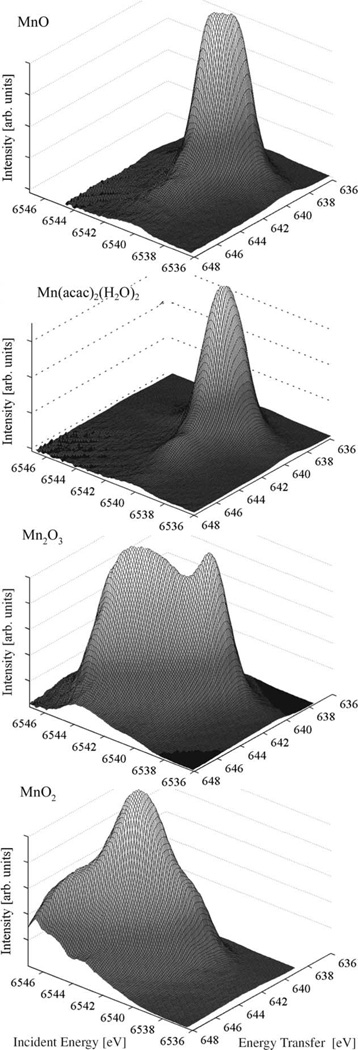
The 1s2p (L3) RIXS spectra of the three Mn oxides and Mn(acac)2(H2O)2 are shown in Fig. 2. The MnO pre-edge structure stretches diagonally over about 2 eV indicating that at least two strong resonances form the spectrum. We will show below that the pre-edge for Mn2+ is solely split by the crystal field. MnO and Mn2O3 show pre-edge intensity at around 6540.5 eV. However, for Mn2O3 the peak appears sharper and symmetric compared to MnO even though the crystal field splitting is larger. Multiplet interactions (i.e. (3d,3d) Slater integrals) are important for a Mn3+ ion that result in line splittings on the order of the crystal field [12].
Fig. 2.
1s2p RIXS surface plots for the Mn oxides and Mn(acac)2(H2O)2; The main edge is subtracted and only the K pre-edge resonances in the L3 final states are shown.
There is additional spectral intensity for Mn2O3 at ~6543.5 eV incident energy. The spectrum is different for MnO2 where only one broad structure is visible with one maximum and pronounced tails towards higher and lower energies. All experimental spectra, in particular the Mn(II) systems MnO and Mn(acac)2(H2O)2, show asymmetric line shapes with shoulders in the direction of the energy transfer. These features are caused by electron-electron interactions that occur in the 2p53dn+1 final states but not in the 1s3dn+1 intermediate states.
The K absorption pre-edges show a strong dependence on the Mn oxidation state. The center of gravity of the entire pre-edge structure moves to higher energies with increasing oxidation state. Unlike the XANES spectral shape they are less dependent on interatomic distances. The two Mn(II) systems nicely demonstrate that the pre-edge is more useful as a diagnostic to determine oxidation states than the main edge. While a strong shift between MnO and Mn2(acac)2(H2O)2 is observed in the XANES (Fig. 1) the two systems give equal center-of-gravity values for the K pre-edge [12]. The smaller crystal field splitting in Mn2(acac)2(H2O)2 gives a sharper peak.
In order to simulate the K pre-edge spectral shape we use multiplet theory that is based on atomic wave function calculations but includes a crystal field [13]. In this first, qualitative understanding of the Mn K pre-edges we consider the ionic cases of Mn2+ in octahedral (Oh) environment.
The 1s to 3d quadrupole and 2p to 1s dipole transition matrix elements were calculated and fed into the Kramers-Heisenberg equation to yield the 1s2p RIXS spectrum. A ligand field splitting of 10 Dq = 1.1 eV was assumed and the Slater integrals were scaled down to 80% of their atomic values. The crystal field splitting was obtained by fitting the experimental spectrum. We used a 1.1 eV (0.5 eV) Lorentzian and a 1.0 eV (0.8 eV) Gaussian line shape to account for lifetime and instrumental broadening in the intermediate (final) state, respectively. The absolute configuration energies in Hartree-Fock self consistent field calculations are not accurate [14]. The calculated spectra were therefore shifted in energy to correspond with the experimental spectrum. Using the same parameters, we also calculated the absorption L-edge.
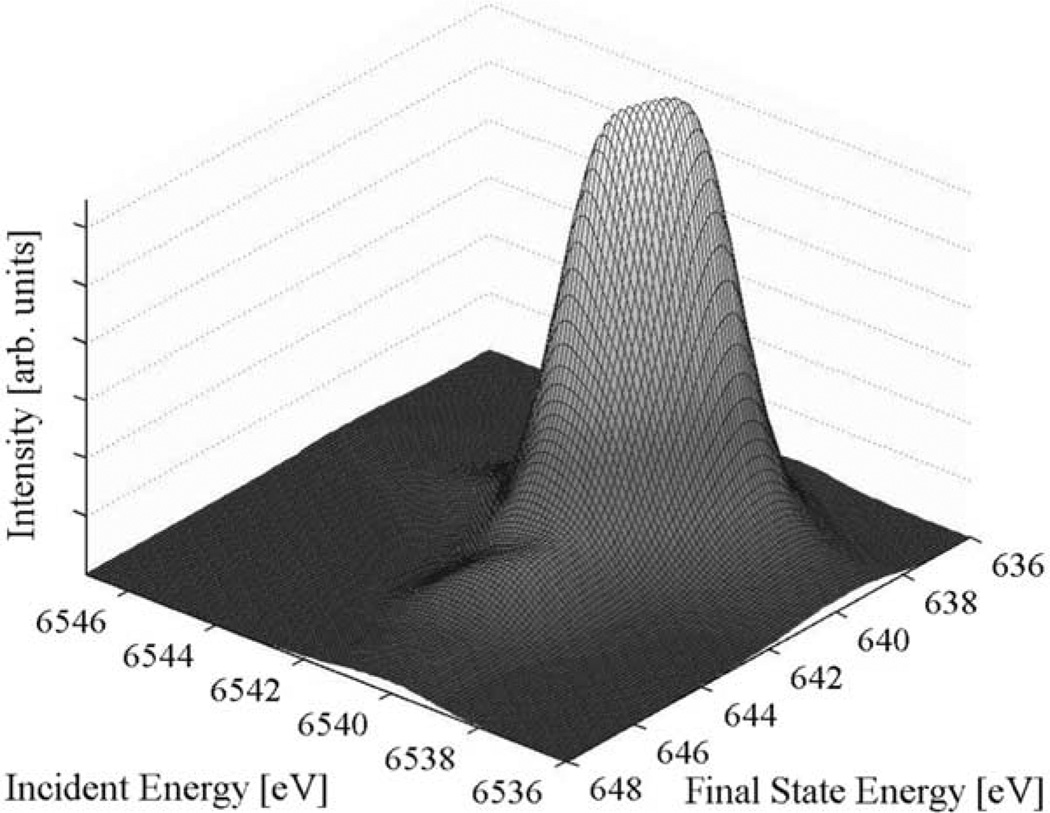
The calculated Mn2+ spectrum in Fig. 3 reproduces the spectral shape in MnO very well. The two strong resonances are separated by the crystal field splitting 10 Dq. They are not resolved in the convoluted spectrum due to the 1s core hole lifetime broadening. The slight differences in intensity between theory and experiment are due to orbital hybridization that is not included in the calculations. The weak shoulder in the final state energy direction, that only becomes visible after subtraction of the main edge, is reproduced in the calculations. It arises from multiplet interactions in the 2p53d6 final state configuration.
Fig. 3.
Calculated 1s2p (L3) RIXS surface plot based on ligand field multiplet calculations for a Mn2+ ion in octahedral symmetry with 10 DqZ1.1 eV.
Crystal field multiplet calculations for a Mn2+ ion in octahedral symmetry thus accurately reproduce the MnO 1s2p RIXS spectral shape, which shows that MnO forms an essentially pure 3d5 6A1 ground state. The ground state sextet spin multiplicity has a strong stabilizing effect on the electronic structure because of the (3d,3d) ‘exchange’ interaction between electrons with parallel spins. This is confirmed experimentally by the equal center-of-gravity position of the pre-edge in MnO and Mn(acac)2(H2O)2. All electron-electron multiplet splittings are absent in the 1s3d6 excited state of Mn2+ because of the 6A1 ground state symmetry. The final state (2p,3d) multiplet interactions are present and sensitive to the metal atom spin state. The weak shoulder along the energy transfer is indicative for a Mn2+ high-spin configuration as has been shown in soft X-ray L-edge spectroscopy [7].
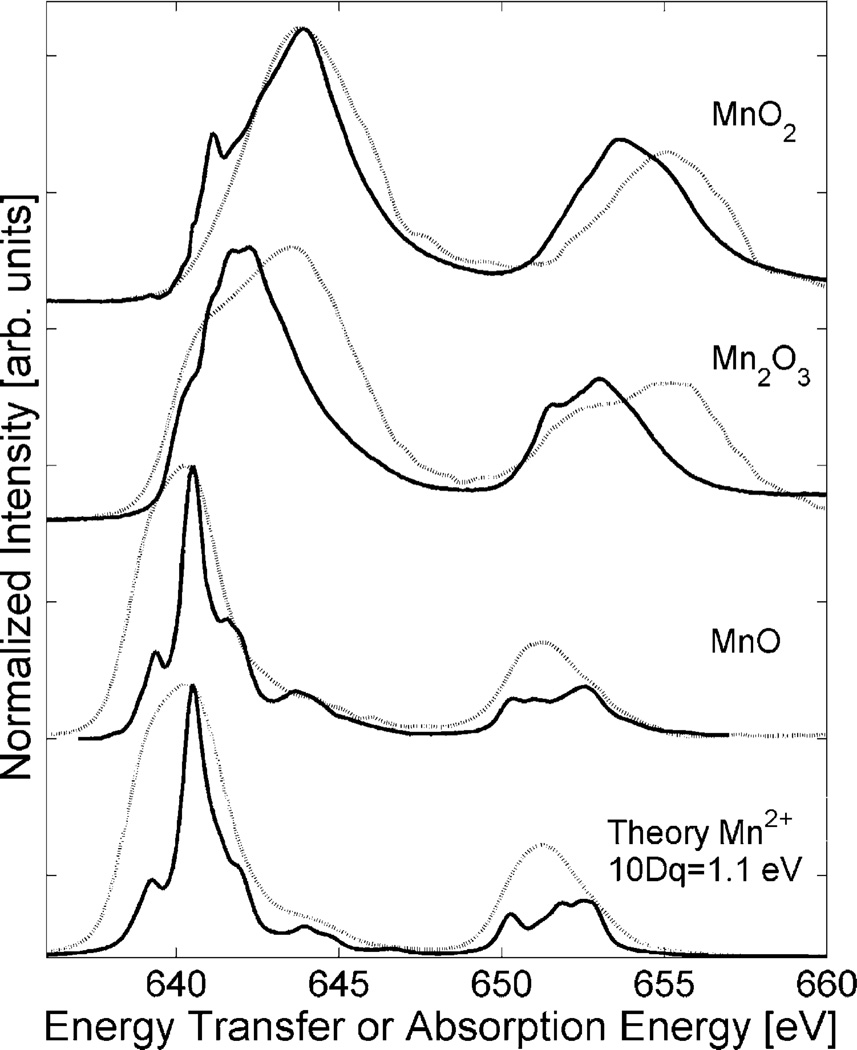
We compare in Fig. 4 the energy transfer spectra for the Mn oxides to the L-edge absorption spectra (taken from Ref. [15]). The energy transfer spectra were obtained by integrating the RIXS plane (after main edge subtraction) along the incident energy in the range of the pre-edge. The relative line intensities in the RIXS spectra are different from the L-edges while the shift to higher energies with increasing oxidation state can be observed in both techniques. Analysis of the I(L3)/I(L3+L2) branching ratio does not give a dependence on the oxidation state for 1s2p RIXS. The RIXS final states are reached via two transition matrix elements and we thus expect indeed that the relative line intensities differ between 1s2p RIXS and absorption L-edge. The calculations accurately reproduce the differences between the two techniques for MnO.
Fig. 4.
1s2p RIXS energy transfer spectra for the Mn oxides (dashed) compared to L-edge absorption (solid) and crystal field multiplet calculations.
4. Summary and outlook
RIXS spectroscopy greatly facilitates analysis of the K absorption pre-edges in Mn systems. The technique is furthermore sensitive to the valence electron spin-state via the (2p,3d) interaction in the final state. The energy transfer spectral resolution is only limited by the 2p core-hole lifetime of 0.5 eV. With some technical effort, future instrumental energy broadening of <0.6 eV should be obtainable at a realistic efficiency. This will allow for a more detailed analysis of both intermediate and final state effects, and thus provide new information on the electronic structure of numerous chemically important 3d metal systems.
Acknowledgements
This work was supported by the National Institutes of Health (Grant GM55302 (V.K.Y), GM44380 and GM65440 (S.P.C)), National Science Foundation (Grant CHE-0213952 (S.P.C.)) and the Director, Office of Science, Office of Basic Energy Sciences, Division of Chemical Sciences, Geosciences, and Biosciences, of the US Department of Energy (DOE), under Contract DE-AC03-76SF00098 (V.K.Y.) and DOE Office of Biological and Environmental Research (S.P.C.). The research of PG and FMFdG is supported by grants from Netherlands Scientific Organization-Chemical-Sciences (NWO-CW). UB was supported by the Stanford Synchrotron Radiation Laboratory, Department of Energy, Office of Basic Energy Sciences contract DE-AC03-765F00515. Use of the Advanced Photon Source was supported by the U.S. Department of Energy, Basic Energy Sciences, Office of Science, under contract No. W-31-109-ENG-38. BioCAT is a National Institutes of Health-supported Research Center RR-08630.
Contributor Information
Pieter Glatzel, Email: pieter.glatzel@gmx.org.
Uwe Bergmann, Email: bergmann@slac.stanford.edu.
Stephen P. Cramer, Email: cramer@batnet.com.
Vittal K. Yachandra, Email: vkyachandra@lbl.gov.
References
- 1.Penner-Hahn JE, Fronko RM, Pecoraro VL, Yocum CF, Betts SD, Bowlby NR. J. Am. Chem. Soc. 1990;112(7):2549–2557. [Google Scholar]; Yachandra VK, Sauer K, Klein MP. Chem. Rev. 1996;96(7):2927–2950. doi: 10.1021/cr950052k. [DOI] [PubMed] [Google Scholar]
- 2.Rehr JJ, Albers RC. Rev. Mod. Phys. 2000;72(3):621–654. [Google Scholar]; de Vries AH, Hozoi L, Broer R. Int. J. Quant. Chem. 2003;91(1):57–61. [Google Scholar]
- 3.Westre TE, Kennepohl P, DeWitt JG, Hedman B, Hodgson KO, Solomon EI. J. Am. Chem. Soc. 1997;119(27):6297–6314. [Google Scholar]; Wilke M, Farges F, Petit PE, Brown GE, Martin F. Am. Mineral. 2001;86(5/6):714–730. [Google Scholar]; Glatzel P, Bergmann U. Coord.Chem.Rev. 2005;249(1):65–95. [Google Scholar]
- 4.Visser H, Anxolabehere-Mallart E, Bergmann U, Glatzel P, Robblee JH, Cramer SP, Girerd JJ, Sauer K, Klein MP, Yachandra VK. J. Am. Chem. Soc. 2001;123(29):7031–7039. doi: 10.1021/ja004306h. [DOI] [PMC free article] [PubMed] [Google Scholar]; Hayashi H, Kawata M, Takeda R, Udagawa Y, Watanabe Y, Takano T, Nanao S, Kawamura N. J. Electron Spectrosc. Relat. Phenom. 2004;136(1/2):191–197. [Google Scholar]; Shoji H, Taguchi M, Hirai E, Iwazumi T, Kotani A, Nanao S, Isozumi Y. J. Phys. Soc. Jpn. 2003;72(6):1560–1569. [Google Scholar]
- 5.Kotani A, Shin S. Rev. Mod. Phys. 2001;73(1):203–246. [Google Scholar]; Gel’mukhanov F, Ågren H. Phys. Rep.—Rev. Sec. Phys. Lett. 1999;312(3/6):91–330. [Google Scholar]
- 6.de Groot FMF. J. Electron Spectrosc. Relat. Phenom. 1994;676(4):529–622. [Google Scholar]; Gilbert B, Frazer BH, Belz A, Conrad PG, Nealson KH, Haskel D, Lang JC, Srajer G, De Stasio G. J. Phys. Chem. A. 2003;107:2839–2847. [Google Scholar]
- 7.Cramer SP, de Groot FMF, Ma Y, Chen CT, Sette F, Kipke CA, Eichhorn DM, Chan MK, Armstrong WH, Libby E, Christou G, Brooker S, Mckee V, Mullins OC, Fuggle JC. J. Am. Chem. Soc. 1991;113(21):7937–7940. [Google Scholar]
- 8.Glatzel P, Bergmann U, Gu WW, Wang HX, Stepanov S, Mandimutsira BS, Riordan CG, Horwitz CP, Collins T, Cramer SP. J. Am. Chem. Soc. 2002;124(33):9668–9669. doi: 10.1021/ja026028n. [DOI] [PubMed] [Google Scholar]
- 9.Goulon J, Goulon-Ginet C, Cortes R, Dubois JM. J. Physiol.—Paris. 1982;43:539–548. [Google Scholar]
- 10.Bunker GB, Irving T, Black E, Zhang K, Fischetti R, Wang S, Stepanov S. BioCAT Undulator Beamline at APS, Ithaca. 1997. p. 16. [DOI] [PubMed] [Google Scholar]
- 11.Bergmann U, Cramer SP, editors. Crystal and Multilayer Optics. San Diego: SPIE, San Diego; 1998. In A high-resolution large-acceptance analyzer for X-ray fluorescence and raman spectroscopy; pp. 198–209. [Google Scholar]
- 12.Glatzel P, Bergmann U, Yano J, Visser H, Robblee J, Gu W, Groot FMFD, Pecoraro VL, Christou G, Cramer SP, Yachandra VK. J. Am. Chem. Soc. 2004;126(32):9946–9959. doi: 10.1021/ja038579z. [DOI] [PMC free article] [PubMed] [Google Scholar]
- 13.Slater JC. Quantum Theory of Atomic Structure. New York: McGraw-Hill; 1960. [Google Scholar]; Thole T, Cowan RD, Sawatzky GA, Fink J, Fuggle JC. Phys. Rev. B. :316856. doi: 10.1103/physrevb.31.6856. [DOI] [PubMed] [Google Scholar]
- 14.Meisel A, Leonhardt G, Szargan R. X-Ray Spectra and Chemical Binding. New York: Springer; 1989. [Google Scholar]
- 15.Morales F, de Groot FMF, Glatzel P, Kleimenov E, Bluhm H, Havecker M, Knop-Gericke A, Weckhuysen BM. J. Phys. Chem. B. 2004;108(41):16201–16207. [Google Scholar]


