

SUMMARY
Identification of driver mutations in human diseases is often limited by cohort size and availability of appropriate statistical models. We propose a novel framework for the systematic discovery of genetic alterations that are causal determinants of disease, by prioritizing genes upstream of functional disease drivers, within regulatory networks inferred de novo from experimental data. We tested this framework by identifying the genetic determinants of the mesenchymal subtype of glioblastoma. Our analysis uncovered KLHL9 deletions as upstream activators of two previously established master regulators of the subtype, C/EBPβ and C/EBPδ. Rescue of KLHL9 expression induced proteasomal degradation of C/EBP proteins, abrogated the mesenchymal signature, and reduced tumor viability in vitro and in vivo. Deletions of KLHL9 were confirmed in >50% of mesenchymal cases in an independent cohort, thus representing the most frequent genetic determinant of the subtype. The method generalized to study other human diseases, including breast cancer and Alzheimer’s disease.
INTRODUCTION
Identification of somatic mutations and germline variants that are determinants of cancer and other complex human diseases/traits (driver mutations) is mostly performed on a statistical basis, using models of genomic evolution (Frattini et al., 2013) or mutational bias (Lawrence et al., 2013), etc., to increase the significance of individual events. Achieving appropriate statistical power, however, requires large effect sizes or large cohorts due to multiple hypothesis testing correction (Califano et al., 2012). In addition, these approaches are not designed to provide mechanistic insight. As a result, many disease risk determinants, such as apolipoprotein E, were discovered long before they were mechanistically elucidated (Liu et al., 2013).
Network-based analyses have recently emerged as a highly effective framework for the discovery of Master Regulator (MR) genes that are functional disease drivers (Aytes et al., 2014a; Carro et al., 2010; Lefebvre et al., 2010; Piovan et al., 2013; Sumazin et al., 2011; Zhao et al., 2009). Here, we introduce DIGGIT (Driver-gene Inference by Genetical-Genomic Information Theory), an algorithm to identify genetic determinants of disease by systematically exploring regulatory/signaling networks upstream of MR genes. This collapses the number of testable hypotheses and provides regulatory clues to help elucidate associated mechanisms.
We first apply DIGGIT to identify causal genetic determinants of the MES-GBM subtype, which remain poorly characterized despite extensive efforts (Brennan et al., 2013; Verhaak et al., 2010). We then demonstrate its generalizability to other diseases for which matched expression and mutational data are available.
Astrocytoma grade IV or glioblastoma (GBM) is the most common human brain malignancy and is virtually incurable, with average survival of 12–18 months post diagnosis (Ohgaki and Kleihues, 2005). Gene expression profile analysis revealed three subtypes associated with expression of mesenchymal, proliferative, and pro-neural genes, respectively (Phillips et al., 2006). Among these, mesenchymal tumors (MES-GBM) present with worst prognosis, as confirmed by other studies (Carro et al., 2010; Sun et al., 2006; TCGA-Consortium, 2008). Integrative analysis of expression and mutational data (TCGA-Consortium, 2008) produced a more complex stratification into proneural (PN), neural, classic, and mesenchymal subtypes, as well an epigenetically distinct subtype (G-CIMP) with best prognosis (Verhaak et al., 2010). While non-G-CIMP PN tumors were associated with worst prognosis by (Brennan et al., 2013), MES-GBM tumors, based on the original classification, present virtually indistinguishable prognosis and are ~7-fold more frequent (Fig. S1). Thus the original MES-GBM and the newer Non-G-CIMP PN signatures are both objective, equivalent markers of poor prognosis.
Among the genetic alterations reported by the TCGA Consortium (TCGA-Consortium, 2008), only NF1 mutations/deletions were associated with MES-GBM tumors (~25% of samples) (Verhaak et al., 2010) while additional rare mutations and fusion events were recently reported (Danussi et al., 2013; Frattini et al., 2013). Thus, despite multiple studies, the genetic determinants of MES-GBM are still largely elusive and represent an ideal target for the new algorithm.
In (Carro et al., 2010), we reported that aberrant co-activation of the transcription factors (TFs) C/EBPβ, C/EBPδ, and STAT3 is necessary and sufficient to induce mesenchymal reprogramming in GBM, suggesting that this TF-module represents an obligate pathway or regulatory bottleneck between driver alterations and aberrant mesenchymal program activity. We thus hypothesize that the genetic drivers of MES-GBM are either among these genes or in their upstream pathways. Use of DIGGIT to test the hypothesis elucidated two high-frequency alterations: focal amplification of C/EBPδ and homozygous deletion of KLHL9, a Cullin E3 ligase adapter (Sumara et al., 2007).
To assess the algorithm’s generalizability to other diseases and germline variants, we also applied it to breast cancer (BRCA) and Alzheimer’s disease (AD). This identified driver alterations and variants missed by GWAS studies but validated by independent candidate-gene studies, as well as high-probability, yet unreported events.
RESULTS
Given a set of functional disease drivers, e.g., inferred by the Master Regulator Inference algorithm (MARINa) (Aytes et al., 2014a; Carro et al., 2010), DIGGIT evaluates candidate alterations in these genes and in their upstream regulators (see Fig. 1A for a flowchart). This is accomplished by a 5-step process (Fig. 1B-1F), requiring a large set (N ≥ 200) of gene expression profiles (henceforth GEPD) to assemble and analyze regulatory networks and a large set (N ≥ 100) of sample-matched genetic variant profiles (henceforth GVPD). We first discuss application of this pipeline to identify copy number variants (CNVs) that are causal determinants of the MES-GBM subtype. We then perform additional analyses to show that DIGGIT generalizes to the study of germline variants, as well as of other diseases, including breast cancer and Alzheimer’s.
Figure 1. The general workflow of DIGGIT.
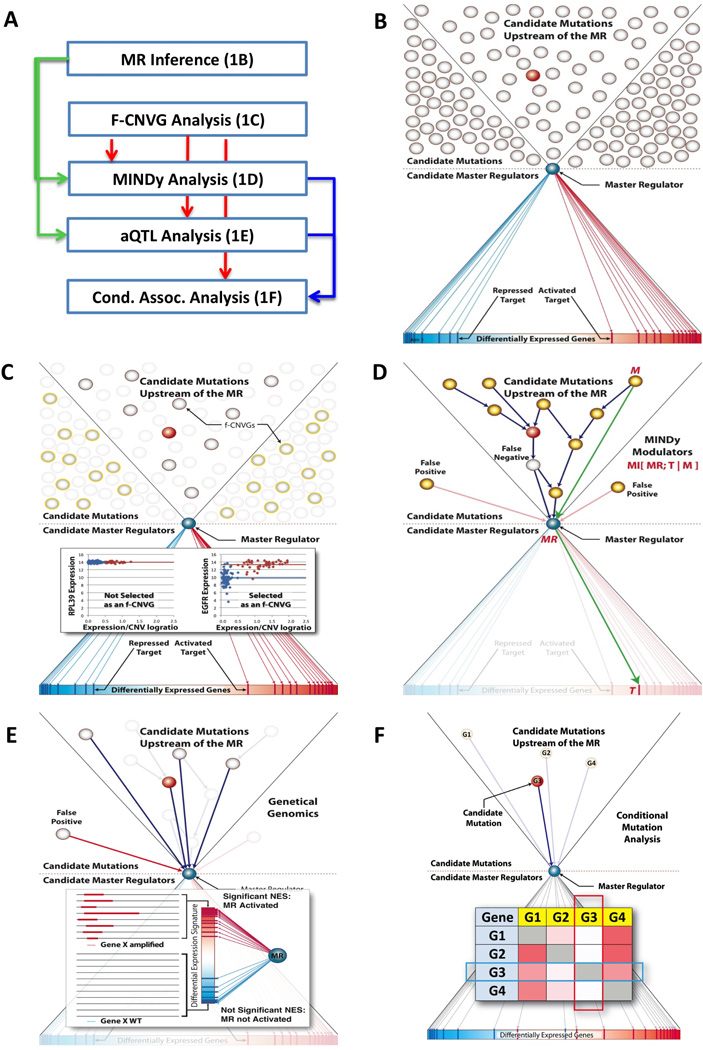
(A) Overall flowchart of the DIGGIT pipeline. Green, Red, and Blue arrows indicate use of MRs, F-CNVGs, and MINDy/aQTL analysis results, respectively. (B) Step 1: Identification of candidate MRs as TFs that activate and repress over-and under-expressed genes respectively, as inferred by the MARINa algorithm. To avoid clutter, only one MR (blue circle) is represented in the panel. Grey circles represent the repertoire of genetic alterations that may be associated with the phenotype, while those within the two diagonal lines (funnel) represent alterations in pathways upstream of the MR. The red circle represents a bona-fide causal driver alteration. (C) Step 2F-CNVGs are determined by association analysis of copy number and gene-expression (see methods), thus removing a large number of genes whose expression is not affected by ploidy. The insert shows two examples: (a) An example of no dependency between copy number and expression and not selected as a candidate F-CNVG, and (b) an example with highly significant dependency and thus selected as a candidate F-CNVG (D) Step 3: MINDy analysis identifies F-CNVGs that are candidate modulators of MR-activity (shown as yellow circles), by computing the Conditional Mutual Information I[MR;T|M], where M is a candidate modulator gene and T is an ARACNe-inferred MR-target gene. Blue arrows represent physical signal transduction interactions upstream of the MR. Green arrows represent one specific M→MR→T triplet tested by MINDy, as an illustrative example. Note that MINDy does not infer the blue arrows but only the fact that a protein is an upstream modulator of MR activity. (E) Step 4: aQTL analysis identifies F-CNVGs (shown as white circles), whose alterations co-segregates with aberrant MR-activity, as computed from MR-target expression and shown by the blue arrows. The insert shows details of this analysis. The vertical gradient rectangle shows all genes sorted from the most overexpressd (red) to the most underexpressed (blue), when comparing samples with copy number alterations in a gene (Gene ×) (thick red lines) to WT samples (thin black lines). If MR-targets significantly co-segregate with the differential expression signature (i.e., if positively regulated and repressed MR targets, shown as red and blue bars, are over and under expressed, respectively, as shown), then Gene × alterations are likely to affect MR-activity. (F) Step 5: Finally, conditional association analysis identifies F-CNVGs that abrogate all other associations with the phenotype (e.g., the MES-GBM subtype) when samples harboring their alterations are removed from the analysis. Each cell shows the statistical significance of the association between the i-th gene (rows) and the phenotype of interest (as a heatmap), when considering only samples that have no alterations in the j-th gene (columns). For instance, when conditioning on G3, no other gene is significantly associated with the subtype, while G3 is still significantly associated with the subtype when conditioning on G1, G2, or G4. This suggests that G3 is a bona fide driver gene.
Step 1 (MR Analysis, Fig. 1B)
This step requires a context-specific regulatory network representing TF → target interactions (henceforth, interactome), and a gene expression signature of interest (i.e., a p-value ranked list of differentially expressed genes) (input). These are analyzed by MARINa to produce a p-value ranked list of candidate MRs (output). Given a GEPD dataset, networks can be inferred using available reverse-engineering algorithms, such as ARACNe (Basso et al., 2005). Specifically, MARINa analysis of an ARACNe-inferred GBM network, using a MES-GBM signature identified six MR genes (MES-MRs), including C/EBPβ, C/EBPδ, STAT3, BHLHB2, RUNX1, and FOSL2, including C/EBPβ/C/EBPδ and STAT3 as synergistic MRs (Carro et al., 2010).
Step 2 (F-CNVG Analysis, Fig. 1C)
Functional alterations must induce aberrant activity of their gene products. Among copy number alterations (CNVGs), we thus select those whose ploidy is informative of gene expression as candidate functional CNVs (F-CNVGs) (Tamborero et al., 2013) (Fig. S1). This is assessed based on (a) Mutual Information (MI) between copy number and expression or (b) differential expression in WT vs. amplified/deleted samples (see Experimental Methods). Analyses are performed on the GEPD and sample-matched GVPD profiles (input), independent of subtype classification, to produce a p-value ranked list of candidate F-CNVGs (output).
Analysis of 229 profile-matched GBM samples in TCGA identified 1,486 candidate F-CNVGs (p ≤ 0.05, Bonferroni corrected). The MI test proved highly sensitive, accounting for 90% of inferred F-CNVGs (Supplemental Tables) (both KLHL9 and C/EBPδ were positive by MI analysis), with the T-test accounting for an additional 10% of low-frequency F-CNVGs, with low MI analysis sensitivity.
Most CNVGs (94%) were discarded as not informative of gene expression (see Fig. S1), suggesting no functional contribution. Conversely, inferred F-CNVGs included most genes previously reported as GBM drivers (14/18, >88%) (TCGA-Consortium, 2008), including EGFR, CDK4, PDGFRA, MDM2, MDM4, MET, AKT3, MYCN, PIK3CA, CDKN2A, CDKN2C, RB1, PTEN, and NF1 (p = 1.2×10⁻¹⁰) (Supplemental Tables). Analysis of remaining driver genes (CCND2, CDK6, CDKN2B, PARK2) revealed that they were missed either due to low event frequency (CDK6<1.3%, CCND2<2.2%, PARK2<5.2%) or below-detection gene expression levels (CDKN2B).
Among the MES-MRs, only C/EBPδ was inferred as a focally amplified F-CNVG (~22% of samples), suggesting that aberrant activity of other MES-MRs may be mediated by alterations in their upstream regulators.
Step 3 (MINDy Analysis, Fig. 1D)
Next, we interrogate pathways upstream of MR genes using the MINDy algorithm (Wang et al., 2009). MINDy analyzes a large GEPD, the candidate MR list (Step-1), and the F-CNVG list (Step-2) (input) to identify F-CNVGs that are candidate post-translational modulators of MR-activity (independent of subtype classification), by Conditional Mutual Information analysis (Wang et al., 2009; Zhao et al., 2009), see Supplemental Methods. This generates a p-value ranked list of candidate F-CNVGs in pathways upstream of MR genes (output). This step dramatically reduced the 1,486 F-CNVGs from Step-1 to only 92 statistically significant candidate MES-MR modulators; see Table S3.
Step 4 (aQTL Analysis, Fig. 1E)
F-CNVGs are then analyzed to identify those whose alteration is predictive of MR-activity, similar to expression quantitative trait loci (eQTL) discovery (Yang et al., 2009). Activity quantitative trait loci (aQTL) are inferred based on the statistical significance of the Mutual Information between copy number and MR-activity. For each candidate F-CNVG, this is computed using the MR-list (Step-1), the F-CNVG list (Step-2), the GEPD dataset, and the interactome (input) to generate a p-value ranked list of candidate F-CNVG-aQTL (output). Differential MR-activity is inferred from their differential target expression, using a single-sample version of MARINa (see Methods). This is critical, as MRs are frequently differentially active but not differentially expressed (Aytes et al., 2014a; Carro et al., 2010). Overall, 125 out of 1,486 F-CNVGs from Step-2 were inferred as aQTLs, including both C/EBPδ and KLHL9 (Fig. 2A, Table S3).
Figure 2. DIGGIT integrative analysis infers candidate MES-GBM driver mutations.
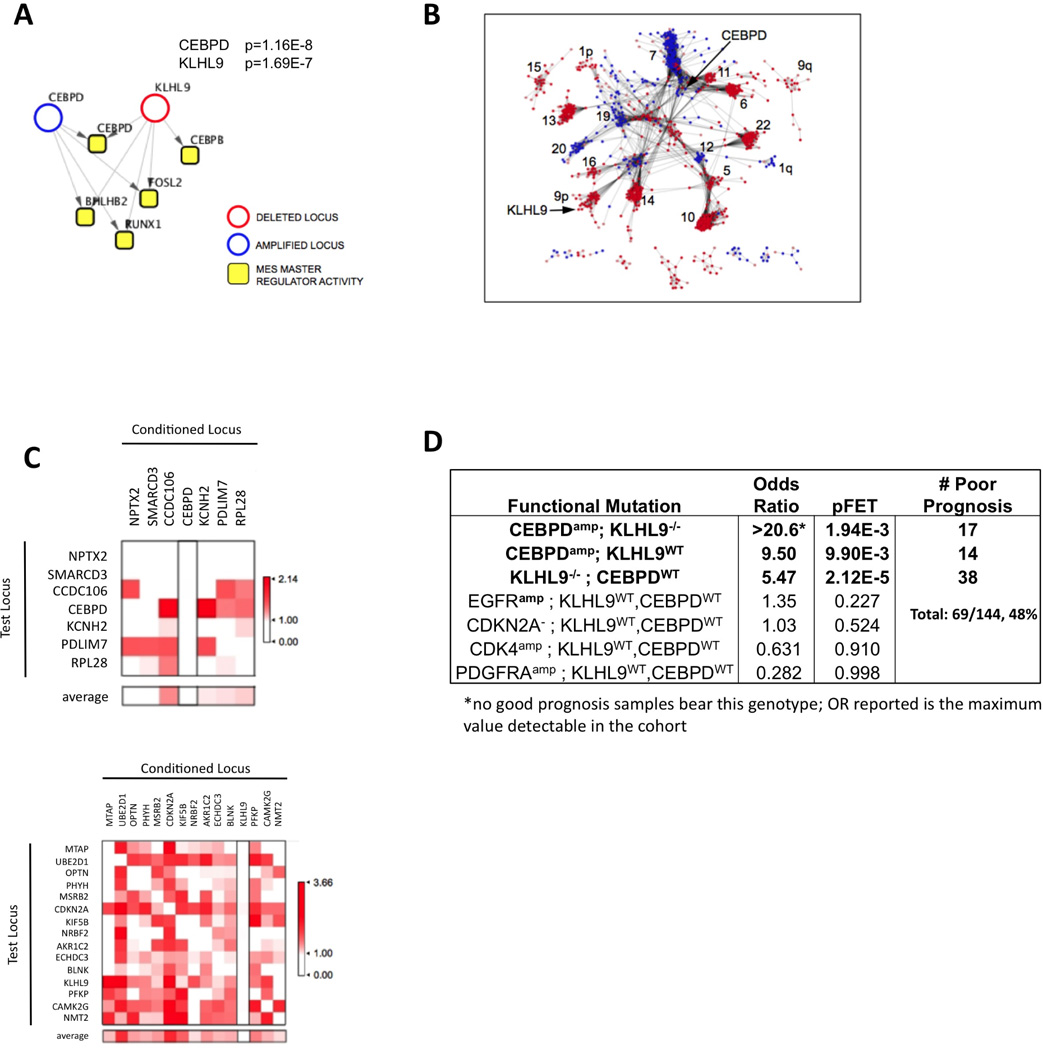
(A) DIGGIT analysis of pathways upstream of MES-GBM MRs identifies CEBPδ amplification and KLHL9 deletions as candidate genetic determinants of the GBM-MES subtype. p-values shown represent the integrated p-value of the aQTL and MINDy steps, as defined in Figure 1. (B) co-mutated F-CNVGs are shown as a network, with distance between connected nodes inversely proportional to the statistical significance of their co-segregation, as assessed by Fisher’s Exact Test (FET). Only statistically significant pairs are shown (p = 0.05, corrected), with amplifications and deletions represented as blue and red nodes, respectively. Chromosome location is reported for the larger clusters, and nodes representing C/EBPδ and KLHL9 are highlighted. (C) Conditional association analysis for the two main co-segregating mutation clusters identified by DIGGIT. Color scale in the matrix cell (i,j) represents the strength of association (−log10(p)) between the i-th F-CNVG (row) and the MES subtype, conditional to removing samples with alterations in the j-th F-CNVG (column), See Fig. S3. (D) Effect size of DIGGIT-inferred genetic determinants of the MES-GBM subtype. “Classical” GBM oncogenes are shown only as a reference, for comparison purpose. Marks indicate amplification (+) deletion (−) and diploid (WT) status for each gene.
Step 5 (Conditional Association Analysis, Fig. 1F)
MINDy and aQTL analyses are probabilistically integrated, using Fisher’s method, to prioritize F-CNVGs for the final step. As shown by the 2-fold reduction in candidate F-CNVGs (Table S3), these analyses provide largely statistically independent evidence.
CNVs can span multiple genes, resulting in statistical dependencies equivalent to linkage disequilibrium (LD) in classical genetics. Indeed F-CNVG clustering by sample co-segregation identified 34 clusters (Fig. 2B), largely reflecting chromosomal proximity. Conditional analysis helps assess whether association of a F-CNVG (fCNVi) with the phenotype may be an artifact resulting from its physical proximity to a bona fide driver F-CNVG (fCNVj), in which case conditional association of fCNVi with the phenotype (i.e., using only fCNVWT samples) should not be statistically significant, thus removing such artifacts. This step requires MINDy/aQTL prioritized F-CNVGs (Step-3/4), a phenotypic classifier, and the GEPD dataset (input) to produce a final p-value ranked list of candidate driver F-CNVGs (output).
For MES-GBM, the 41 F-CNVGs inferred as significant from integrative MINDy/aQTL analysis (Table S3) co-segregated into five distinct clusters: a 7-gene cluster (Chr. 5, 7, 8, and 19) including the C/EBPδ locus; a 15-gene cluster (Chr. 9), including the KLHL9/CDKN2A locus; a 11-gene cluster (Chr. 7), including the EGFR locus; a 5-gene cluster (Chr. 19); and a 3-gene cluster (Chr. 10) (see Fig. 2C and S3). The first cluster presented with a highly unlikely co-segregation pattern distributed over four chromosomes (p = 9.5 × 10⁻¹²). In addition, C/EBPS amplifications on chr-8 also co-segregated with NF1 point mutations, whose association with the MES-GBM subtype was previously reported (Verhaak et al., 2010). Since MINDy infers NF1 as a STAT3 but not a C/EBPβ/δ modulator and these proteins cooperate synergistically to induce MES reprogramming, this suggests a possible cooperative role of C/EBPδ and NF1 mutations. The 41 F-CNVGδ were tested for conditional association to the MES subtype (Fig. 2C). Only C/EBPS and KLHL9 abrogated association of all other F-CNVGδ, while remaining significant when conditioning on other F-CNVGδ (see Fig. 2C and S3).
Conditional analysis discarded CDKN2A, a well-established tumor suppressor located proximally to KLHL9, as candidate causal drivers of MES-GBM. Indeed, 85 samples with homozygous CDKN2A deletions but an intact KLHL9 locus (iCDKN2A−/−-/KLHL9WT) were not associated with MES-GBM. Conversely, 38 CDKN2A−/−-/KLHL9−/− samples (excluding C/EBPδ amplifications to avoid confounding factors) were highly associated with MES-GBM (p = 2.1 × 10⁻⁵), when compared to CDKN2A−/−/KLHL9WT samples.
Using a stringent call threshold, C/EBPδAmp and KLHL9−/− events account for 48% of TCGA MES-GBM samples (Fig. 2D), with independent deletions/mutations of NF1 covering an additional 8%, suggesting that these may constitute the most common subtype drivers. Table S3 summarizes the reduction in candidate F-CNVGδ resulting from each step of the analysis.
Association of KLHL9 deletions is confirmed in an independent cohort
Since C/EBPδ is a validated MES-MR (Carro et al., 2010), we focused on the functional significance of homozygous KLHL9 deletions. First, we tested whether their association with poor prognosis could be validated in an independent cohort. We analyzed 63 FFPEs, representing 40 poor prognosis (survival < 35 weeks) and 23 good prognosis (survival > 130 weeks) GBM samples. Quantitative genomic PCR revealed higher frequency of homozygous KLHL9 deletions in poor-prognosis (21/40) vs. good prognosis samples (4/23) (p =0.006, by FET), Fig. 3A, 3B. This suggests an even higher frequency (>50%) than in TCGA samples (38%). IHC staining of 10 KLHL9−/− and 10 KLHL9WT confirmed association with aberrant C/EBPβ and C/EBPδ protein expression in vivo (odds ratio 12.25, p = 0.028) (Fig. 3C). This confirms KLHL9−/− events as poor prognosis biomarkers and their association with aberrant MES-MR activity in vivo. No KLHL9 missense or nonsense mutations were detected.
Figure 3. KLHL9 deletions are associated with aberrant C/EBPβ and C/EBPδ levels and poorest prognosis in an independent GBM cohort.
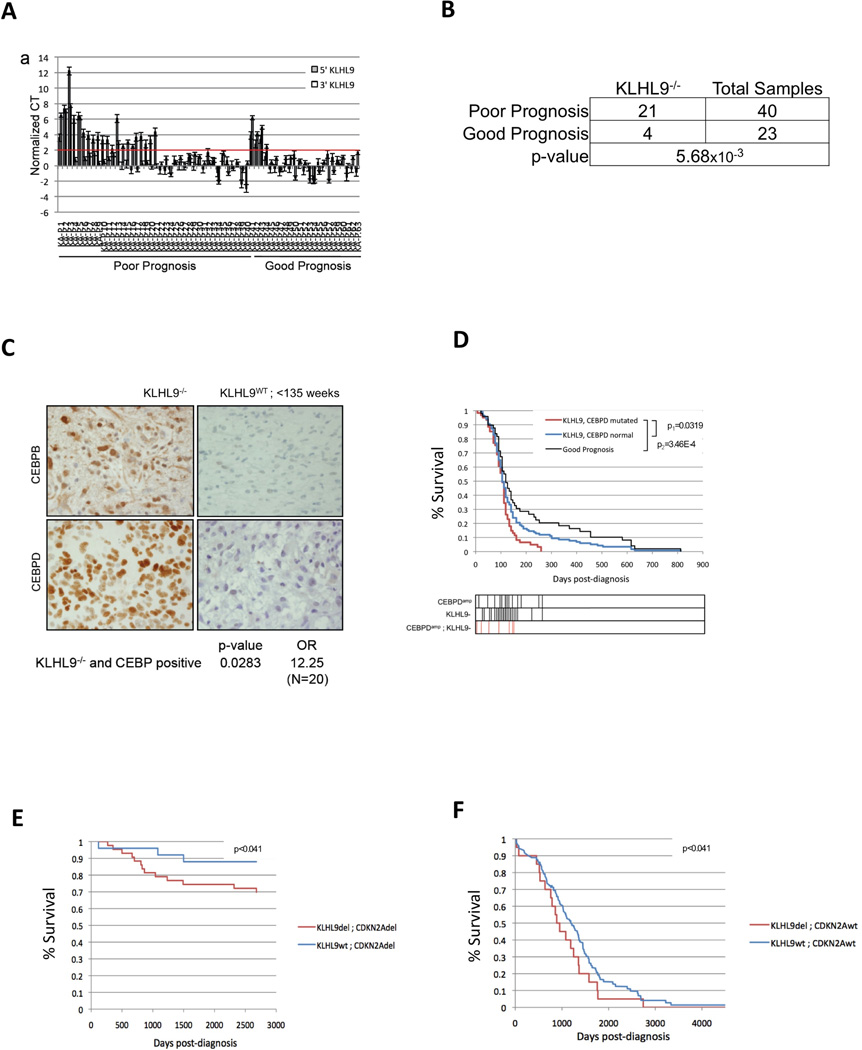
(A) Genomic q-PCR analysis of primary tumors from an independent 63 GBM patient cohort, shown as CT values. Values higher than the red horizontal line (max CT threshold) represent statistically significant homozygous KLHL9 deletions (KLHL9−/−) (p ≤ 0.05). Values are reported as mean ±SEM. (B) Contingency table generated from qPCR results in panel A, showing the statistical significance of the association between KLHL9−/− alterations and poor prognosis, as assessed by FET analysis (C) IHC staining for C/EBPβ and C/EBPδ in primary samples shows stronger immunoreactivity in KHLH9−/− samples compared to KLHL9WT controls. Association between KLHL9−/− alterations and aberrant expression of C/EBP proteins is summarized by odds ratio (OR) and p-value (FET); representative IHC slides are shown. (D) Kaplan-Meier analysis of GBM samples in TCGA. Patients with KLHL9−/− and C/EBPδAmp events are shown as a red curve; proneural subtype patients are shown as a black curve; finally, KLHL9WT/CEBPδWT samples are shown as a blue curve. Kaplan-Meier p-values are shown, including p1 (red vs. blue) and p2 (red vs. black). Survival for patients with each specific genotype is shown as vertical bars below the plot. (E,F) Kaplan-Meier analysis of the association between KLHL9−/− alterations and poor prognosis in lung and serous ovarian adenocarcinoma, respectively. Analysis of inferred differential activity of C/EBPβ and C/EBPδ in KLHL9−/− samples is shown in Fig. S4.
C/EBPδ and KLHL9 alterations are predictive of poor prognosis in multiple tumors
Mesenchymal reprogramming is generally associated with poor outcome in cancer (Thiery, 2002). We thus assessed whether C/EBPδAmp and KLHL9−/− events may be predictive of poor prognosis in GBM and other tumors, independent of potentially controversial subtype classification.
In GBM, Kaplan-Meier analysis revealed significantly worse prognosis for patients harboring C/EBPδAmp and KLHL9−/− alterations, compared to either good prognosis (i.e., non-mesenchymal patients) (Fig. 3D, p = 3.5 ×10⁻⁴), or C/EBPδWT/KLHL9WT patients (Fig. 3D, p =0.03). None of the patients with these alterations survived longer than 36 weeks post diagnosis (see vertical bars in Fig. 3D) and patients harboring both events had worst overall prognosis, suggesting a cooperative effect. Thus, C/EBPδAmp and KLHL9−/− represent genetic biomarkers of poor prognosis, independent of subtype classification.
Kaplan-Meier analysis of COSMIC (Forbes et al, 2008) and TCGA cohorts revealed that KLHL9 homozygous deletions and missense/nonsense mutations are associated with worst prognosis also in lung (LuAd) and ovarian (OvCa) adenocarcinomas (Fig. 3E, 3F), (p =1.8 ×10⁻³) and p =0.04 respectively, independent of CDKN2A status. In OvCa, most KLHL9−/− samples had no CDKN2A loss. Gene Set Enrichment Analysis (GSEA) (Subramanian et al., 2005) confirmed aberrant C/EBPβ and/or C/EBPδ activity in KLHL9−/− samples, suggesting a possible pan-cancer role of KLHL9 deletions via aberrant C/EBP activity (Fig. S4).
Ectopic KLHL9 expression in GBM cells abrogates C/EBPβ and C/EBPδ abundance
To mechanistically elucidate KLHL9-mediated regulation of established MES-MRs (C/EBPβ, C/EBPδ, and STAT3), we rescued KLHL9 expression in homozygously deleted cells. Genomic analysis of a GBM cell line panel identified SF210 and SF763 cells as KLHL9−/−;CDKN2A−/−;C/EBPWT.
Following inducible lentivirus-mediated rescue of KLHL9 expression in SF210 cells, two independent clones (KLHL9–4 and KLHL9–7) showed stable KLHL9 levels by Western blot, up to 96h post-induction (Fig. 4A, 4B). While C/EBPβ and C/EBPδ expression was not significantly affected (Fig. 4C inset), RNA-Seq profiling revealed significant differential expression of ARACNe-inferred C/EBPβ and C/EBPδ targets by GSEA (p = 0.004), compared to controls (Fig. 4A), with significantly downregulation of established MES markers: CHI3L1/YKL40, LIF, FOSL2, ACTA2, and FN1. Consistently, we observed significant reduction in C/EBPδ and more modest decrease in C/EBPβ protein levels. Levels of phospho-STAT3, representing the transcriptionally active isoform, were also reduced (Fig. S5). These results were recapitulated in SF763 cells, with marked reduction of C/EBPδ levels and more modest reduction of the C/EBPβ-LIP isoform in cells expressing KLHL9 relative to controls expressing RFP. Conversely, exogenous expression of P16/INK4A (CDKN2A) in SF210 had no effect on either C/EBPβ or C/EBPδ protein expression or on the MES signature genes (Fig. S5).
Figure 4. Rescue of KLHL9 expression downregulates C/EBPβ and C/EBPδ protein abundance, as well as expression of mesenchymal marker genes.
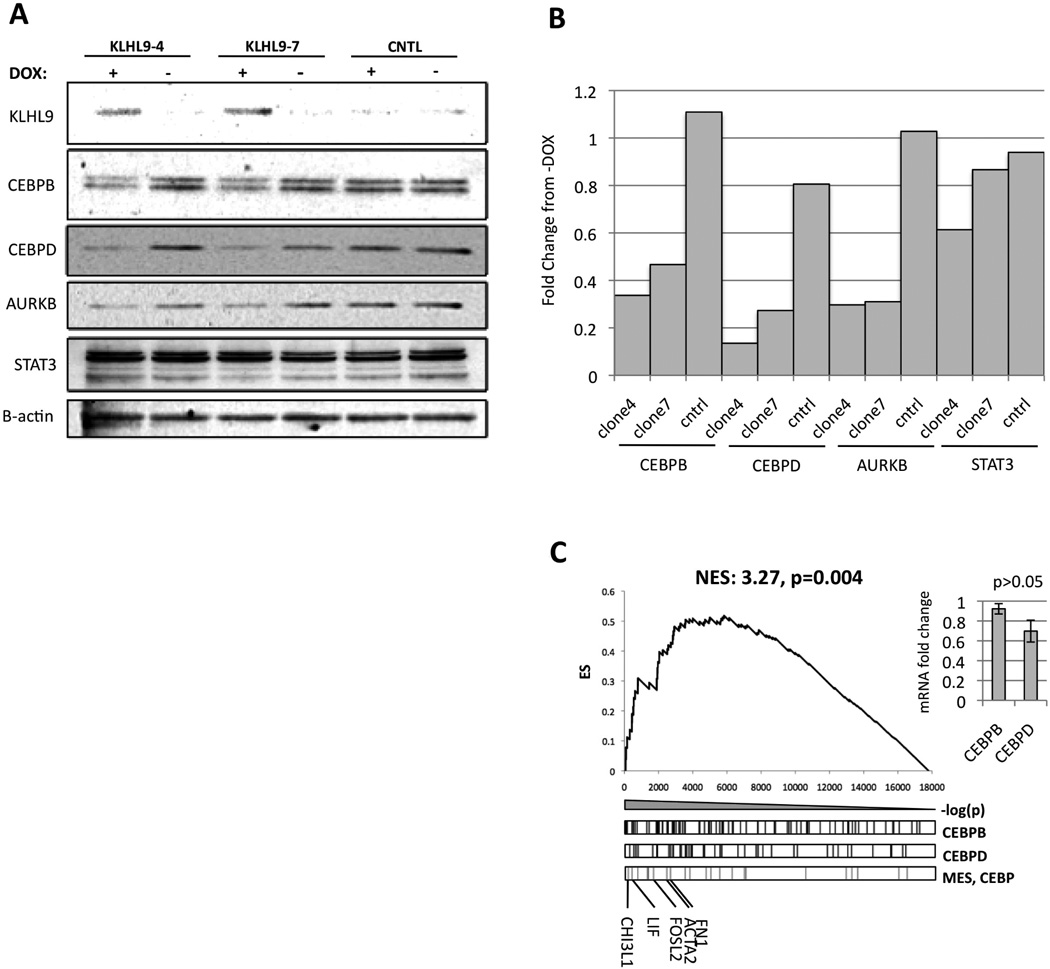
(A) KHLH9, C/EBPβ, C/EBPδ, and STAT3 protein levels in two isolated, doxycycline-inducible clones 48h after KHLH9 rescue. B-actin was used as housekeeping control gene. See Fig. S5 for additional blots (B) Densitometric quantification of the bands in 4B shows relative abundance of target proteins, including C/EBPβ/δ, AURKB, and STAT3. For each protein, values are normalized internally to BACT and then normalized again to the control. (C) GSEA analysis of ARACNe-inferred targets of C/EBPβ and C/EBPδ in genes differentially expressed following rescue of KLHL9 expression in SF210. The maximum value of the enrichment score (ES, y-axis) is used to quantify relative enrichment. A normalized enrichment score (NES) is then calculated to allow assessing the enrichment p-value (Subramanian et al., 2005). The p-value and NES shown by this graph represent the enrichment of the union of ARACNe-inferred targets of C/EBPβ and C/EBPδ that are also in the mesenchymal signature gene set (Phillips et al., 2006). Hashes in the three boxes below the plot indicate the rank of the ARACNe-inferred targets of these MRs and of other mesenchymal marker genes. Canonical mesenchymal markers are shown for reference. No significant changes in C/EBPβ and C/EBPδ mRNA levels were observed, inset.
These results show that rescue of KLHL9 expression collapses the MES-GBM signature by downregulating C/EBPβ and C/EBPδ at the protein level. This effect may be mediated by ubiquitin-dependent proteasomal degradation, as previously reported for the AuroraB kinase (Fig. 4B).
Proteasomal degradation of C/EBPβ and C/EBPδ depends on KLHL9-mediated poly-ubiquitylation
Given KLHL9’s putative function as an adaptor of Cul3-based E3 ubiquitin ligase (Sumara et al., 2007), we tested its role in mediating poly-ubiquitylation-dependent proteasomal degradation of C/EBPβ and C/EBPδ. Direct physical interaction between KLHL9 and both C/EBPβ and C/EBPδ proteins was confirmed by co-immunoprecipitation assays (Fig. 5A). We then measured degradation and relative half-life of C/EBPβ and C/EBPδ following rescue of KLHL9 expression in SF210 (Fig. 5B). C/EBPβ and C/EBPδ levels were significantly reduced at 4h following ectopic KLHL9 expression and cycloheximide-mediated inhibition of protein translation (Fig. 5B). Finally, MG-132-mediated proteasome inhibition abrogated C/EBPβ and C/EBPδ degradation, confirming that KLHL9 is required for their proteasomal processing. A more detailed time-course revealed a ~2h half life for these proteins following KLHL9 rescue (Fig. S6), compared to KLHL9−/− controls where they were stable beyond 4h.
Figure 5. Rescue of KLHL9 expression induces ubiquitylation and proteasomally-mediated degradation of C/EBPβ and C/EBPδ.
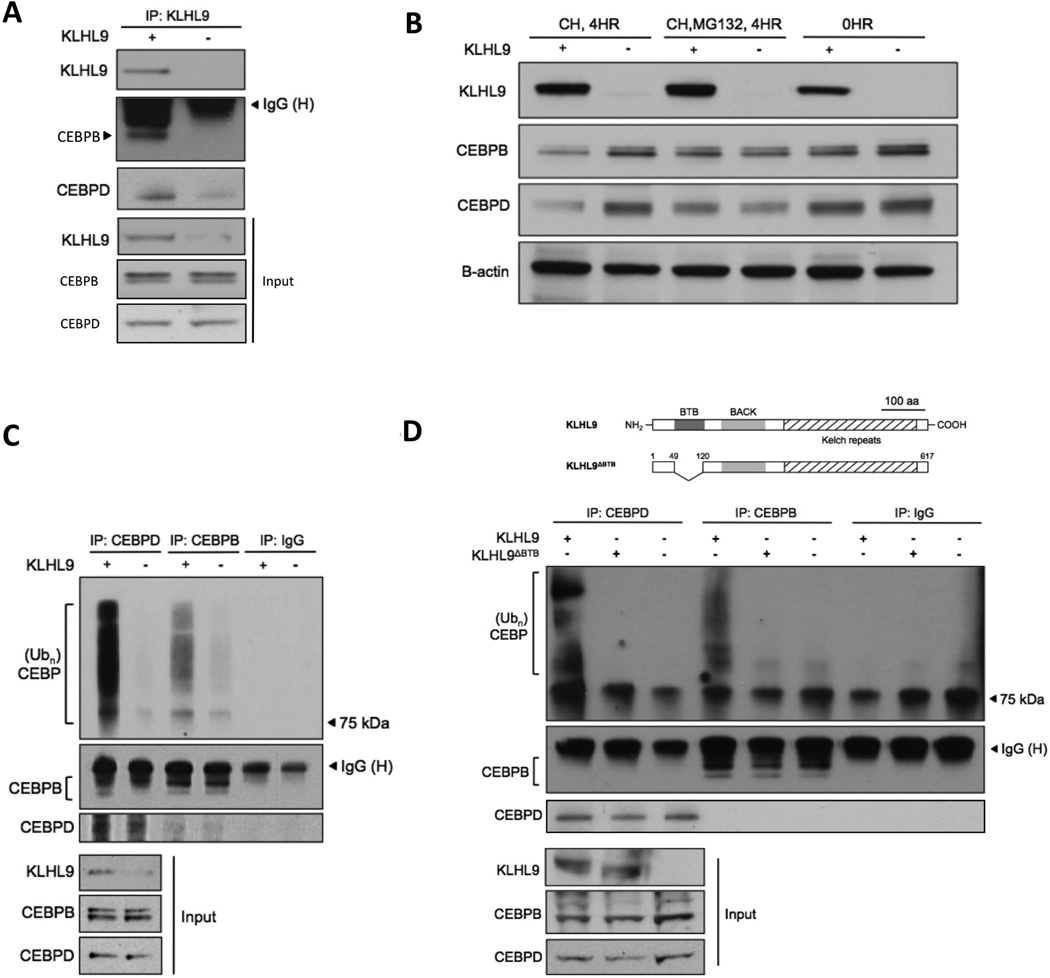
Abbreviations: CH=cycloheximide, MG132=proteasome inhibitor. (A) Co-immunoprecipitation assays for KLHL9 and C/EBP proteins suggest direct physical interaction. (B) Treating SF210 cells with cycloheximide inhibits protein translation, thus allowing assessment of C/EBPβ, C/EBPδ protein-species turnover. The decrease in C/EBP protein half-life, following ectopic KLHL9 expression, is rescued by treatment with proteasome inhibitor, MG-132. (C) Immunoprecipitation of C/EBPβ and C/EBPδ proteins in the presence of MG-132 and subsequent analysis of ubiquitylated species by Western blot. (D) A mutant KLHL9 protein isoform that cannot interact with the Cullin ligase was engineered by deleting the KLHL9 BTB domain, as indicated in the schematic. IP assays for ubiquitylated C/EBP species were repeated following ectopic expression of mutant KLHL9. A full time course is available in Fig. S6.
KLHL9 mediates poly-ubiquitylation of C/EBPβ and C/EBPδ isoforms
To determine whether proteasomal degradation of C/EBPs depends on KLHL9-mediated interaction with the CUL3 E3 ligase complex, we collected cell lysates following rescue of KLHL9 expression and MG-132 treatment to test for ubiquitylated species. Indeed, C/EBPβ and C/EBPδ poly-ubiquitylated isoforms increased significantly following KLHL9 rescue, compared to controls (Fig. 5C). Reciprocal assays confirmed this result (Fig. S6).
Finally, to confirm that KLHL9-mediated C/EBP regulation depends on a functional KLHL9-CUL3 E3 ligase complex, we cloned a mutant KLHL9 isoform with a 70aa deletion of its N-terminal BTB domain. This domain is required for ligase/target complex recruitment to the cullin scaffold, which mediates ubiquitin transfer to the target substrate (Xu et al., 2003). Expression of mutant KLHL9 abrogated poly-ubiquitylation of both C/EBP proteins in SF210 cells (Fig. 5D), resulting in half-lives comparable to control KLHL9−/− cells.
KLHL9 expression delays exit from S-phase in glioma cells
To study the functional consequences of KLHL9 deletion, we performed stable infection with KLHL9 or control expression constructs in SF210 and SF763 cells, for cell cycle analysis. As previously reported (Rutka et al., 1987), both cell lines are polyploid and aneuploid, with the majority of the cells found as tetraploid (Fig. S7). Rescue of KLHL9 expression resulted in decreased growth rates in both cell lines, with a more pronounced effect in SF210 (Fig. 6A and S7). C/EBPδ protein levels decreased in both cell lines after KHLH9 infection, and C/EBPβ isoform levels decreased in the SF210 line (Fig. 6B).
Figure 6. Ectopic KHLH9 expression decreases cellular proliferation by imposing a late S/G2 checkpoint in human GBM cells.

(A) Growth curves of SF210 cells after lentiviral-mediated expression of KLHL9 or RFP as a control; results are representative of three independent experiments. (B) Western blot analysis of asynchronous SF210 and SF763 cells after re-introduction of KLHL9, showing downregulation of C/EBP-δ and to a lesser extent C/EBP-β. Both uninfected cells and RFP infected cells are shown; β-actin serves as loading control. (C) Cell cycle profiles of KLHL9 and RFP-infected control SF763 cells synchronized by serum-free culture and then released into normal media for the indicated times. (D) BrdU incorporation by KLHL9 and RFP-infected control SF763 cells synchronized as in (c). For each time point, BrdU-labeling was performed as a 1-hour pulse preceding cell harvest. Additional data in Fig. S7.
Cells were then synchronized by serum-free starvation for 48h, released in regular media, and analyzed at selected time points with BrdU. We observed a constant increase in cell number in S-phase in KHLH9-expressing SF210 cells relative to controls (Fig. 6C). BrdU labeling revealed active S-phase at both 4h and 8h in KLHL9-expressing SF210 cells, compared to only 4h in control cells (Fig. 6D). SF763 cells also showed delayed entry into S-phase (at 4h compared with 2h in the control) and exited from S-phase only by 8h. However, while control cells re-entered S-phase by 8h, KHLH9-expressing cells did not, suggesting overall slowing of cell cycle progression, consistent with observed growth curves (Fig. 6A & S7). Finally, Western blot analysis of synchronized KLHL9-expressing cells also showed different kinetics for C/EBP isoforms, variable levels of AURKB, and higher levels of cyclin A and p21 protein expression. Taken together, our data suggest that rescue of KLHL9 expression delays the cell cycle by imposing a late S/G2 checkpoint.
KLHL9 expression in KLHL9 −/− patient-derived GBM tumors reduces growth in orthotopic xenografts
To test whether the in vitro effects of KLHL9 rescue were recapitulated in vivo, we identified a patient derived xenograft (PDX) model of KLHL9−/−GBM (HF2354), classified as a MES-GBM tumor by RNA-Seq profile analysis. The overall workflow of this experiment is outlined in Fig. 7A. The PDX model originated from a primary GBM tumor sample that was serially passaged in mice. We exogenously rescued expression of KLHL9 in HF2354 via stable infection with pLOC-KLHL9 or pLOC-RFP vectors. 96h after lentivirus infection, cells were orthotopically implanted in two 7-mouse cohorts. All 14 mice were observed daily and euthanized simultaneously at the first sign of distress (per IACUC protocol). Their brains were formalin fixed, breadloaffed, and paraffin embedded for histological assessment and IHC.
Figure 7. Ectopic KLHL9 expression, in patient-derived KLHL9−/−GBM tumors, reduces growth in orthotopic xenografts.

(A) Workflow of the PDX mouse model. Primary tumor samples are retrieved from human patients and explanted into mice for propagation instead of traditional in vitro cell culture. (B) Brain sections of mice given orthotopic injections of KLHL9-rescued or RFP control human-derived GBM cells (HF2354) reveals a significant decrease in tumor number and size. Clinical scoring of tumor size from a certified pathologist indicates a statistically significant difference in tumor growth rates (p = 0.04). H&E staining of face sections reveals significantly reduced surface area of tumor masses and is also provided.
Face cuts from the blocks were H&E stained for tumor identification and scored by a board-certified pathologist, from 0 [no tumor cells present in any sections] to 3 [major portion of hemisphere occupied by tumor]. Rescue of KLHL9 expression in HF2354 cells significantly impaired tumor growth compared to RFP-expressing controls (Fig. 7B), resulting in significant reduction in overall tumor mass (p = 0.04). The presence of some tumor cells was reported even in the absence of an expanding mass. As such, these values and associated p-value constitute an overly cautious interpretation of the assay.
These experiments show that in vitro cell-cycle dependent reduction in proliferative potential, induced by ectopic KLHL9 expression in human cell cultures, is recapitulated in vivo and induces retardation in tumor growth.
Unbiased inference of driver alterations in breast cancer and Alzheimer’s disease
To test whether DIGGIT could be generalized to study different disease models and germline variants, we performed full analysis (Steps 1–5) of sample-matched CNV/expression data from the TCGA breast cancer (BRCA) cohort (TCGA-Consortium, 2012), and of sample-matched SNP/expression data from a recent integrative study of Alzheimer’s disease (AD) (Zhang et al., 2013).
BRCA is a well-studied cancer with many established oncogenic drivers that have been functionally or mechanistically validated. We thus first performed a literature search to identify a repertoire of validated CNV alterations linked to BRCA tumorigenesis. The analysis revealed a set of 25 alterations, which are reported in Table S4, together with appropriate references. We then performed DIGGIT and GWAS analyses using TCGA data, naïve to these publications.
To identify candidate MR genes for BRCA, we first generated tumorigenic signatures for each tumor sample by differential expression analysis against the set of TCGA normal breast tissues. We then analyzed each signature using the single-sample MARINa algorithm, ssMARINa (see methods and (Aytes et al., 2014b)), to select the 10 most frequently inferred MRs. This effectively avoids bias from breast cancer subtype stratification, while still supporting identification of subtype-specific MRs. We chose the top 10 MR, because in previous studies, 50% to 70% of top MRs were experimentally validated. Using more MRs would thus decrease the specificity of MINDy and aQTL analyses without improving sensitivity. The optimal number of MRs for the analysis may need to be selected on a case-by-case basis.
Following candidate F-CNVGs analysis, integration of MINDy and aQTL results yielded 122 statistically significant F-CNVGs (FDR ≤ 0.05), of which 35 were selected by conditional association analysis. Of these, 19 (76%) could be matched in the 25-gene literature compiled list (Supplemental Table 4); yet only 5 of them were statistically significant by GWAS, while the remaining 14 were missed (FDR = 1). Finally, 6 literature-derived events were missed by DIGGIT: two could not be identified as MINDy modulators of top 10 MARINa-inferred MRs, while four were not statistically significant by aQTL analysis. A summary of this analysis is provided in Supplemental Table 4.
Analysis of an Alzheimer’s disease cohort, using patient-matched, brain gene expression and genotypic profiles from affected and non-affected individuals, identified TYROBP as a candidate germline determinant of the disease (Zhang et al., 2013). We downloaded the publicly available data used in these analyses and performed unbiased DIGGIT analysis, naïve to the published results. Since this analysis was based on single nucleotide polymorphisms (SNP), we modified Step-2 to identify candidate 𝓕-SNPs by selecting those within 1kb of a corresponding gene’s coding region (see Supplemental Methods). Similar to BRCA analysis, we used ssMARINa to identify the 10 most frequent MRs (See Methods). DIGGIT identified 112 𝓕-SNPs, with 63 passing MINDy/aQTL integration and 13 also significant by conditional association analysis. Among these, TYROBP was ranked 1st (p = 4.2 × 10 −47), achieving higher significance than even APOE, ranked 9th (p = 2.0× 10 −21) (see Supplemental Tables S5 and S6). An additional candidate SNP identified in the original publication (FCER1G) was ranked 8th (p = 9.1 × 10 −22) by our analysis.
DISCUSSION
Following ten years of genome-wide association studies (GWAS), elucidating the repertoire of causal genetic determinants of most complex diseases has proven more challenging than expected. Due to the large number of candidate loci, it is difficult to achieve the statistical power to detect all but the most highly penetrant and frequent events. Furthermore, when relevant genetic determinants emerge from these analyses, their mechanistic validation may lag by decades. At the other end of the spectrum, candidate-gene based biochemical studies can provide insight into causal regulatory mechanisms but do not effectively scale up to genome-wide coverage, due to their time consuming and laborious nature.
To address both challenges we introduced DIGGIT, a novel algorithm for the network-based elucidation of genetic determinants of human disease, resulting in dramatic reduction of testable hypotheses and availability of regulatory clues to guide mechanistic validation. The key algorithm’s requirement is a large repertoire of sample-matched gene expression and genetic variant profiles. As such, it is directly applicable to many tumor contexts and to an increasing number of germline diseases and traits.
The specific genetic etiology of most diseases is highly heterogeneous and thus largely patient-specific. Yet, we hypothesize that diverse alteration patterns induce common aberrant signals, converging on regulatory modules and associated MR proteins that represent key regulatory bottlenecks, whose dysregulation is both necessary and sufficient for disease initiation/progression. The existence and role of MR proteins and modules representing regulatory bottlenecks has been demonstrated in a variety of tumor contexts (Aytes et al., 2014a; Carro et al., 2010; Chudnovsky et al., 2014; Compagno et al., 2009; De Keersmaecker et al., 2010; Della Gatta et al., 2012; Lefebvre et al., 2010; Lim et al., 2009; Piovan et al., 2013; Zhao et al., 2009). Once identified, however, it is reasonable to assume that driver genetic events must be harbored either by these MRs or by their upstream pathways.
The mesenchymal subtype of GBM, representative of poor prognosis, provides an ideal context to test this rationale, as its established genetic determinants account for <25% of the patients. Starting from previously established MES-GBM MRs (Carro et al., 2010), DIGGIT identified C/EBPδ amplifications and KLHL9 deletions as novel, causal determinants of aberrant MES-GBM MR activity. We confirmed KLHL9 deletions in an independent cohort and showed that this protein is necessary for Cul3-ligase mediated ubiquitylation and proteasomal degradation of established MES-GBM MRs, C/EBPβ and C/EBPδ. Interestingly, only one MES-MRs (C/EBPδ) harbored driver alterations, suggesting that typical MARINa-inferred MRs represent non-oncogene dependencies of cancer cells (Luo et al., 2009; Schreiber et al., 2010), as also confirmed by additional studies (Aytes et al., 2014a; Carro et al., 2010; Chudnovsky et al., 2014; Compagno et al., 2009; Lim et al., 2009; Piovan et al., 2013; Zhao et al., 2009).
Initial evidence supporting the existence of regulatory bottlenecks that integrate aberrant signals from multiple mutations to implement a common disease phenotype, first emerged in earlier studies of Nf-κB as non-oncogene dependency in diffuse large B cell lymphoma. Mutations in several BCR pathway genes (e.g., TNFAIP3, CARD11, MYD88, etc.) elicited dependency on Nf-κB, even though its subunits were not mutated (Compagno et al., 2009; Davis et al., 2001). More recent examples of MARINa-inferred non-oncogene dependencies include AKT1 as a MR of glucocorticoid resistance in TALL, downstream of PTEN and PI3K mutations (Piovan et al., 2013) and FOXM1 and CENPF as synergistic MRs of aggressive prostate cancer (Aytes et al., 2014a), downstream of several genetic and epigenetic alterations, currently undergoing experimental validation. Thus, while regulatory bottlenecks may not represent a universal mechanism in cancer, when present, they can substantially contribute to identification of driver alterations. Additionally, canalization of aberrant signals from genetic events in upstream pathways is not necessarily restricted to cancer. Indeed, we showed that DIGGIT could be successfully applied to elucidating genetic determinants of Alzheimer’s disease risk. Specifically, to show that the algorithm can be applied to multiple disease contexts driven by either somatic alterations or germline variants, we showed that DIGGIT could successfully identify 19 established CNV drivers of breast ductal adenocarcinoma and 3 established risk alleles for Alzheimer’s disease, as well as several novel, high-probability alterations and variants that deserve further experimental testing. Critically, the vast majority of these events could not be identified by GWAS.
The ability to interrogate de novo reverse-engineered networks upstream of established functional regulators has several implications. First, it forgoes the need to evaluate each locus in the genome as an equivalent candidate driver, which incurs a statistical cost that greatly reduces the power of current GWAS methods. This is especially critical when multiple low-penetrance or low-frequency events converge on the same functional regulator, or when genetic alterations may have epistatic/synergistic effects. For instance, the dramatic reduction in candidate driver alterations afforded by DIGGIT allowed efficient use of conditional association methods to further distinguish driver from passenger alterations and to discover candidate co-dependent events, such as independent events in C/EBPδ and NF1. Second, discovery of genetic drivers upstream of MRs previously established as therapeutic targets are likely to provide valuable genetic biomarkers for targeted therapeutic intervention. Finally, MR-based discovery of genetic alterations may help identify alterations that are either not focal (e.g., in large amplicons) or that are masked by close proximity to well-established oncogenes and tumor suppressors that would likely prevent their identification, as was the case for the homozygous KLHL9 deletions.
With respect to the specific finding in GBM, our results implicate KLHL9 deletions as mechanistic MES-GBM drivers, by abrogating ubiquitin-dependent proteasomal degradation of two MR proteins, C\EBPβ and C/EBPδ, and by increasing levels of phosphorylated-STAT3. At least two other genes coding for E3 ubiquitin ligases were reported to undergo loss-of-function genetic alterations in GBM. The first one codes for FBW7, an F-box protein of the SCF complex that is mutated in several forms of human cancer including GBM (Thompson et al., 2007). FBW7 mutations stabilize the oncoprotein substrates CCNE1, MYC and NOTCH1 (Nakayama and Nakayama, 2006). The second one, encoding an E3 ligase that is deleted in GBM, is HUWE1, a Hect-domain ubiquitin ligase that triggers initiation of differentiation and loss of self-renewal in the developing brain by targeting the MYCN oncoprotein for ubiquitin-mediated degradation (Zhao et al., 2009). Our findings indicate that loss-of-function events targeting E3 ubiquitin ligases such as KLHL9 in human cancer not only promote aberrant stabilization of classical oncoproteins, but can also trigger accumulation of key transcription factors responsible for tumor lineage reprogramming.
Finally, the ability to identify both cancer bottlenecks and their candidate upstream functional regulators depends critically on the availability of sample-matched gene-expression/genetic-variant profiles and accurate and comprehensive repertoires of cell-context specific molecular interactions (interactomes). While the assembly of integrated transcriptional, post-transcriptional, and post-translational interactomes is still in its infancy, the genome-wide integration of experimental and computational approaches is already starting to provide biologically relevant models. This further suggests that network-based methodologies may be increasingly valuable entries in the toolkit for the identification and mechanistic elucidation of genetic determinants of physiological and disease-related phenotypes, using ever-increasing volumes of genomic data.
EXPERIMENTAL PROCEDURES
This section includes short summaries of the experimental and computational methods used in this manuscript. Full method description and utilization details are provided in the Supplemental Information, including parameters and input/output data for the use of published algorithms (ARACNe, MINDy, ssMARINA). A software package (DIGGIT), with all relevant functions discussed in this section, as well as a “sweave” file to reproduce the results of the analysis are available at the lab-software website (http://wiki.c2b2.columbia.edu/califanolab/index.php/Software).
Inference of Functional CNV Genes (F-CNVG)
Each F-CNVG (FCi) is assessed based on the statistical significance of the Mutual Information (MI), IF[CNVi;mRNAi], where mRNAi represents its expression and CNVi its copy number across a sample-matched cohort. Thresholds for CNV calling are assessed from the distribution in control samples. The DIGGIT package includes the .fCNV function to measure MI using a fixed-bandwidth Gaussian Kernel estimator and false discovery rate (FDR), by gene-shuffling, to assess statistical significance. Low-frequency alterations, occurring in fewer than 7 samples (thus not appropriate for MI analysis) are tested for differential expression in altered vs. WT samples via T-test or Z-test.
MINDy and aQTL-analysis
MINDy
Use of the algorithm to generate a list of candidate MR modulators is fully discussed in the Supplemental Information and in (Wang et al., 2009). aQTL: For each F-CNVG (FC), the .aQTL function is used to compute MIaQTL[CNVi;MRj], i.e., the MI between its copy number (CNVi) and the ssMARINa-inferred activity of each MES-MR protein (MRj) to assess the aQTL p-value. MES-GBM MRs included: C/EBPβ, C/EBPδ, STAT3, FOSL2, BHLHB2, and RUNX1, see (Carro et al., 2010). The aQTL and MINDy p-values are integrated by Fisher’s method, implemented in the .integrate function.
F-CNVG Clustering and Conditional Association (CA)
Clustering
The .cluster function is used to tests each 𝓕-CNVG pair for same-sample co-occurrence by pairwise FET; amplifications and deletions are tested separately. Clusters include all gene pairs with statistically significant association.
Conditional Association
For each 𝓕-CNVG pair (FCi,FCi) in a cluster, the .ca function is used to test whether FCi is no longer significantly associated with the target phenotype (i.e., MES-GBM) when samples with FCj alterations are removed. Each candidate FCi is given a score, SCA by counting the number of 𝓕-CNVGs in the cluster whose association with the phenotype is abrogated when conditioning on FCi, minus the number of 𝓕-CNVGs for which FCi’s association is abrogated. E.g., KLHL9 abrogated MES-GBM association of 14 out of 14 other 𝓕-CNVGs in cluster 2. Conversely, KLHL9’s association was never abrogated by these 𝓕-CNVGs (SCA = 14 – 0 = 14)
Classification of TCGA GBM tumors
We classified all TCGA GBM tumor samples into MES, PN, or PRO, per the original definition (Phillips et al., 2006). The three genes with the highest variance across the cohort in this work were used for classification including: SERPINE1, CHI3L1, TIMP1 (MES); BCAN, OLIG2, KLRC3 (PN); and HMMR, TOP2A, PCNA (PRO). TCGA samples were classified based on these markers, by unsupervised k-means clustering (available in the Bioconductor R package).
Orthotopic xenograft mouse models
The orthotopic intracranial xenograft model was conducted under a protocol approved by the Translational Drug Development (TD2) Institutional Animal Care and Use Committee. Female nude mice (Age 4–5 week) were randomized into groups of 7 that received either HF2354 cells transduced with a control vector or a vector expressing KLHL9. At 96h following lentivirus-mediated transduction, cells were injected into the right basal ganglia using a small animal stereotaxic frame (TSE Systems). Mice were weighed daily and observed for the onset of neurologic symptoms or distress. When the first mouse from either study cohort was euthanized due to neurological symptoms or distress, all other mice in both cohorts were euthanized and formalin-perfused brains were harvested and embedded in paraffin. Immunohistochemistry and H&E staining were performed and a board certified pathologist scored the sections: 0, no tumor; 1, small tumor or presence of dispersed tumor cells in any tissue section; 2, medium size tumor; 3, large tumor occupying major areas of the hemisphere.
Supplementary Material
ACKNOWLEDGEMENTS
This work was supported by NCI CTD2 network 1RC2CA148308–01 (A.C.), National Centers for Biomedical Computing NIH Roadmap Initiative U54CA121852 (A.C., M.J.A), R01 NS061776–05 (A.C.), P01CA154293 (M.M.S.), Kirschstein NRSA training grant T32GM082797 (J.C.C.), CTDD grant 5U01CA16842603 (G.E.R.), W81XWH1210022 (A.I.), a fellowship from the Urology Care Foundation (F.T.), and NIH/NCI P50CA127001 (K.A., K.L.D.).
Footnotes
This is a PDF file of an unedited manuscript that has been accepted for publication. As a service to our customers we are providing this early version of the manuscript. The manuscript will undergo copyediting, typesetting, and review of the resulting proof before it is published in its final citable form. Please note that during the production process errors may be discovered which could affect the content, and all legal disclaimers that apply to the journal pertain.
AUTHOR CONTRIBUTIONS
A.C. conceived the overall framework for MR based identification of driver alterations, the computational methods, and wrote the manuscript. J.C.C. helped conceive, design, and implement all computational methods. J.C.C. performed the cell-based assays under M.J.A.’s guidance, and assisted with writing and editing. M.J.A. analyzed the Affymetrix gene expression data and contributed to discussions and manuscript editing. G.R. performed additional experiments and provided revisions. A.I. helped perform genomic qPCR assays. F.T. performed cell cycle FACS analyses, western blots, and IF imaging under the guidance of M.M.S. H.D. and M.B. contributed the PDX model and performed the orthotopic tumor growth assays. K.L.D. isolated DNA from the MD Anderson human GBM cohort samples, under the supervision of K.A.
REFERENCES
- Aytes A, Mitrofanova A, Lefebvre C, Alvarez MJ, Castillo-Martin M, Zheng T, Eastham JA, Gopalan A, Pienta K, Shen MM, et al. Cross-species analysis of genome-wide regulatory networks identifies a synergistic interaction between FOXM1 and CENPF that drives prostate cancer malignancy. Cancer Cell. 2014a;25:638–651. doi: 10.1016/j.ccr.2014.03.017. [DOI] [PMC free article] [PubMed] [Google Scholar]
- Aytes A, Mitrofanova A, Lefebvre C, Alvarez MJ, Castillo-Martin M, Zheng T, Eastham JA, Gopalan A, Pienta KJ, Shen MM, et al. Cross-species regulatory network analysis identifies a synergistic interaction between FOXM1 and CENPF that drives prostate cancer malignancy. Cancer Cell. 2014b;25:638–651. doi: 10.1016/j.ccr.2014.03.017. [DOI] [PMC free article] [PubMed] [Google Scholar]
- Basso K, Margolin AA, Stolovitzky G, Klein U, Dalla-Favera R, Califano A. Reverse engineering of regulatory networks in human B cells. Nat Genet. 2005;37:382–390. doi: 10.1038/ng1532. [DOI] [PubMed] [Google Scholar]
- Brennan CW, Verhaak RG, McKenna A, Campos B, Noushmehr H, Salama SR, Zheng S, Chakravarty D, Sanborn JZ, Berman SH, et al. The somatic genomic landscape of glioblastoma. Cell. 2013;155:462–477. doi: 10.1016/j.cell.2013.09.034. [DOI] [PMC free article] [PubMed] [Google Scholar]
- Califano A, Butte AJ, Friend S, Ideker T, Schadt E. Leveraging models of cell regulation and GWAS data in integrative network-based association studies. Nat Genet. 2012;44:841–847. doi: 10.1038/ng.2355. [DOI] [PMC free article] [PubMed] [Google Scholar]
- Carro MS, Lim WK, Alvarez MJ, Bollo RJ, Zhao X, Snyder EY, Sulman EP, Anne SL, Doetsch F, Colman H, et al. The transcriptional network for mesenchymal transformation of brain tumours. Nature. 2010;463:318–325. doi: 10.1038/nature08712. [DOI] [PMC free article] [PubMed] [Google Scholar]
- Chudnovsky Y, Kim D, Zheng S, Whyte WA, Bansal M, Bray MA, Gopal S, Theisen MA, Bilodeau S, Thiru P, et al. ZFHX4 interacts with the NuRD core member CHD4 and regulates the glioblastoma tumor-initiating cell state. Cell Rep. 2014;6:313–324. doi: 10.1016/j.celrep.2013.12.032. [DOI] [PMC free article] [PubMed] [Google Scholar]
- Compagno M, Lim WK, Grunn A, Nandula SV, Brahmachary M, Shen Q, Bertoni F, Ponzoni M, Scandurra M, Califano A, et al. Mutations of multiple genes cause deregulation of NF-kappaB in diffuse large B-cell lymphoma. Nature. 2009;459:717–721. doi: 10.1038/nature07968. [DOI] [PMC free article] [PubMed] [Google Scholar]
- Danussi C, Akavia UD, Niola F, Jovic A, Lasorella A, Pe'er D, Iavarone A. RHPN2 drives mesenchymal transformation in malignant glioma by triggering RhoA activation. Cancer Res. 2013;73:5140–5150. doi: 10.1158/0008-5472.CAN-13-1168-T. [DOI] [PMC free article] [PubMed] [Google Scholar]
- Davis RE, Brown KD, Siebenlist U, Staudt LM. Constitutive nuclear factor kappaB activity is required for survival of activated B cell-like diffuse large B cell lymphoma cells. J Exp Med. 2001;194:1861–1874. doi: 10.1084/jem.194.12.1861. [DOI] [PMC free article] [PubMed] [Google Scholar]
- De Keersmaecker K, Real PJ, Gatta GD, Palomero T, Sulis ML, Tosello V, Van Vlierberghe P, Barnes K, Castillo M, Sole X, et al. The TLX1 oncogene drives aneuploidy in T cell transformation. Nat Med. 2010;16:1321–1327. doi: 10.1038/nm.2246. [DOI] [PMC free article] [PubMed] [Google Scholar]
- Della Gatta G, Palomero T, Perez-Garcia A, Ambesi-Impiombato A, Bansal M, Carpenter ZW, De Keersmaecker K, Sole X, Xu L, Paietta E, et al. Reverse engineering of TLX oncogenic transcriptional networks identifies RUNX1 as tumor suppressor in T-ALL. Nat Med. 2012;18:436–440. doi: 10.1038/nm.2610. [DOI] [PMC free article] [PubMed] [Google Scholar]
- Frattini V, Trifonov V, Chan JM, Castano A, Lia M, Abate F, Keir ST, Ji AX, Zoppoli P, Niola F, et al. The integrated landscape of driver genomic alterations in glioblastoma. Nat Genet. 2013;45:1141–1149. doi: 10.1038/ng.2734. [DOI] [PMC free article] [PubMed] [Google Scholar]
- Lawrence MS, Stojanov P, Polak P, Kryukov GV, Cibulskis K, Sivachenko A, Carter SL, Stewart C, Mermel CH, Roberts SA, et al. Mutational heterogeneity in cancer and the search for new cancer-associated genes. Nature. 2013;499:214–218. doi: 10.1038/nature12213. [DOI] [PMC free article] [PubMed] [Google Scholar]
- Lefebvre C, Rajbhandari P, Alvarez MJ, Bandaru P, Lim WK, Sato M, Wang K, Sumazin P, Kustagi M, Bisikirska BC, et al. A human B-cell interactome identifies MYB and FOXM1 as master regulators of proliferation in germinal centers. Mol Syst Biol. 2010;6:377. doi: 10.1038/msb.2010.31. [DOI] [PMC free article] [PubMed] [Google Scholar]
- Lim WK, Lyashenko E, Califano A. Master regulators used as breast cancer metastasis classifier. Pac Symp Biocomput. 2009:504–515. [PMC free article] [PubMed] [Google Scholar]
- Liu CC, Kanekiyo T, Xu H, Bu G. Apolipoprotein E and Alzheimer disease: risk, mechanisms and therapy. Nature reviews Neurology. 2013;9:106–118. doi: 10.1038/nrneurol.2012.263. [DOI] [PMC free article] [PubMed] [Google Scholar]
- Luo J, Solimini NL, Elledge SJ. Principles of cancer therapy: oncogene and non-oncogene addiction. Cell. 2009;136:823–837. doi: 10.1016/j.cell.2009.02.024. [DOI] [PMC free article] [PubMed] [Google Scholar]
- Nakayama KI, Nakayama K. Ubiquitin ligases: cell-cycle control and cancer. Nat Rev Cancer. 2006;6:369–381. doi: 10.1038/nrc1881. [DOI] [PubMed] [Google Scholar]
- Ohgaki H, Kleihues P. Population-based studies on incidence, survival rates, and genetic alterations in astrocytic and oligodendroglial gliomas. J Neuropathol Exp Neurol. 2005;64:479–489. doi: 10.1093/jnen/64.6.479. [DOI] [PubMed] [Google Scholar]
- Phillips HS, Kharbanda S, Chen R, Forrest WF, Soriano RH, Wu TD, Misra A, Nigro JM, Colman H, Soroceanu L, et al. Molecular subclasses of high-grade glioma predict prognosis, delineate a pattern of disease progression, and resemble stages in neurogenesis. Cancer Cell. 2006;9:157–173. doi: 10.1016/j.ccr.2006.02.019. [DOI] [PubMed] [Google Scholar]
- Piovan E, Yu J, Tosello V, Herranz D, Ambesi-Impiombato A, Da Silva AC, Sanchez-Martin M, Perez-Garcia A, Rigo I, Castillo M, et al. Direct Reversal of Glucocorticoid Resistance by AKT Inhibition in Acute Lymphoblastic Leukemia. Cancer Cell. 2013;24:766–776. doi: 10.1016/j.ccr.2013.10.022. [DOI] [PMC free article] [PubMed] [Google Scholar]
- Rutka JT, Giblin JR, Dougherty DY, Liu HC, McCulloch JR, Bell CW, Stern RS, Wilson CB, Rosenblum ML. Establishment and characterization of five cell lines derived from human malignant gliomas. Acta Neuropathol. 1987;75:92–103. doi: 10.1007/BF00686798. [DOI] [PubMed] [Google Scholar]
- Schreiber SL, Shamji AF, Clemons PA, Hon C, Koehler AN, Munoz B, Palmer M, Stern AM, Wagner BK, Powers S, et al. Towards patient-based cancer therapeutics. Nat Biotechnol. 2010;28:904–906. doi: 10.1038/nbt0910-904. [DOI] [PMC free article] [PubMed] [Google Scholar]
- Subramanian A, Tamayo P, Mootha VK, Mukherjee S, Ebert BL, Gillette MA, Paulovich A, Pomeroy SL, Golub TR, Lander ES, et al. Gene set enrichment analysis: a knowledge-based approach for interpreting genome-wide expression profiles. Proc Natl Acad Sci U S A. 2005;102:15545–15550. doi: 10.1073/pnas.0506580102. [DOI] [PMC free article] [PubMed] [Google Scholar]
- Sumara I, Quadroni M, Frei C, Olma MH, Sumara G, Ricci R, Peter M. A Cul3-based E3 ligase removes Aurora B from mitotic chromosomes, regulating mitotic progression and completion of cytokinesis in human cells. Dev Cell. 2007;12:887–900. doi: 10.1016/j.devcel.2007.03.019. [DOI] [PubMed] [Google Scholar]
- Sumazin P, Yang X, Chiu HS, Chung WJ, Iyer A, Llobet-Navas D, Rajbhandari P, Bansal M, Guarnieri P, Silva J, et al. An Extensive MicroRNA-Mediated Network of RNA-RNA Interactions Regulates Established Oncogenic Pathways in Glioblastoma. Cell. 2011;147:307. doi: 10.1016/j.cell.2011.09.041. [DOI] [PMC free article] [PubMed] [Google Scholar]
- Sun L, Hui AM, Su Q, Vortmeyer A, Kotliarov Y, Pastorino S, Passaniti A, Menon J, Walling J, Bailey R, et al. Neuronal and glioma-derived stem cell factor induces angiogenesis within the brain. Cancer Cell. 2006;9:287–300. doi: 10.1016/j.ccr.2006.03.003. [DOI] [PubMed] [Google Scholar]
- Tamborero D, Lopez-Bigas N, Gonzalez-Perez A. Oncodrive-CIS: a method to reveal likely driver genes based on the impact of their copy number changes on expression. PLoS One. 2013;8:e55489. doi: 10.1371/journal.pone.0055489. [DOI] [PMC free article] [PubMed] [Google Scholar]
- TCGA-Consortium. Comprehensive genomic characterization defines human glioblastoma genes and core pathways. Nature. 2008;455:1061–1068. doi: 10.1038/nature07385. [DOI] [PMC free article] [PubMed] [Google Scholar]
- TCGA-Consortium. Comprehensive molecular portraits of human breast tumours. Nature. 2012;490:61–70. doi: 10.1038/nature11412. [DOI] [PMC free article] [PubMed] [Google Scholar]
- Thiery JP. Epithelial-mesenchymal transitions in tumour progression. Nat Rev Cancer. 2002;2:442–454. doi: 10.1038/nrc822. [DOI] [PubMed] [Google Scholar]
- Thompson BJ, Buonamici S, Sulis ML, Palomero T, Vilimas T, Basso G, Ferrando A, Aifantis I. The SCFFBW7 ubiquitin ligase complex as a tumor suppressor in T cell leukemia. J Exp Med. 2007;204:1825–1835. doi: 10.1084/jem.20070872. [DOI] [PMC free article] [PubMed] [Google Scholar]
- Verhaak RG, Hoadley KA, Purdom E, Wang V, Qi Y, Wilkerson MD, Miller CR, Ding L, Golub T, Mesirov JP, et al. Integrated genomic analysis identifies clinically relevant subtypes of glioblastoma characterized by abnormalities in PDGFRA, IDH1, EGFR, and NF1. Cancer Cell. 2010;17:98–110. doi: 10.1016/j.ccr.2009.12.020. [DOI] [PMC free article] [PubMed] [Google Scholar]
- Wang K, Saito M, Bisikirska BC, Alvarez MJ, Lim WK, Rajbhandari P, Shen Q, Nemenman I, Basso K, Margolin AA, et al. Genome-wide identification of post-translational modulators of transcription factor activity in human B cells. Nat Biotechnol. 2009;27:829–839. doi: 10.1038/nbt.1563. [DOI] [PMC free article] [PubMed] [Google Scholar]
- Xu L, Wei Y, Reboul J, Vaglio P, Shin TH, Vidal M, Elledge SJ, Harper JW. BTB proteins are substrate-specific adaptors in an SCF-like modular ubiquitin ligase containing CUL-3. Nature. 2003;425:316–321. doi: 10.1038/nature01985. [DOI] [PubMed] [Google Scholar]
- Yang X, Deignan JL, Qi H, Zhu J, Qian S, Zhong J, Torosyan G, Majid S, Falkard B, Kleinhanz RR, et al. Validation of candidate causal genes for obesity that affect shared metabolic pathways and networks. Nat Genet. 2009 doi: 10.1038/ng.325. [DOI] [PMC free article] [PubMed] [Google Scholar]
- Zhang B, Gaiteri C, Bodea LG, Wang Z, McElwee J, Podtelezhnikov AA, Zhang C, Xie T, Tran L, Dobrin R, et al. Integrated systems approach identifies genetic nodes and networks in late-onset Alzheimer's disease. Cell. 2013;153:707–720. doi: 10.1016/j.cell.2013.03.030. [DOI] [PMC free article] [PubMed] [Google Scholar]
- Zhao X, D DA, Lim WK, Brahmachary M, Carro MS, Ludwig T, Cardo CC, Guillemot F, Aldape K, Califano A, et al. The N-Myc-DLL3 cascade is suppressed by the ubiquitin ligase Huwe1 to inhibit proliferation and promote neurogenesis in the developing brain. Dev Cell. 2009;17:210–221. doi: 10.1016/j.devcel.2009.07.009. [DOI] [PMC free article] [PubMed] [Google Scholar]
Associated Data
This section collects any data citations, data availability statements, or supplementary materials included in this article.