Abstract
Reducing the amount of information stored in diffusion MRI (dMRI) data to a set of meaningful and representative scalar values is a goal of much interest in medical imaging. Such features can have far reaching applications in segmentation, registration, and statistical characterization of regions of interest in the brain, as in comparing features between control and diseased patients. Currently, however, the number of biologically relevant features in dMRI is very limited. Moreover, existing features discard much of the information inherent in dMRI and embody several theoretical shortcomings. This paper proposes a new family of rotation invariant scalar features for dMRI based on the spherical harmonic (SH) representation of high angular resolution diffusion images (HARDI). These features describe the shape of the orientation distribution function extracted from HARDI data and are applicable to any reconstruction method that represents HARDI signals in terms of an SH basis. We further illustrate their significance in white matter characterization of synthetic, phantom and real HARDI brain datasets.
Keywords: rotation invariance, spherical functions, feature extraction, diffusion magnetic resonance imaging, orientation distribution functions
1 Introduction
Diffusion magnetic resonance imaging (dMRI) is a non-invasive imaging technique that can be used to characterize the white matter (WM) architecture of the brain in normal and diseased patients [1]. In particular, extracting scalar features (or biomarkers) from dMRI data has become an integral part of group/ longitudinal studies of WM changes in brain connectivity related to development, neurodegeneration, or disease [2]. Since diffusion tensor imaging (DTI) is currently the de facto standard in clinical neuroimaging, the vast majority of the studies assessing WM connectivity and its impairment employ features derived from DTI, e.g., mean diffusivity (MD), fractional anisotropy (FA), relative anisotropy (RA), linear/planar/spherical anisotropies (LA/PA/SA) [3, 4]. However, DTI is limited by its inability to resolve intra-voxel complexities like fiber crossings. This causes DTI-based features to severely lack specificity [5]. Hence, there is a strong need for deriving new scalar measures for characterizing the WM integrity, especially from more generic and versatile diffusion representations such as higher-order tensors [6, 7] and orientation distribution functions (ODFs) [8–10], which describe the tissue microstructure with greater accuracy and detail.
Few scalar features have been derived from the aforementioned representations [11], with the most popular ones being the fractional multifiber index (FMI) [12], generalized anisotropy (GA) [13] and generalized fractional anisotropy (GFA) [8]. Recently, [14] used a polynomial approach to extract geometric characteristics from spherical functions (e.g., ODFs) and proposed new scalar measures such as peak fractional anisotropy (PFA) and Total-PFA. Furthermore, [5] presented the concept of the integrity basis for 2nd and 4th order tensors, as well as two standard bases called the basic and principal invariants, expanding the works of [15] and [16] on the principal invariants of the 4th order tensor.
In this paper we propose a new framework for extracting a large set of rotation invariant features from the spherical harmonic (SH) representation of HARDI signals and ODFs. The advantage of this framework is its generality. In fact, we derive a family of rotation invariant features that can be extracted from any spherical function written in an SH basis. Numerous HARDI reconstruction methods [11] such as Spherical Deconvolution (SD), Diffusion Orientation Transform (DOT), Spherical Polar Fourier Imaging (SPFI), Bessel Fourier Orientation Reconstruction (BFOR) model spherical functions like the Ensemble Average Propagator (EAP), Fiber Orientation Distribution (FOD), and Apparent Diffusion Coefficient (ADC) using an SH basis. Our framework can be applied to any of these spherical functions to extract a new set of scalar values. In addition, any continuous function of these scalar values can be used to generate additional features that can be significant for a specific experiment or application.
The remainder of the paper is organized as follows. Section 2 lays the theoretical groundwork for spherical functions and provides the derivation of a new set of rotation invariant features. Section 3 applies our theory to HARDI signals and ODFs and Section 4 evaluates our features on synthetic, phantom and real data.
2 Rotation Invariant Features for Spherical Functions
2.1 Spherical Harmonic Representation of Spherical Functions
Our framework for extracting features from HARDI signals is based on a theorem first proved for functions represented by a Fourier basis [17]. This theorem was recently extended to continuous spherical functions represented in an SH basis [18, 19]. The (standard) SH basis are complex-valued functions defined as
| (1) |
where
is the associated Legendre polynomial of degree l and order m, θ ∈ [0, π], and ϕ ∈ [0, 2π). For a real continuous spherical function f :
 → ℝ, we can write
, where f̂l,m are the SH coefficients that parametrize f.
We can approximate f using a finite SH basis representation of degree up to L, giving us (L + 1)2 basis elements. Given the vector of SH coefficients f̂ = [f̂l,m], [19] constructed an (L + 1)2 × (L + 1)2 matrix TL, which is an analogue to the Toeplitz matrix of the Fourier representation. The matrix TL is constructed as follows. Let be a spherical function and let ĝ be its vector of SH coefficients of length (L + 1)2. Then [19] shows that the coefficients of the product of two spherical functions, f(u)g(u), can be obtained as
| (2) |
Here, TL(f) is a matrix whose rows and columns are indexed by the pair (l1m1, l2m2) = (l1(l1 + 1) + m1, l2(l2 + 1) + m2), where li = 0, 1, 2, …, L and −li ≤ mi ≤ li, for i = 1, 2. The entry of TL(f) at index (l1m1, l2m2) is defined as
| (3) |
where G(l1, l2, l3; m1, m2, m3) is a real constant Gaunt Coefficient (See [19] Appendix A). As an important note, TL(f) is not Toeplitz. However its structure embodies many of the same properties of the Toeplitz form for the Fourier case.
We can rewrite TL as a linear combination of matrices of Gaunt Coefficients
| (4) |
where Glm(l1(l1 + 1) + m1, l2(l2 + 1) + m2) = G(ll2l1; mm2m1). Note that the Gaunt coefficient matrices Glm are sparse since G(ll2l1;mm2m1) is zero unless m = m1− m2, so this formulation is more computationally efficient and intuitive.
With the above notation, we have the following extension of the Eigenvalue Distribution Theorem to continuous spherical functions [17, 18], which asserts that the eigenvalues of TL(f) are distributed as the function f itself.
Theorem 1 (Eigenvalue Distribution Theorem on
 )
)
Let f(u) be a continuous spherical function and let TL(f) be the Toeplitz-like matrix defined in (4). Furthermore let F be any continuous function defined on the range of f. Then
| (5) |
where
are the real eigen values of TL with
and dσ(u) is the area element in
 .
.
2.2 Spherical Harmonic Coefficients of Rotated Spherical Functions
Let R = R(α, β, γ) = Rz(γ)Ry(β)Rz(α) be an element of the rotation group SO(3), parameterized by the Euler angles α, γ ∈ [0, 2π), β ∈ [0, π], where Rz and Ry represent rotations about the z and y axes respectively. To understand the effect of R on the SH coefficients f̂lk of a spherical function f, let us define
| (6) |
where are the generalizations of the associated Legrendre polynomials, computed by a recurrence relation of Jacobi polynomials. As shown in [20], the SH coefficient of the rotated function fR (u) = f(Ru) is a linear combination of the SH coefficients f̂lk, for k = −l, …, l, of the function f, which is given by
| (7) |
We can see that the rotation of f̂ is localized to each set of coefficients of degree l. Therefore we can write the (L + 1)2 × (L + 1)2 matrix A(R) as a block diagonal matrix where each block is of the form with w(k, l) = k+l+1, l = 0, 2, … L and |k| ≤ l. Furthermore, it is shown in [21] that each block Al is unitary, i.e., (Al)⊤Al = I(2l+1)×(2l+1), hence the entire block matrix A(R) is also unitary. Rewriting equation (7) in matrix form leads to
| (8) |
In other words, a 3D rotation of the domain of the spherical function f by R induces an (L + 1)2-dimensional rotation of its SH coefficients by A⊤(R).
2.3 Invariance of the Eigenvalues of TL under a Rotation on

Let and be two continuous spherical functions with vectors of SH coefficients f̂ = [f̂lm] and ĝ = [ĝlm], respectively. Using the definition of TL in (2), [19] shows that
| (9) |
Let ĝR> = A⊤(R⊤)ĝ be the SH coefficient vector of gR> (u) = g(R⊤u) and let be the SH coefficient vector of gR (u) = g(Ru). We have that
| (10) |
where u′ ≐ = R⊤u ⇒ dσ(u′) = |R⊤|dσ(u) and |R⊤| = 1. Since in addition , we have proved the following important relation:
| (11) |
This implies that the eigenvalues of TL(f) are equal to the eigenvalues of TL(fR). Furthermore, using the spectral decomposition of TL(f) = UΛU* = A⊤VΛV*A we have U* = V*A, hence A = VU*, where U and V are the sorted matrices of eigenvectors for TL(f) and TL(fR), respectively, and Λ is the diagonal matrix of sorted eigenvalues. This result is equivalent to the following statement:
For a continuous spherical function f of degree L, the eigenvalues of TL(f) are invariant under rotation of the domain of f on
 .
.
Notice that this result holds only for spherical functions of degree L. In the case HARDI reconstruction, where the signals are approximated by a spherical function of degree L, the eigenvalues of TL will be approximately equal to the eigenvalues of TL after rotation. We will discuss this in more detail in Section 3.2.
3 Invariant Features for HARDI Signals and ODFs
In Section 2 we developed a framework for extracting a large set of rotation invariant scalar features from any continuous spherical function. In this section, we apply this framework to the case of HARDI signals and ODFs.
3.1 Spherical Harmonic Representation of HARDI Signals and ODFs
Let S0 be the baseline MRI signal and let S(θ, ϕ) be the continuous HARDI signal along (θ, ϕ). Following [10], we define the continuous ODF, p, as:
| (12) |
where FRT is the Funk-Radon transform,
is the Laplace-Beltrami operator on
 , ϑ ∈ [0, π] and φ ∈ [0, 2π). Since the HARDI signals are real and symmetric, we will use the modified SH basis to represent ODFs. This basis is defined as:
| (13) |
where Re(·) and Im(·) are the real and imaginary parts, respectively, and for l = 0, 2, 4, … and − l ≤ m ≤ l. For degree up to L, there are basis elements. It is important to note that when constructing our TL matrices we must first convert to the equivalent complex standard basis. To express p in terms of the modified SH basis, let
| (14) |
Since , and FRT (Yj(θ, ϕ)) = 2πPlj(0)Yj(ϑ, φ), where Plj (0) is the Legendre polynomial of degree lj at 0, we have
| (15) |
where and for j > 1.
We can see that HARDI data gives us two particular spherical functions that encode biological information of dMRI: the HARDI signal, s, and the ODF, p. In the above formulation, both of these functions are continuous. In practice, the HARDI signals are measured at a finite number, G, of fixed gradient directions , usually in the range of 30 to 200 points, and p is estimated from s using another set of M discrete points on the sphere, . Using discrete approximations of s and p, with an R-dimensional SH basis of degree L, we have
| (16) |
where , B ∈ ℝG×R is a matrix whose i-th row is Bi = [Y1(θi, ϕi), …, YR(θi, ϕi)], and c = [c1, c2, …, cR]⊤ ∈ ℝR. Then
| (17) |
where 1 is the M × 1 vector of ones, C is the M × R SH basis matrix whose i-th row is Ci = [Y1(ϑi, φi), …, YR(ϑi, φi)], L is the R × R diagonal matrix of Laplace-Beltrami eigenvalues with Ljj = − lj(lj + 1), P is the R × R diagonal Funk-Radon transform matrix with Pjj = 2πPl<sub>j</sub>(0) and c̃ is defined as in (15).
3.2 Approximate Rotation Invariance Using a Finite SH Basis
In Section 2.3 we showed that, for a continuous spherical function f of degree L, the eigenvalues of the matrix TL(f) are invariant with respect to a rotation of the domain of f. In Section 3.1 we showed how to approximate HARDI signals and their ODFs, s and p, respectively, by continuous spherical functions of degree L. Notice, however, that the eigenvalues of TL(s) and TL(p) need not be invariant with respect to rotations of the raw HARDI signals. This is because the raw HARDI signals may not admit an expansion of degree L in terms of the SH basis.
In practice, however, we expect the HARDI signals to be well approximated by low-degree models, hence the eigenvalues of TL(s) and TL(p) should be approximately invariant with respect to rotations for large enough L. To verify this, we used the multi-tensor model in [22] to generate three noiseless HARDI signals of 1-, 2-, and 3-fiber ODFs. We applied two different rotations to each one of these HARDI signals and approximated the resulting nine HARDI signals by an SH expansion of degree L = 4. The two plots in column 1 of Fig. 1 show the 25 eigenvalues of TL(s) and TL(p), respectively, in increasing order. Notice that the three curves of eigenvalues corresponding to 1-, 2-, or 3-fibers align almost perfectly, showing that the eigenvalues of TL are approximately invariant to rotations in spite of the finite approximation by an SH basis of degree L = 4.
Fig. 1.
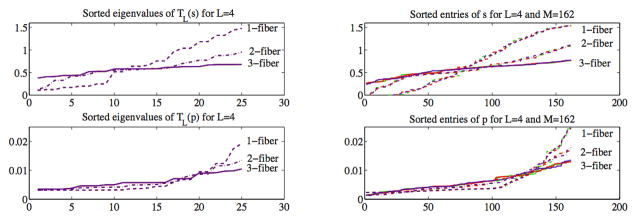
Comparing the rotational invariance of the eigenvalues (first column) to that of the spherical function values (second column) using a discretization of the continuous function. The first row is the HARDI signal and the second row is the ODF. The plots show the sorted eigenvalues and sorted function values for nine different signals and ODFs, obtained by rotating three different signals with 1, 2, and 3 fibers, respectively. Observe the almost perfect overlap of the curves corresponding to 1-, 2-, or 3-fiber ODFs in the first column and the misalignment of the curves in the second column.
Now, since the eigenvalues of TL give only approximately invariant features due to the use of a finite degree L, we might wonder why not using other approximately invariant features instead. For example, the maximum and minimum values of s are invariant to rotations. More generally, if we look at the entries of s, which correspond to samples of s at different directions on a fixed grid on
 , then the sorted entries of s should be approximately invariant to rotations. To verify this, we plot in column 2 of Fig. 1 the sorted entries of s and p (in increasing order) for the same nine HARDI signals described before. Notice that the three curves of 1-, 2-, or 3-fibers do not align as well as the corresponding curves in column 1. This shows that the sorted discrete values of s and p are not as invariant to rotations as are the eigenvalues of TL(s) and TL(p), respectively.
Given the (approximate) invariance of the eigenvalues of TL(s) and TL(p), we can use Theorem 1 to generate a large number of rotation invariant features for describing HARDI signals. For example, we can use the minimum and maximum eigenvalues, λmin and λmax, respectively, which approximate the minimum and maximum of the spherical function. We can also use the range of the eigenvalues, λmax –λmin, as another feature. In addition, the variance of the eigenvalues will be closely related to the variance of the spherical function values and can be used as another feature. We also considered features such as the mean, median and mode of the eigenvalues as well as the determinant, trace, 2-norm and Frobenius norm of TL. But the beauty of this framework is that one can use any continuous function of the eigenvalues, which provides a very rich set of features for a particular application. Furthermore, the choice of which spherical function to use (s, p or another) is also up to the user and can be determined based on the application or experiment. For different experiments (Section 4) we use the eigenvalues associated to both the HARDI signal, s and the ODF p. Furthermore, we can even extend L by zeropadding the coefficient vector of our spherical function using the method in [23] to extract a larger number of features, of which the values such as minimum, maximum, range and variance of eigenvalues will better approximate the distribution of the function values.
4 Validation
Synthetic Data
We first test the proposed HARDI features on synthetic data of isotropic, 1-, 2-, and 3-fiber ODFs generated using the multi-tensor model in [22]. For the synthetic ODF field in Fig. 2(a) we plot the variance and range of the eigenvalues of TL(s) in Fig. 2(b). Observe from the constant height of the bars in each color of the bar graph that these values are rotation invariant, as predicted. Observe also from the distribution of the bar graphs in Fig. 2(b) that these features give information about the shape of each ODF. In particular, notice that the maximum eigenvalue of the 1-fiber ODFs is greater than that for the 2- and 3-fiber ODFs. This is also apparent from Fig. 1. We can also see that the minimum eigenvalue of the 3-fiber ODFs is greater than that of the 2-fiber and 1-fiber ODFs, also as seen in Fig. 1. When interpreting the results for ODFs, we can additionally use the fact that p is a probability distribution. Thus, if the variances of each peak in our ODF are the same, as was the case in our synthetic experiments, we know that the maximum of a 1-fiber ODF will be greater than that for the 2- and 3-fiber ODFs since the area under the curve must sum to 1. This information is also encoded in the range of the eigenvalues. Furthermore, the variance of the eigenvalues indicate how the values are spread out, revealing information about the relative roundedness of the ODF, where a lower variance indicates a rounder shape and a higher variance indicates a thinner shape.
Fig. 2.
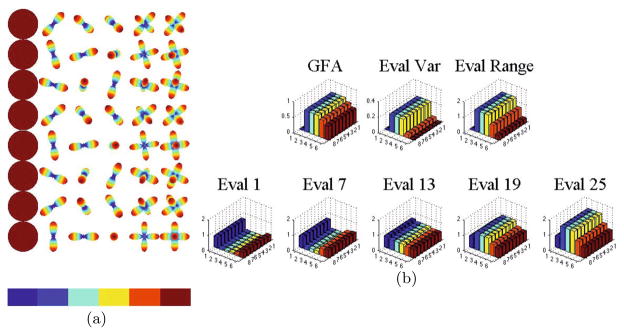
Synthetic ODF field of 0-, 1-, 2-, and 3-fiber ODFs with various rotations and no noise. The graphs in 2(b) are colorcoded by the color bar in 2(a) to indicate each column of the ODF field while each row is a different rotation of each ODF. The constant height of each color in the bar graphs indicate the invariance of the eigenvalues under rotation and the relative differences in values for ODFs with varying number of crossing fibers.
Phantom Data
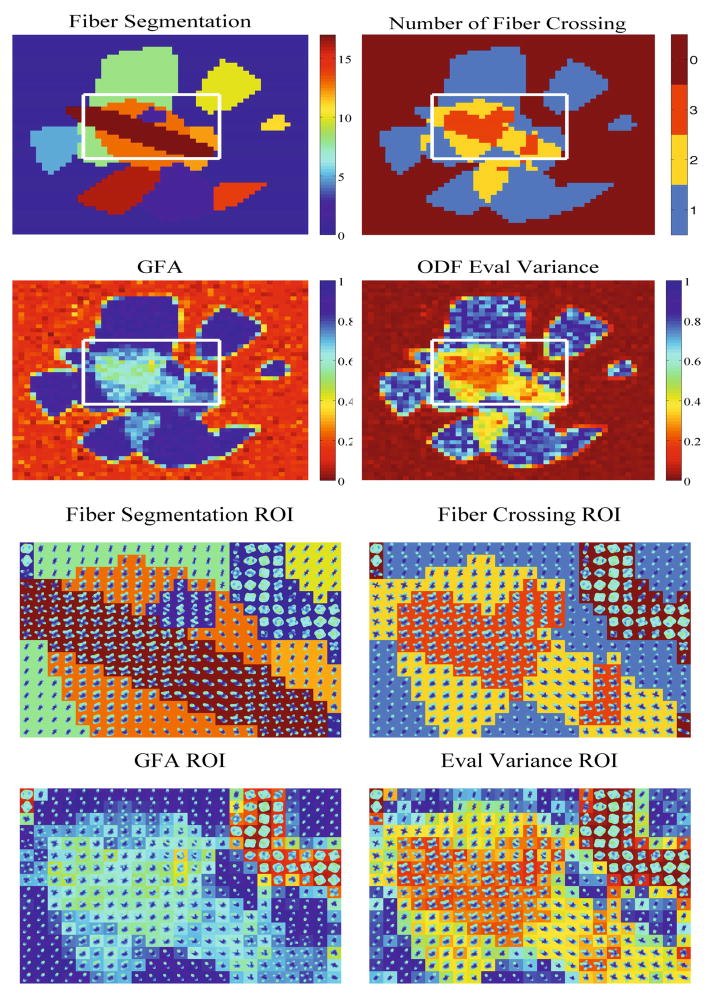
We also evaluate our method on two different phantom datasets. The first one is taken from the ISBI 2013 HARDI Reconstruction Challenge, which consists of 20 fiber bundles crossing at various angles within a 50 × 50 × 50 spherical volume.1 We used a subset of the dataset imaged at 64 gradient directions with b = 3000s/mm2 and SNR of 30. We selected z slice 38 to demonstrate our method on the intricate crossing region shown in Fig. 3. In the top left we present an approximate ground truth segmentation of the fibers by using the given center and radius information for each fiber in the dataset. The image in the top right is a count of the number of fibers that cross in a single voxel based on the ground truth segmentation. The two figures in the second row compare the GFA to the variance of the eigenvalues of TL(p). Notice that the GFA mostly distinguishes isotropic regions from anisotropic ones, while the variance is able to discern regions with 0, 1, 2, or 3 crossing fibers, approximately matching the ground truth. The remaining two rows show a more detailed view of the central region, with the ODF estimates at each voxel.
Fig. 3.
ISBI 2013 HARDI Phantom. First Row: The left image is the ground truth fiber segmentation of a slice of the phantom dataset, where we’ve identified an intricate region of crossing fibers. The right image is a count of the number of fibers that cross in a given voxel, ranging from 0 to 3. Second Row: GFA and eigenvalue variance of the phantom slice. We notice here the stricking similarity between the plot of crossing fibers and the eigenvalue variance whereas the GFA is unable to reveal this information. Third/Fourth Row: Close up of the ROI with ODFs.
Secondly, in Fig. 4, we experimented on the Neurospin MR phantom dataset provided for the MICCAI 2009 Fiber Cup [24, 25]. Analyzing our new scalar maps of eigenvalue range and variance of the Fiber Cup dataset we notice a higher degree of detail. We see more variety of values along the fiber travelling from top right to bottom left. Also very importantly, each new map reveals more details about the shape of the topmost U-shaped kissing fiber, over and above the GFA maps. Furthermore we show each individual eigenvalue and display a progression of values. In particular, the minimum and maximum eigenvalues, Eval 1 and Eval 25, respectively, reveal more detail in the crossing fiber regions. In Eval 1 the crossing regions show up greenish-blue, on the lower end of the spectrum. The same regions in Eval 25 also show lower values with color yellow. As noticed in the synthetic experiments, crossing fibers exhibit a lower range of eigenvalues when compared to single fiber ODFs.
Fig. 4.
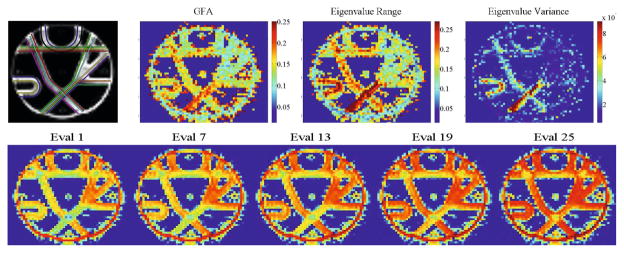
Fiber Cup Phantom. We show the ground truth and GFA compared to the eigenvalue variance and range scalar maps and several eigenvalues of T4(s) where Eval 1 is the smallest eigenvalue and Eval 25 is the largest (Red: high, greenish blue: low).
Real HARDI Data
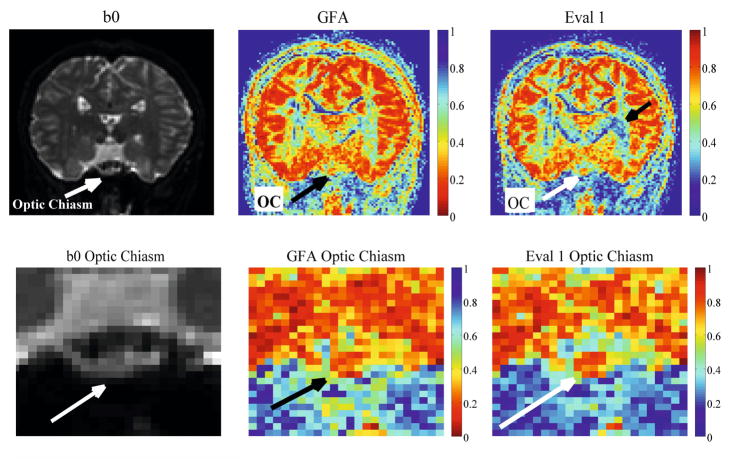
The optic chiasm is the location where two fibers leading from the right and left hemispheres intersect as they travel from the optic tract to the optic nerve. It has been identified as a unique region of two fiber crossing as well as kissing on either side using DTI tractography [26]. In Fig. 5 we analyze the fiber crossing of the optic chiasm and calculate the GFA and minimum eigenvalue feature for this ROI in a 112×112×64 real human brain HARDI dataset acquired with 127 gradient directions and b = 1000s/mm2. The minimum eigenvalue map is able to more concretely distinguish the crossing center red region from the yellow region of the optic tract extending from left and right.
Fig. 5.
Real HARDI scalar maps of the optic chiasm fiber crossing. The bottom arrows identify the location of the optic chiasm. We can distinguish the chiasm in the Eval 1 map while the GFA is noiser. The top arrow in the whole brain Eval 1 map indicates a region where there is more detail to highly anisotropic fiber tracts than the GFA.
5 Conclusion
We have developed a general framework for extracting rotation invariant features from any spherical function using an SH basis. In particular, we extracted features from ODFs of HARDI signals, but any other spherical function used in the numerous methods of HARDI reconstruction and fiber orientation estimation can be substituted here to obtain features valuable for a particular application. These features reduce the complexity of dMRI data to measurable and comparable scalar values that could be used as biomarkers in the detection of neurological diseases.
Acknowledgments
This work was supported by NIH grants 5T32EB010021- 03, R01 EB008432 and P50 AG05146.
Footnotes
References
- 1.Jones DK. Diffusion MRI: Theory, Methods, and Application. Oxford University Press; 2010. [Google Scholar]
- 2.Smith SM, Jenkinson M, Johansen-Berg H, Rueckert D, Nichols TE, Mackay CE, Watkins KE, Ciccarelli O, Cader MZ, Matthews PM, Behrens TE. Tract-based spatial statistics: Voxelwise analysis of multi-subject diffusion data. NeuroImage. 2006;31(4):1487–1505. doi: 10.1016/j.neuroimage.2006.02.024. [DOI] [PubMed] [Google Scholar]
- 3.Basser P. Inferring microstructural features and the physiological state of tissues from diffusion weighted images. NMR in Biomedicine. 1995 doi: 10.1002/nbm.1940080707. [DOI] [PubMed] [Google Scholar]
- 4.Westin CF, Maier SE, Mamata H, Nabavi A, Jolesz FA, Kikinis R. Processing and visualization for diffusion tensor MRI. Medical Image Analysis. 2002;6(2):93–108. doi: 10.1016/s1361-8415(02)00053-1. [DOI] [PubMed] [Google Scholar]
- 5.Ghosh A, Papadopoulo T, Deriche R. Biomarkers for HARDI: 2nd & 4th order tensor invariants. IEEE International Symposium on Biomedical Imaging; 2012. pp. 26–29. [Google Scholar]
- 6.Barmpoutis A, Hwang MS, Howland D, Forder JR, Vemuri BC. Regularized positive-definite fourth order tensor field estimation from DW-MRI. NeuroImage. 2009;45(1):S153–S162. doi: 10.1016/j.neuroimage.2008.10.056. [DOI] [PMC free article] [PubMed] [Google Scholar]
- 7.Barmpoutis A, Vemuri BC. A unified framework for estimating diffusion tensors of any order with symmetric positive-definite constraints. IEEE International Symposium on Biomedical Imaging; 2010. pp. 1385–1388. [DOI] [PMC free article] [PubMed] [Google Scholar]
- 8.Tuch D. Q-ball imaging. Magnetic Resonance in Medicine. 2004;52(6):1358–1372. doi: 10.1002/mrm.20279. [DOI] [PubMed] [Google Scholar]
- 9.Tristan-Vega A, Westin CF, Aja-Fernandez S. Estimation of fiber orientation probability density functions in high angular resolution diffusion imaging. NeuroImage. 2009;47(2):638–650. doi: 10.1016/j.neuroimage.2009.04.049. [DOI] [PubMed] [Google Scholar]
- 10.Aganj I, Lenglet C, Sapiro G, Yacoub E, Ugurbil K, Harel N. Reconstruction of the orientation distribution function in single- and multiple-shell q-ball imaging within constant solid angle. Magnetic Resonance in Medicine. 2010;64(2):554–566. doi: 10.1002/mrm.22365. [DOI] [PMC free article] [PubMed] [Google Scholar]
- 11.Assemlal HE, Tschumperlé D, Brun L, Siddiqi K. Recent advances in diffusion mri modeling: Angular and radial reconstruction. Medical Image Analysis. 2011;15(4):369–396. doi: 10.1016/j.media.2011.02.002. [DOI] [PubMed] [Google Scholar]
- 12.Frank LR. Characterization of anisotropy in high angular resolution diffusion-weighted mri. Magnetic Resonance in Medicine. 2002;47(6):1083–1099. doi: 10.1002/mrm.10156. [DOI] [PubMed] [Google Scholar]
- 13.Ozarslan E, Vemuri BC, Mareci TH. Generalized scalar measures for diffusion mri using trace, variance, and entropy. Magnetic Resonance in Medicine. 2005;53(4):866–876. doi: 10.1002/mrm.20411. [DOI] [PubMed] [Google Scholar]
- 14.Ghosh A, Deriche R. Extracting geometrical features & peak fractional anisotropy from the odf for white matter characterization. IEEE International Symposium on Biomedical Imaging; 2011. pp. 266–271. [Google Scholar]
- 15.Fuster A, van de Sande J, Astola L, Poupon C, ter Haar Romeny B. Fourthorder tensor invariants in high angular resolution diffusion imaging. MICCAI 2011 Workshop on Computational Diffusion MRI; 2011. [Google Scholar]
- 16.Basser PJ, Pajevic S. Spectral decomposition of a 4th-order covariance tensor: Applications to diffusion tensor MRI. Signal Processing. 2007;87(2):220–236. [Google Scholar]
- 17.Grenander U, Szego G. Toeplitz Forms and their Applications. University of California Press; 1958. [Google Scholar]
- 18.Okikiolu K. The analogue of the strong Szego limit theorem on the 2 and 3- dimensional spheres. Journal of the American Mathematical Society. 1996;9:345–372. [Google Scholar]
- 19.Shirdhonkar S, Jacobs D. Non-negative lighting and specular object recognition. IEEE Conference on Computer Vision and Pattern Recognition; 2005. [Google Scholar]
- 20.Cetingul HE, Afsari B, Vidal R. An algebraic solution to rotation recovery in hardi from correspondences of orientation distribution functions. IEEE International Symposium on Biomedical Imaging; 2012. [Google Scholar]
- 21.Chirikjian G, Kyatkin A. With Emphasis on Rotation and Motion Groups. CRC Press; 2000. Engineering Applications of Noncommutative Harmonic Analysis. [Google Scholar]
- 22.Descoteaux M, Angelino E, Fitzgibbons S, Deriche R. Regularized, fast and robust analytical Q-ball imaging. Magnetic Resonance in Medicine. 2007;58(3):497–510. doi: 10.1002/mrm.21277. [DOI] [PubMed] [Google Scholar]
- 23.Schwab E, Afsari B, Vidal R. Estimation of non-negative ODFs using the eigenvalue distribution of spherical functions. In: Ayache N, Delingette H, Golland P, Mori K, editors. MICCAI 2012, Part II. LNCS. Vol. 7511. Springer; Heidelberg: 2012. pp. 322–330. [DOI] [PubMed] [Google Scholar]
- 24.Fillard P, Descoteaux M, Goh A, Gouttard S, Jeurissen B, Malcolm J, Ramirez-Manzanares A, Reisert M, Sakaie K, Tensaouti F, Yo T, Mangin JF, Poupon C. Quantitative evaluation of 10 tractography algorithms on a realistic diffusion mr phantom. NeuroImage. 2011;56(1):220–234. doi: 10.1016/j.neuroimage.2011.01.032. [DOI] [PubMed] [Google Scholar]
- 25.Poupon C, Rieul B, Kezele I, Perrin M, Poupon F, Mangin JF. New diffusion phantoms dedicated to the study and validation of high-angular-resolution diffusion imaging (HARDI) models. Magnetic Resonance in Medicine. 2008;60(6):1276–1283. doi: 10.1002/mrm.21789. [DOI] [PubMed] [Google Scholar]
- 26.Hofer S, Karaus A, Frahm J. Reconstruction and dissection of the entire human visual pathway using diffusion tensor MRI. Frontiers in Neuroanatomy. 2010;4(15) doi: 10.3389/fnana.2010.00015. [DOI] [PMC free article] [PubMed] [Google Scholar]


