Abstract
It has been recently asserted that the nested case-control study design, in which case-control sets are sampled from cohort risk sets, can introduce bias (“study design bias”) when there are lagged exposures. The bases for this claim include a theoretic and an “empirical evaluation” argument. Both of these arguments are examined and found to be incorrect. Appropriate methods to explore the performance of nested case-control study designs, analysis methods, and compute power and sample size from an existing cohort are described. This empirical evaluation approach relies on simulating case-control outcomes from risk sets in the cohort from which the case-control study is to be performed. Because it is based on the underlying cohort structure, the empirical evaluation can provide an assessment that is tailored to the specific characteristics of the study under consideration. The methods are illustrated using samples from the Colorado Plateau uranium miners cohort.
Introduction
While well-established as an epidemiologic study design, a number of articles and letters have appeared recently asserting that the nested case-control study design is susceptible to a form of “study design bias.”1-5 Given the theoretical understanding of the validity of the standard nested case-control design, in which case-control sets consist of the case and a simple random sample of controls from the risk set,6-9 and which we will henceforth refer to as the “simple random sampling case-control” (SRS) design, such contentions might be dismissed as untenable. However, the repeated assertion of bias in the SRS design has raised concerns in the occupational health community that “tried and true” case-control methods may be flawed.10 Noting that methods to empirically evaluate potential study design biases within the context of existing cohort data have not been described, Deubner, Roth, and Levy (DRL) proposed an approach which they then applied to a cohort of beryllium workers to illustrate problems that they contend arise in SRS studies.4 We have three goals in this paper. First, we give a heuristic description of the nested case-control methodology and provide some intuition why the approach is valid for assessing exposure-disease associations. Second, we examine the evidence presented by DRL that the SRS design can be biased when evaluating lagged exposure variables. In particular, we review the DRL method of empirical investigation and show why it not a valid way to evaluate bias questions in SRS designs. Third, we provide a valid approach to empirical evaluation of nested case-control study designs and analysis methods. This approach can be used to evaluate study design validity, investigate the behavior of estimates under model misspecification, and for sample size and power calculations.
As pointed out by DRL, an important advantage of an empirical analysis is that the results are specific to the cohort that serves as the basis for the case-control study.4 Thus, while a flawed study design can in general result in biased estimation, with an empirical evaluation, one can explore the magnitude of such potential bias in the particular study in question. Throughout we will illustrate the concepts and methods using the Colorado Plateau uranium miners cohort.11,12
Nested case-control studies: A brief overview
The Colorado Plateau uranium miners (CPUM) cohort study is a study of radon exposure and lung cancer mortality and has been used extensively both to characterize the radon-lung cancer association and as methodological example.13-15 Although radon exposure has been estimated for all miners in this cohort, we consider a hypothetical situation in which the only radon exposure-related information available on cohort members are the dates of start and end of mining.
Risk set representation of cohort data
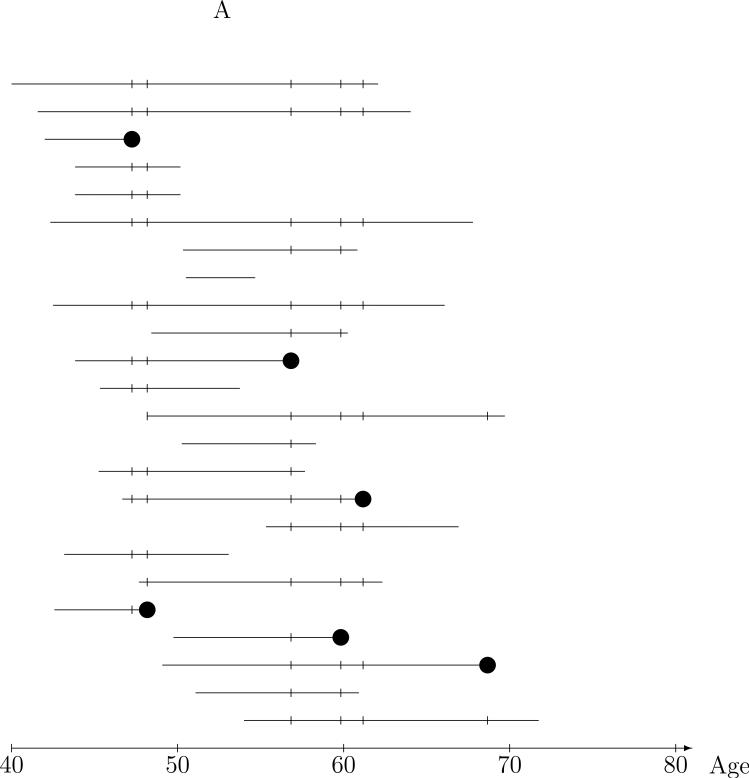
Figure 1A depicts the ages on study and lung cancer mortality information for miners in the underlying cohort. Each horizontal line represents the ages over which the given miner was under observation or at risk for lung cancer death, meaning that at each age on the line, the miner meets the eligibility requirements for cohort membership (e.g., uranium miner in the four states mining area during 1950-1960 enrolled by a United States Public Health Services researcher) and that lung cancer death status is known. Thus, the line starts at the age the miner was enrolled, and ends at the age that the worker is known to have died or at age of last contact if alive. Death due to lung cancer (as noted on the death certificate) is the outcome of interest and is denoted by the ‘●'s. Now, with the goal of assessing the impact of radon exposure on risk of lung cancer, the question becomes “what are reasonable comparisons to make from data of this type?” The nested case-control approach is based on risk sets defined by the ages of lung death and is illustrated by 24 of the 3347 miners in the CPUM cohort in Figure 1A. The risk set at a given lung-cancer death age consists of the case, the miner who died of lung cancer at the risk set age, and controls, miners who were alive and on-study at the risk set age, denoted by the ‘|’s, in the Figure. Comparison of the lung cancer case exposure to that of the controls in the risk set provide a reasonable and intuitive basis for estimation of radon exposure-lung cancer risk relationships. The risk set defines a population of miners of the same age from which any risk set member could have been the lung cancer case, and higher exposure in the cases than the controls in their respective (age-defined) risk sets is evidence of a positive exposure-lung cancer association.
Figure 1.
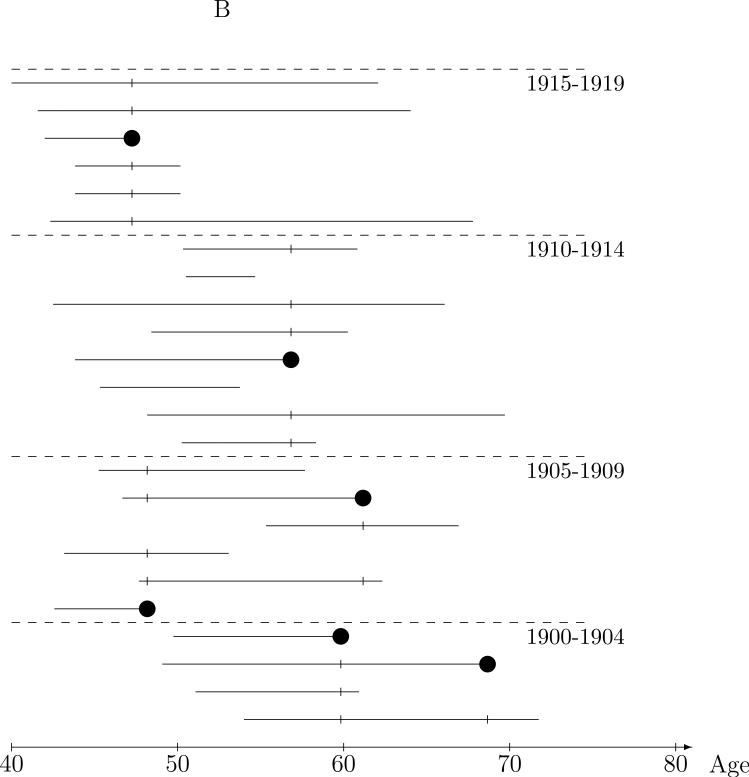
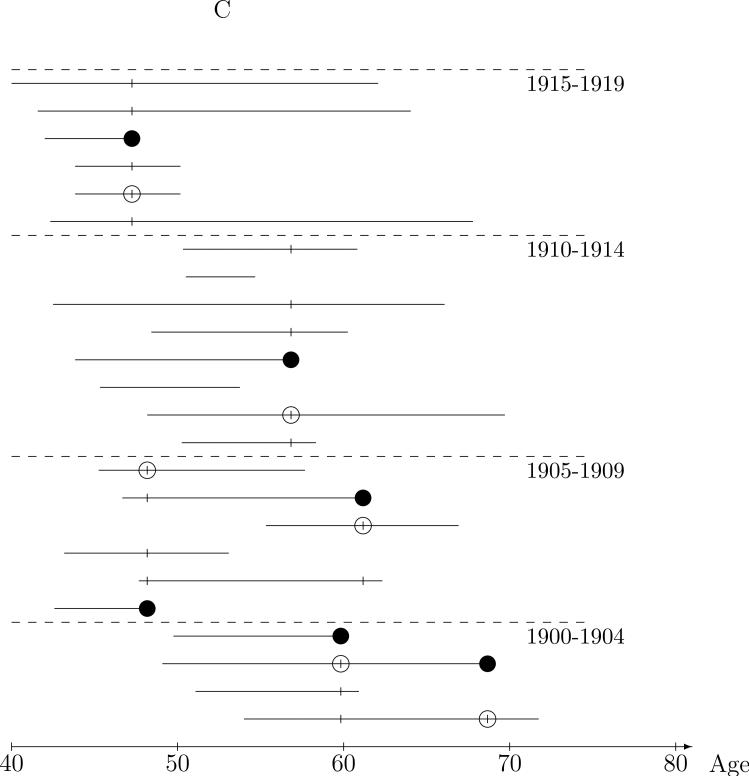
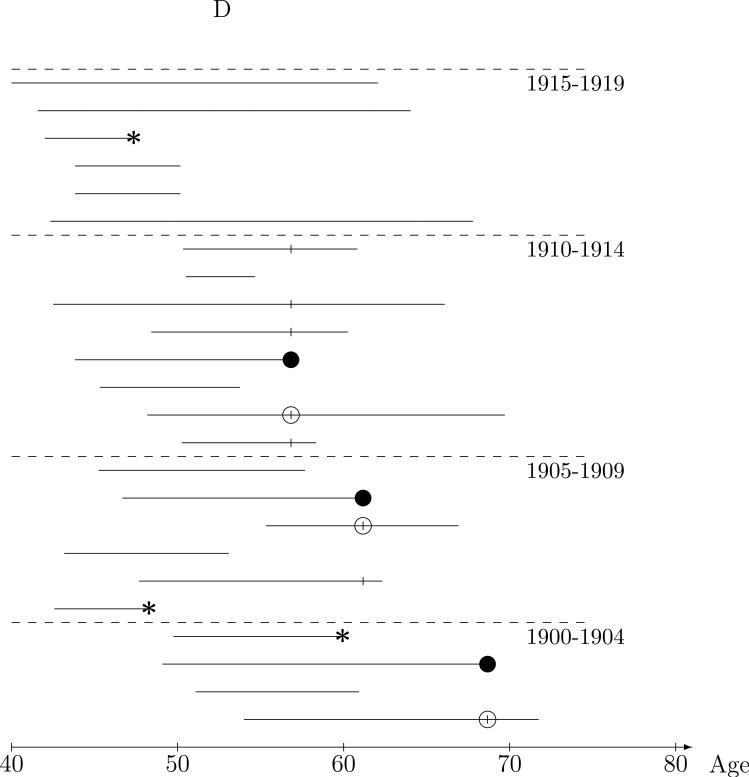
Nested case-control sampling from the Colorado Plateau uranium miners cohort. A. Risk sets at the age of lung cancer deaths. The ‘●’ denote cases and ‘|’ risk set controls. B. Year of birth matched risk sets. C. Sampling controls from matched risk sets. The ‘○’ are sampled controls. D. Sampling cases from the cohort. The ‘●’ denote sampled cases, ‘*’ cases not sampled, and ‘○’ are sampled controls.
Exposure summary construction
While the general idea of comparing exposure in risk set cases and controls is eminently reasonable, we have not described how radon exposure should be quantified for such a comparison. Miners in the cohort are exposed to varying levels of radon, depending on the time and mine worked and inferred for use in the study based on mine measurements made by federal and state agencies. An analytic challenge is how to summarize these exposure histories into meaningful exposure summaries that capture aspects of the history that are relevant to lung cancer risk. The risk set approach again provides some intuition. With the risk set defined by age of lung cancer death, it is natural to compare exposures that are experienced only up at that age, i.e., to compare case-control exposure summaries based on the exposure history up to the risk set age. This simply implements the principle of temporality, that only exposure experienced prior to disease occurrence can be involved in causing the disease.16-18 Of course, further restrictions on exposure summaries may be dictated by the specific study situation. For instance, radon exposure affects lung cancer incidence but in the CPUM study only information on lung cancer death is available. Thus, we have restricted exposure summaries to be functions of radon histories up to two years prior to the risk set age to (approximately) account for the time from lung cancer diagnosis to death.14 Once reasonable restrictions on the exposure history are established, risk set case-control comparisons of any radon exposure summary provides a valid basis for assessing the association between that radon exposure summary and lung cancer risk.
Matching
The appeal of the risk set approach to the CPUM cohort data is that case-control comparisons are between miners of the same age. This natural idea of comparing “like with like” can be extended to other factors as well by restricting the risk set controls to those similar to the case with respect to these factors. For instance, although miners in the CPUM risk sets are of the same age, they attained this age at a wide range of dates. For instance, in the risk set at age 48 in Figure 1A, the case was 48 in 1955, while some the controls were 48 during the 1940s and others were 48 during the 1970s. To make the controls used in the comparison more like the case in terms of date at the risk set age, controls could be required to match the case on, say, year-of-birth. This is illustrated in Figure 1B in which the controls for comparison to the case are restricted to those who were in the same five year year-of-birth matched risk set, i.e., those born in the same five year interval as the case. Intuitively, conclusions drawn from the radon exposure comparisons between cases and the restricted control sets will be more believable than the full risk set controls because the controls are “more like” the case in ways related to time trends, say smoking behavior, that might obscure (confound) a crude analysis of the relationship between radon exposure and lung cancer. Control for confounding by measured covariates may, of course, be achieved by means other than matching. However, matching in a case-control analysis ensures efficiency in the control for matched covariates by achieving balance in the distribution of controls across strata of the matching factor(s). Just as with exposure summary construction, temporality considerations lead to the natural constraint that matching factors should depend on history up to the risk set age.
Cox regression
While a simple measure, such as the mean of the within risk set case-average control exposure differences, gives a sense of whether exposure is associated with lung cancer, a formal statistical method is Cox regression to estimate the rate ratio, the relative change in lung cancer rates per unit of increase in exposure, in which the case-control comparison from each risk set is quantified in a conditional logistic likelihood contribution. The partial likelihood analysis of cohort data is based on the product of the conditional logistic contributions from each case-control set. Cox regression has been studied extensively and the validity of the method is well accepted.19-20
Nested case-control studies
Intuitively, comparison of exposure between the case and controls in the risk sets does not require all the controls; a representative sample of the controls should be sufficient. The nested case-control study illustrated Figure 1C is an extension from “full cohort data,” based on the risk set representation, to “case-control data” with the two sampled controls represented by the ‘○’s. Only a few risk set controls, matched to the case on five year year-of-birth interval, are selected to represent the distribution of exposure in all eligible controls. We will use the term nested case-control studies to mean designs in which controls are sampled (using any of a wide range of sampling methods) from the risk sets, but are sampled independently across risk sets.21 The most common design, and the main focus of this paper, is simple random sampling (SRS design) of controls from the (matched) risk sets . With an SRS design, radon exposure comparisons between the case and sampled controls will, on average, will be representative of those from the risk sets, but with added “sampling” variability. We note that the same intuition applies if one were to first randomly sample the lung cancer cases from the cohort, then randomly sample risk set controls; the case-control relationships are representative of those in the cohort risk sets. This is illustrated in Figure 1D in which the ‘●'s denote randomly sampled cases while the ‘*’s denote cases not sampled. A single control is randomly sampled, the ‘○’s, from the year-of-birth matched risk sets of the three sampled cases. As with the full cohort, the conditional logistic (partial likelihood) analysis of nested case-control data provides valid estimation of the rate ratio and accounts for the sampling variability in the standard errors and confidence intervals. The analysis is completely analogous to the Cox regression method, only just using the “sampled risk sets.” Again, these methods have strong theoretic justification and have been validated extensively.7,9,22
The DRL assertion that nested case-control studies are methodologically flawed
In a series of articles and letters, DRL have asserted that estimates of effect based on lagged exposure variables in SRS nested case-control studies can be biased. In particular, they claim that associations between a lagged exposure variable and disease can be introduced by the SRS nested case-control study design when none, in fact, exists. Lagging of exposure assignment is done in epidemiological analyses in order to account for a period of time from an exposure to an increase in disease risk (an induction and latency period). For instance, the risk of lung cancer does not increase until five years after radon exposure.23 In order to explore the DRL claim of bias, we need a clear definition of nested case control bias. Our definition, which we believe to be the only meaningful one, is that (aside from sampling error) the nested case-control study yields different conclusions from those based on the comparable analysis (i.e., using the same statistical model) of the cohort from which it is drawn. Thus, in the context described by DRL, the assertion is that disease associations with a lagged exposure can be present in the SRS design data that are not present in the cohort. This claim is based on theoretic and empiric evidence. We consider each of these in turn.
Theoretic arguments that SRS nested case-control studies can be biased
The first point made by DRL that we consider is that “...the theoretical foundations on which incidence density (nested case-control) sampling is based do not address exposure lagging.” 3 This assertion would imply that there is a “hole” in the statistical theory that opens the possibility that the SRS design can introduce spurious associations.3,4,5 However, lagged exposure is clearly a summary of past exposure history and thus is a reasonable and valid variable for analysis for which the statistical theory applies. 20,24,25 They further prove that lagging exposure assignment in a SRS study disproportionately truncates exposure information for controls (i.e., the controls tend to have more exposure information truncated due to lagging exposure assignment than the cases).3 However, while the observation and proof that controls have “greater likelihood than cases of having some or all of their exposure truncated” is true, it is irrelevant. When exploring a latency effect, the exposure experienced during the latency (lag) period should be ignored if one wishes to assess an association under the assumption that exposure experienced during this period is not related to disease risk. Intuitively, the lagged exposures of controls from a SRS study will be representative of those from all controls in the risk set (cohort study). If there is no difference in exposure during the lag period in the cohort data, there will be no difference in the SRS nested case-control data.
Emperic evidence that nested case-control studies are biased
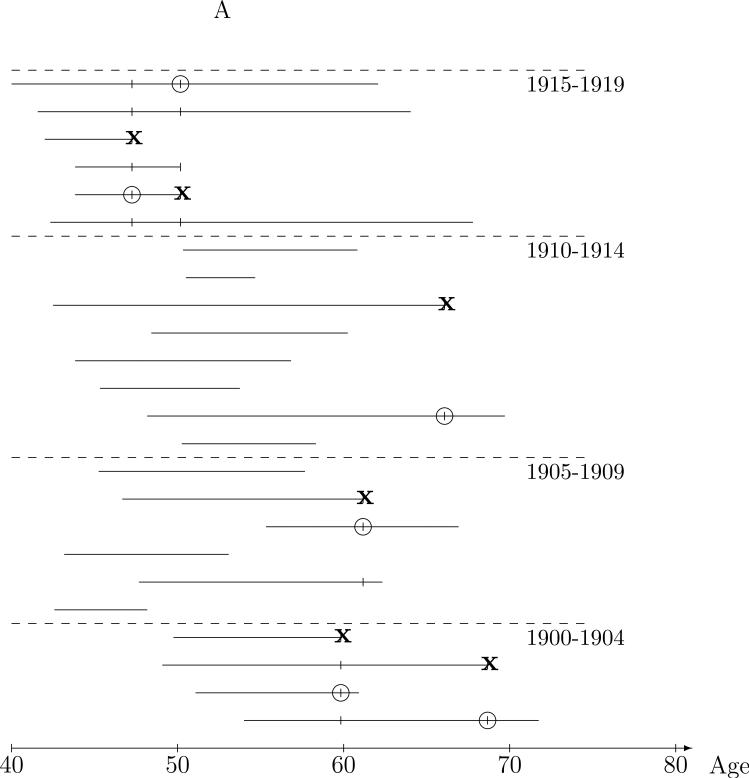
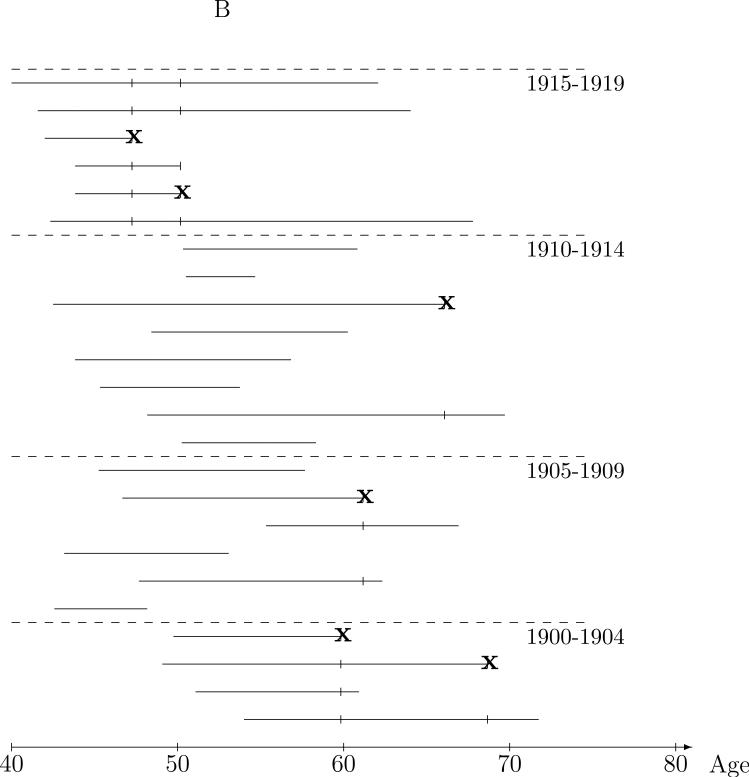
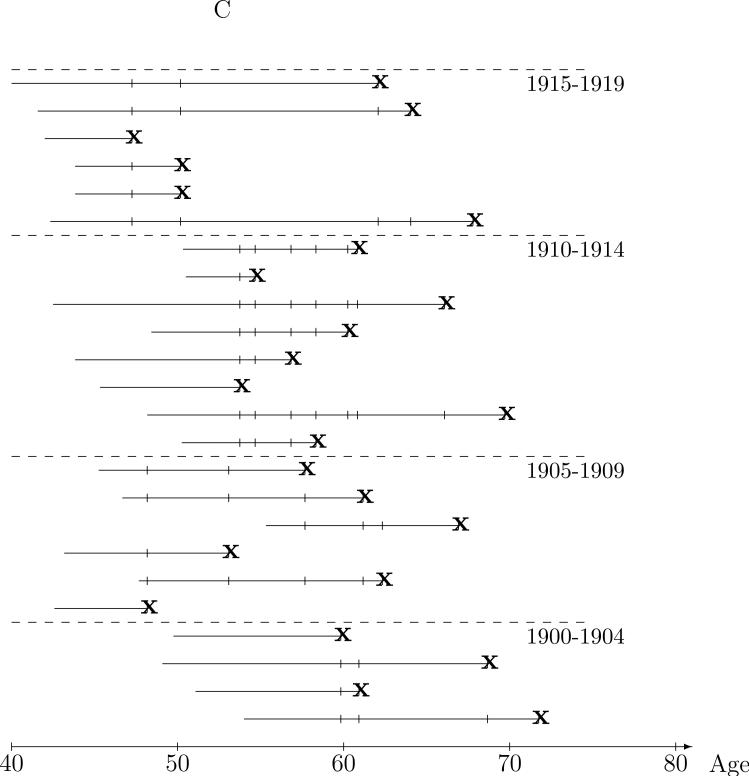
To support their theoretic argument, DRL developed an approach to empirically evaluate bias in nested case-control studies using available cohort data and then showed, in a cohort of beryllium workers, that the lagged exposure was associated with mortality in SRS samples, when it was not associated in the cohort.4 Starting with a cohort of 3569 beryllium workers followed for (lung cancer) mortality through 1988, 142 workers were randomly sampled from the cohort and designated as “probands” with exit age taken as the worker's age at last observation (age at death if deceased, and age at end of follow-up if not deceased). A risk set was formed at each of these proband exit times which included the proband and all workers alive and under study at the proband exit age. Five controls were then sampled from these risk sets. Because the probands were a random sample from the cohort, one might reasonably believe, as DRL assert, that there should not be associations between exposure (or any other variables) and “proband-status.” However, it turns out that associations between exposure and proband-status found in SRS samples by this method reflect associations present in the cohort. To see this, consider our discussion of the nested case-control design. Figure 2A illustrates a DRL sample, with ‘x’ denoting a sampled proband and ‘○’ marking controls. Since controls are randomly sampled from the proband defined risk sets, they are representative of controls in the entire risk set, shown in Figure 2B. Then, because probands are randomly sampled from all members of the cohort, the sampled proband-control comparisons are representative of risk sets in a cohort in which all members are probands, as illustrated in Figure 2C. Due to the random sampling, it should be apparent that any case-control differences in exposure are preserved and that any exposure-outcome associations estimated from the case-control sets in Figure 1A are sample approximations of the same associations in the underlying cohort, Figure 1C. Thus, contrary to the presumption that there should be no association between (lagged) exposure and disease using SRS data generated using the DRL empirical evaluation method, the random sampling of probands preserves any associations between exposure and age at exit that exist in the full cohort. Therefore, the finding that lagged exposure was associated with proband status cannot be used to conclude that nested case-control methods can lead to bias with lagged exposure variables.
Figure 2.
Sampling of the cohort used in the Deubner et al (2007) empirical evaluation. The ‘●’ denote probands and ‘○’ controls. A. Sampled probands (cases) and controls sampled from the risk sets at the proband exit times. B. Sampled probands and proband risk sets. C. All probands and risk sets.
Now, exposure may be associated with age at exit for many reasons including actual increases in rates due to exposure for some other causes of death, or more likely, artifactual associations between exposure and age of exit for subjects alive at the end of the study. To further demonstrate that the DRL empirical investigation does not work, we generated simulated data in which subjects are enrolled during a one year accrual period then followed for one additional year. We assigned a dichotomous exposure to each subject with probability dependent on enrollment time, with 20% exposure probability during the first half of the enrollment year, and 80% during the second half. An exit date from the study was the minimum of the enrollment time plus a random (exponentially distributed) time to disease or three years, the time at the end of follow-up. The rate of disease was set so that approximately 10% of cohort subjects would develop the disease, the rest were alive at end of follow-up. The results from a SRS study with five controls sampled per case and a DRL empirical evaluation, as well as the corresponding cohort study analyses described above, are shown in Table 1. The disease outcome SRS study exposure rate ratio (RR) estimate is 0.93 (95% CI: 0.76-1.13) is consistent with the true RR value of 1 and very close to the cohort estimate of 0.90. The RR estimate from the DRL empirical evaluation is 2.29 (95% CI: 1.89-2.82), a result of the date of entry-exposure correlation and is completely consistent with the cohort results with all subjects as probands.
Table 1.
Results from simulated cohort data: Nested case-control study based on actual cohort failures (disease), empirical evaluation according to DRL method and the corresponding cohort analyses. For the simulated data there was no association between exposure and disease, but exposure was associated with time of entry.
| Disease as outcome | Nested case-control study | Cohort/ failures are diseased subjects | |||||
|---|---|---|---|---|---|---|---|
| Cases | Controls | Rate ratio | CI | Population | Rate ratio | CI | |
| Unexposed | 271 | 1312 | 1 | -- | 2499 | 1 | -- |
| Exposed | 205 | 1068 | 0.93 | (0.76-1.13) | 2501 | 0.90 | (0.75-1.09) |
| Empirical evaluation | Sampled proband nested case-control study | Cohort/ failures are all subjects | |||||
|---|---|---|---|---|---|---|---|
| Cases | Controls | Rate ratio | CI | Population | Rate ratio | CI | |
| Unexposed | 226 | 1568 | 1 | -- | 2499 | 1 | -- |
| Exposed | 250 | 809 | 2.29 | (1.89-2.82) | 2501 | 2.32 | (2.19-2.46) |
Empirical evaluation of design and analysis questions from cohort data
While the DRL empirical evaluation method fails to provide a technique for assessing nested case-control performance when basic cohort data is available, such a procedure would be of some value in assessing design and analysis questions within the context of specific study situations. In this section, we describe a valid approach to this problem.
Description of the method
To simplify the discussion, we will describe the methods with respect to a nested case-control study from the CPUM cohort. In order to conduct a valid empirical evaluation of the nested case-control design, we generate data in which there is a specified association (RR) between exposure and lung cancer. To do this, plausible radon exposure histories are assigned to each miner in the cohort. Suppose that mine surveys provide estimates of decade-specific average dose rates of about 6.25, 8.30, 5.00, and 0.83 working levels23 for <1950, 1950s, 1960s, and ≥1970, respectively. To create a radon exposure history for each miner over the ages between start and end of mining employment, we assigned exposure to each five year interval of age as five years times the decade-specific average dose rate, for the decade at the midpoint of the age interval. Risk sets are then formed at each of ages of the lung cancer death from the cohort. However, we do not identify the lung cancer case. This is done randomly by specifying the rate (instantaneous probability) of lung cancer death for each subject at a given time, which we label λi(t), and is a function of the exposure history of subject i up to time t. For risk set k associated with time tk, to simulate a single case-control study we first pick exactly one case from the risk set, a single draw from a multinomial distribution with probabilities
| (1) |
where the sum is over risk set members, and then sample controls according to the design of interest. This is done for each risk set in the cohort to create a simulated case-control study trial.
The case-control data from each trial is analyzed according to the desired analysis method, and the results tabulated. While λi(t) can be taken to have any form, in most applications a standard log linear (Cox model) form will be used with λi(t) = λ0(t) exp(Zi(t)β) where λ0(t) is the baseline hazard, Zi(t) the exposure summary (vector) for subject i at time t, and β the log rate ratio parameters.19 The approach is justified implicitly by the based on the conditional probabilities used in the partial likelihood construction.19,20 We note that one can also simulate new exposure histories for each trial but this adds to the complexity of the simulation and will rarely make any qualitative (or even quantitative) difference in the conclusions.
Using the risk sets associated with the age at each of the 258 lung cancer ages of death, Zi(tk) were set equal to1 if 20 year lagged cumulative exposure was over 500 working level months (WLM)21 and to 0 if under 500WLM. We assigned a case in the risk set according to equation (1) under the Cox model with rate ratios exp(β0) = 1, 2, and 4. We then sampled controls from the risk set according to the sampling design and estimated the rate ratio using conditional logistic regression with the model of interest. From 500 trials, we computed the anti-log of the mean log rate ratio (“estimated RR”), empirical standard error of the estimated log rate ratio (“empirical s.e.”), average of the estimated standard errors of the log rate ratio (“Estimated s.e.”), power to detect a radon exposure-lung cancer association, and other statistics to characterize the performance of the simulation. The SAS statistical software package (SAS Institute, Cary, NC) was used to perform the simulation. The programs and data are available at http://hydra.usc.edu/timefactors. We now use this approach to address a variety of questions that might arise when considering a nested case-control study from the CPUM study.
Validity of the SRS design for lagged radon exposure
Table 2 gives the results of the empirical evaluation for analyses of the lagged exposure variable in SRS case-control studies with one and three controls per case. As indicated by the “Estimated RR” columns, for all situations considered, the true rate ratio is well estimated using the SRS sampling design. Furthermore, comparing the empirical standard errors of the 500 estimated log rate ratio estimates to the average of the estimated standard errors, the likelihood based estimated standard errors perform as predicted by the theory.
Table 2.
Estimated rate ratios with empirical and average estimated standard errors when controls are a simple random sample from the risk sets (SRS design).
| 1 control | 3 controls | |||||
|---|---|---|---|---|---|---|
| True RR | Estimated RR | Empirical se | Estimated se | Estimated RR | Empirical se | Estimated se |
| 1 | 1.00 | 0.037 | 0.036 | 1.02 | 0.027 | 0.024 |
| 2 | 2.05 | 0.037 | 0.037 | 2.01 | 0.023 | 0.023 |
| 4 | 4.09 | 0.048 | 0.048 | 4.01 | 0.031 | 0.027 |
Comparison of tests of radon-lung cancer association using cumulative and lagged exposure
Continuing with the SRS design, we performed an empirical evaluation to estimate the power to detect a radon effect when exposure assignment is lagged by 20 years and when total cumulative exposure (up to tk-2) is used in the conditional logistic regression. The results for 1 and 3 controls per case are given in Table 3. When the rate ratio is one, the “power” should correspond to the size of the test, in this case 5%. Estimated test size, for both lagged and cumulative exposure analyses, is very close to 5% indicating that the design and analysis are behaving as theory predicts. When the rate ratio equals 2 and 4, testing using the lagged exposure (corresponding to the “true” model used to generate the case outcomes) has nearly 100% power, even with a single control. However, tests based on cumulative exposure (a “misspecified” model) have low power to detect a radon effect, with 66% power to detect a rate ratio of 4 or greater with three controls per case. This empirical investigation shows that, if one were to perform a SRS study in the Colorado Plateau uranium miners cohort, it would be important to investigate latency effects as well as cumulative exposure. A cumulative exposure variable will have much less power to detect an association, when the association is more accurately described by the lagged exposure.
Table 3.
Power to detect a radon-lung cancer association when lagged or cumulative exposure variables are used in the analysis with data generated with rates depending on lagged exposure.
| 1 control | 3 controls | |||
|---|---|---|---|---|
| Rate ratio | Lagged | Cumulative | Lagged | Cumulative |
| 1 | 5% | 4% | 6% | 5% |
| 2 | 98% | 16% | 100% | 18% |
| 4 | 100% | 53% | 100% | 66% |
The effect of matching on age of hire
When designing the nested case-control study, the choice of matching factors is fundamental to the design. Generally, the goal of matching is to choose controls more “like the case” in ways that we feel increase the validity of case-control exposure comparisons. However, matching on factors correlated with exposure can also reduce the statistical power to detect exposure-disease associations by increasing the concordance of case-control sets with respect to the exposure of interest.26 For example, DRL suggest matching on age of hire so that the case-control comparisons will be among workers who have worked a similar period of time.1,3 Certainly, matching on date of hire when there are disease and exposure related unmeasured factors will improve the validity of exposure comparisons, but there may be a large cost in terms of statistical power when the matching is not needed. To examine this question in the CPUM, we performed an empirical investigation of an analysis of lagged exposure from SRS samples from risk set controls matched to the case on 5 year age of first mining interval. The results are shown in Table 4 and, while the average estimated RRs are close to the true, the standard errors are on the order of ten times larger than from a study with the same number of controls from the full risk sets and the power to detect the radon-disease association is quite low (e.g., 70% for RR>4 with 3 controls per case). So, while comparing miners hired around the same age would increase the validity of the exposure-disease findings, our empirical investigation indicates that, the power to find a true association would be somewhat lower than without the matching. Therefore, for a CPUM nested case-control study, we would recommend against matching on age at hire and carefully include in the statistical models any potential non-radon factors related to lung cancer risk that might also be correlated to year of hire.
Table 4.
Empirical evaluation of simple random sample controls matched to the case on 5 year age of hire.
| 1 control | 3 controls | |||||
|---|---|---|---|---|---|---|
| True RR | Estimated RR | Empirical se | Estimated se | Estimated RR | Empirical se | Estimated se |
| 1 | 0.97 | 0.557 | 0.468 | 1.07 | 0.341 | 0.288 |
| 2 | 2.14 | 0.414 | 0.470 | 2.17 | 0.356 | 0.342 |
| 4 | 4.19 | 0.426 | 0.608 | 4.55 | 0.397 | 0.503 |
The effect of matching on age of exit
DRL advocated that SRS design controls should be matched to the case on age of exit from the study.2 Because age of exit will not be known until a subject exits the study, it is not part of history for any time prior to age of exit and, thus could in principle, lead to biased estimation of radon-lung cancer associations. For instance, if non-lung cancer death reasons for exit are associated with radon exposure, the estimated radon lung-cancer associations will be biased toward the null. However, if the other reasons for exit are not well correlated with radon exposure, there may be little or no bias. Here we evaluate of “degree of bias” empirically for the CPUM cohort by sampling from the risk set controls who matched the case by five year age-of-exit interval. The average estimated rate ratios are shown in Table 5. For a study of the CPUM, there is no evidence that this “improper” matching will result in notable bias.
Table 5.
Empirical evaluation of simple random sample controls are matched to the case on 5 year age at exit.
| 1 control | 3 controls | |||||
|---|---|---|---|---|---|---|
| True RR | Estimated RR | Empircal se | Estimated se | Estimated RR | Empircal se | Estimated se |
| 1 | 1.01 | 0.047 | 0.045 | 1.00 | 0.031 | 0.029 |
| 2 | 2.02 | 0.045 | 0.046 | 2.02 | 0.030 | 0.029 |
| 4 | 4.10 | 0.065 | 0.060 | 4.06 | 0.035 | 0.035 |
Pure case-control comparisons
As an alternative to sampling controls independently across risk sets, consider a design that specifies that cases cannot serve as controls and a subject can only serve as a control for a single case. This design might be considered as practical alternative to the standard when inclusion in multiple case-control sets requires multiple interviews with subjects, depletes a biological sample resource, or complicates the study implementation in some other way. With the standard conditional logistic analysis, this method of sampling can lead to bias.27,28 We investigated the performance of this design for a study from the CPUM cohort; the results are given in Table 6. There is detectable upward bias that increases with the number of controls sampled. Because the biases in the table are probably not large enough to invalidate the results of a study using the pure case-control design, we would conclude that if the pure case-control design is highly desirable for logistical reasons, and only one or two controls are to be sampled, the design bias is acceptable within this cohort.
Table 6.
Estimated rate ratios from an empirical evaluation of “pure controls” sampling.
p<.001 for test of estimated RR equal to the true RR.
Discussion
It is unfortunate that a series of articles and letters criticizing aspects of a nested case-control study of beryllium exposure and lung cancer mortality have resulted in confusion about the validity of standard nested case-control study methods. Many of the methodological criticisms were based on the false premise that the theory underlying nested case-control sampling, Cox regression, and, by extension, Poisson regression only accommodates cumulative (and not lagged) exposure summaries. These false premises were compounded by a flawed empirical evaluation of the design.
In this paper, we have provided an explanation of why nested case-control sampling is a the natural sampling analog of analysis based on case-control exposure comparisons in cohort risk sets and discussed the flaws in evidence that has been presented to show that nested case-control studies can be misleading for the analysis of lagged exposures. The investigation of design bias was made in the context of a list of criticisms of a lung cancer risk in a SRS nested case-control study in a cohort of beryllium.29,30 While no study is perfect and it is important to examine plausible alternative explanations for observed exposure-disease associations, “study design bias” should not be considered further as a weakness of this study.
We have provided appropriate methods to evaluate and compare case-control study designs within the context of a particular cohort. The approach can be used in study planning, to assess and compare different candidate study designs, to assess the likely magnitude of potential bias, and compute power to detect effects. Of course, assumptions need to be made about covariates not available in the cohort and the hazard model for disease occurrence and, to the extent that these assumptions deviate from the actual underlying data structure, the empirical evaluation may be inaccurate. Also, the findings from any empirical evaluation will be specific to the characteristics of the particular cohort and study design under examination. General properties of nested case-control study designs and estimators are best studied using the powerful counting process and martingale theory statistical tools for failure time data25. The empirical evaluation methods that we have described complement these theoretical tools by tailoring the evaluation to the particular study situation, accounting for the structure of the underlying cohort, and accommodating complex exposure histories and study designs.
Acknowledgments
Sources of support: Bryan Langholz receives support from National Cancer Institute grant CA42949 and National Institute of Environmental Health Sciences grant 5P30 ES07048.
References
- 1.Deubner DC, Lockey JL, Kotin P, Powers MB, Miller F, Rogers AE, Trichopoulos D. Re: Lung cancer case-control study of beryllium workers. Sanderson WT, Ward EM, Steenland K, Petersen MR. Am J Ind Med. 2001. 39:133-144 [letter]. Am J Ind Med. 2001;40:284–288. doi: 10.1002/ajim.1101. [DOI] [PubMed] [Google Scholar]
- 2.Levy PS, Roth HD, Deubner DC. Exposure to beryllium and occurrence of lung cancer: a reexamination of findings from a nested case-control study. J Occup Environ Med. 2007;49:96–101. doi: 10.1097/JOM.0b013e31802db595. [DOI] [PubMed] [Google Scholar]
- 3.Levy PS, Deubner DC, Roth HD. Re: Exposure to Beryllium and Occurrence of Lung Cancer: A Reexamination of Findings From a Nested Case-Control Study [letter]. J Occup Environ Med. 2007;49:709–711. doi: 10.1097/JOM.0b013e31802db595. [DOI] [PubMed] [Google Scholar]
- 4.Deubner DC, Roth HD, Levy PS. Empirical evaluation of complex epidemiologic study designs: workplace exposure and cancer. J Occup Environ Med. 2007;49:953–959. doi: 10.1097/JOM.0b013e318145b28d. [DOI] [PubMed] [Google Scholar]
- 5.Deubner DC, Roth HD, Levy PS. Re: Empirical evaluation of complex epidemiologic study designs: workplace exposure and cancer [letter]. J Occup Environ Med. 2008;50:2. doi: 10.1097/JOM.0b013e318145b28d. [DOI] [PubMed] [Google Scholar]
- 6.Liddell F, McDonald J, Thomas D. Methods of cohort analysis: Appraisal by application to asbestos miners. Journal of the Royal Statistical Society A. 1977;140:469–491. [Google Scholar]
- 7.Oakes D. Survival times: Aspects of partial likelihood (with discussion). International Statistical Review. 1981;49:235–264. [Google Scholar]
- 8.Breslow NE, Lubin JH, Marek P, Langholz B. Multiplicative models and the analysis of cohort data. Journal of the American Statistical Association. 1983;78:1–11. [Google Scholar]
- 9.Goldstein L, Langholz B. Asymptotic theory for nested case-control sampling in the Cox regression model. Annals of Statistics. 1992;20:1903–1928. [Google Scholar]
- 10.Garabrant DH. Case-Control Study Design: Spurious Associations Between Exposure and Outcome [Editorial]. J Occup Environ Med. 2007;49:941–942. doi: 10.1097/JOM.0b013e3181484f9a. [DOI] [PubMed] [Google Scholar]
- 11.Lundin F, Wagoner J, Archer V. Radon daughter exposure and respiratory cancer, quantitative and temporal aspects. U.S. Public Health Service, Washington, D.C.; Washington, D.C.: 1971. [Google Scholar]
- 12.Hornung RW, Deddens JA, Roscoe RJ. Modifiers of lung cancer risk in uranium miners from the Colorado Plateau. Health Phys. 1998;74:12–21. doi: 10.1097/00004032-199801000-00002. [DOI] [PubMed] [Google Scholar]
- 13.Thomas D, Pogoda J, Langholz B, Mack W. Temporal modifiers of the radon-smoking interaction. Health Physics. 1994;66:257–262. doi: 10.1097/00004032-199403000-00004. [DOI] [PubMed] [Google Scholar]
- 14.Langholz B, Goldstein L. Risk set sampling in epidemiologic cohort studies. Statistical Science. 1996;11:35–53. [Google Scholar]
- 15.Langholz B, Thomas DC, Xiang A, Stram D. Latency analysis in epidemiologic studies of occupational exposures: Application to the Colorado Plateau uranium miners cohort. Am J Ind Med. 1999;35:246–256. doi: 10.1002/(sici)1097-0274(199903)35:3<246::aid-ajim4>3.0.co;2-6. [DOI] [PubMed] [Google Scholar]
- 16.Hill BA. The environment and disease: Association or causation? Proceedings of the Royal Society of Medicine. 1965;58:295–300. doi: 10.1177/003591576505800503. [DOI] [PMC free article] [PubMed] [Google Scholar]
- 17.Wacholder S, McLaughlin JK, Silverman DT, Mandel JS. Selection of controls in case-control studies. I. Principles. Am J Epidemiol. 1992;135:1019–1028. doi: 10.1093/oxfordjournals.aje.a116396. [DOI] [PubMed] [Google Scholar]
- 18.Wacholder S, Silverman DT, McLaughlin JK, Mandel JS. Selection of controls in case-control studies. III. Design options. Am J Epidemiol. 1992;135:1042–1050. doi: 10.1093/oxfordjournals.aje.a116398. [DOI] [PubMed] [Google Scholar]
- 19.Cox DR. Regression models and life-tables (with discussion). Journal of the Royal Statistical Society B. 1972;34:187–220. [Google Scholar]
- 20.Andersen PK, Gill RD. Cox's regression model for counting processes: A large sample study. Annals of Statistics. 1982;10:1100–1120. [Google Scholar]
- 21.Langholz B. Use of cohort information in the design and analysis of case-control studies. Scandinavian Journal of Statistics. 2007;34:120–136. [Google Scholar]
- 22.Borgan Ø , Goldstein L, Langholz B. Methods for the analysis of sampled cohort data in the Cox proportional hazards model. Annals of Statistics. 1995;23:1749–1778. [Google Scholar]
- 23.Lubin J, Boice J, Edling C, Hornung R, Howe G, Kunz E, Kusiak R, Morrison H, Radford E, Samet J, Tirmarche M, Woodward A, Xiang Y, Pierce D. Radon and lung cancer risk: A joint analysis of 11 underground miners studies. NIH Publication 94-3644. U.S. Department of Health and Human Services, Public Health Service, National Institutes of Health; Bethesda, MD: 1994. [Google Scholar]
- 24.Self SG, Prentice RL. Commentary on Andersen and Gill's Cox's regression model for counting processes: A large sample study. Annals of Statistics. 1982;10:1121–1124. [Google Scholar]
- 25.Andersen P, Borgan O, Gill R, Keiding N. Statistical Models Based on Counting Processes. Springer Verlag; New York: p. 1992. [Google Scholar]
- 26.Wacholder S. Design issues in case-control studies. Statistical Methods in Medical Research. 1995;4:293–309. doi: 10.1177/096228029500400403. [DOI] [PubMed] [Google Scholar]
- 27.Lubin J, Gail M. Biased selection of controls for case-control analysis of cohort studies. Biometrics. 1984;40:63–75. [PubMed] [Google Scholar]
- 28.Robins J, Gail M, Lubin J. More on “Biased selection of controls for case-control analysis cohort studies”. Biometrics. 1986;42:293–299. [PubMed] [Google Scholar]
- 29.Sanderson WT, Ward EM, Steenland K, Petersen MR. Lung cancer case-control study of beryllium workers. Am J Ind Med. 2001;39:133–144. doi: 10.1002/1097-0274(200102)39:2<133::aid-ajim1001>3.0.co;2-7. [DOI] [PubMed] [Google Scholar]
- 30.Sanderson WT, Ward EM, Steenland K. Re: Response to Criticisms of “Lung Cancer Case-Control Study of Beryllium Workers” Am. J. Ind. Med. 2001. 39:133-144. Am J Ind Med. 2001;40:286–288. doi: 10.1002/1097-0274(200102)39:2<133::aid-ajim1001>3.0.co;2-7. [DOI] [PubMed] [Google Scholar]


