

Abstract
Immunohistochemistry is the gold standard for diagnosing (positive versus negative) polyomavirus BK (BKV) nephropathy and has the potential for disease staging based on staining intensity and quantification of infected cells. This multicenter trial evaluated the reproducibility of BKV immunohistochemistry among 81 pathologists at 60 institutions. Participants stained tissue microarray slides and scored them for staining intensity and percentage of positive nuclei. Staining protocol details and evaluation scores were collected online. Slides were returned for centralized panel re-evaluation and kappa statistics were calculated. Individual assessment of staining intensity and percentage was more reproducible than combined scoring. Inter-institutional reproducibility was moderate for staining intensity (κ=0.49) and percentage (κ=0.42), fair for combined (κ=0.25), and best for simple positive/negative scoring (κ=0.63). Inter-observer reproducibility was substantial for intensity (κ=0.74), percentage (κ=0.66), and positive/negative (κ=0.67), and moderate for combined scoring (κ=0.43). Inter-laboratory reproducibility was fair for intensity (κ=0.37), percentage (κ=0.40), and combined (κ=0.24), but substantial for positive/negative scoring (κ=0.78). BKV RNA copies/cell correlated with staining intensity (r=0.56) and percentage (r=0.62). These results indicate that BKV immunohistochemistry is reproducible between observers but scoring should be simplified to a single-feature schema. Standardization of tissue processing and staining protocols would further improve inter-laboratory reproducibility.
INTRODUCTION
Polyomavirus BK (BKV) is widely latent in humans. Immunosuppression in renal transplant recipients induces viral reactivation. Progressive viral replication leads to viremia followed by a tissue destructive BKV nephropathy (BKVN) (1–3). Early diagnosis of BKVN allows for timely reduction of immunosuppression, which leads to successful reversal of disease in approximately 80% of patients. In contrast, late diagnosis results in graft loss in most cases (4–6). Documentation of renal tubular epithelial cell infection by immunohistochemistry (IHC) for polyomavirus proteins is essential for the early diagnosis of BKVN. Despite its central importance in clinical decision making, little has been done to evaluate the reproducibility of BKV IHC between institutions (7). Tissue microarrays (TMAs) have become a valuable tool for conducting quality assessment trials in the area of IHC (8), enabling comprehensive assessment of numerous cases in a highly consistent, cost, and time efficient manner (9).
At the 10th Banff Conference on Allograft Pathology in 2009, the Banff initiative for quality assurance in transplantation (BIFQUIT) was launched and organized a multicenter trial with the aim of assessing and improving the reproducibility of BKV IHC in human kidney transplant tissue (10;11). Here we present the results from this BKV BIFQUIT trial.
MATERIALS AND METHODS
Design and Recruitment
The BIFQUIT trial is outlined in Supplementary Figure 1. Information about the proposed trial was electronically disseminated to 78 medical centers in 24 countries. A total of 81 pathologists from 60 centers agreed to participate.
Construction of Tissue Microarray
A 25-core TMA was prepared using previously published methods (9) from: nine allograft nephrectomy specimens with BKVN (each represented in duplicate), two negative controls from native nephrectomy specimens (each represented in duplicate), and two positive controls, one from a renal cell carcinoma expressing BKV large T-antigen (represented in duplicate), and one core from a paraffin-embedded polyomavirus SV40 large T-antigen-expressing African green monkey kidney fibroblast-like cell line (Cos7, ATCC#CRL1652). Harvesting, fixing, and paraffin-embedding of the cell line were done as previously described (12). All tissues were anonymous in accordance with local institutional review board procedures. TMA slides were sent to each of the participating centers, where local laboratory protocols were used to perform polyomavirus IHC staining.
Data Collection
Technical information about local staining procedures was collected with a web-based questionnaire. Each participating pathologist was asked to score the intensity of staining and extent of infection. The recommended intensity scoring scale was: 0 (no staining), A (weak), B (moderate), and C (strong). The extent of infection was quantified by estimating the percentage of positive tubular epithelial cell nuclei, scored as: 0 (none), 1 (<10%), 2 (10–25%), and 3 (>25%). An overall alpha-numeric score was thus assigned to each tissue core. For example, an overall score of A1 represented weak staining in less than 10% of the tubular nuclei, whereas C3 equated to strong staining in >25% of the tubular nuclei. Technically unsatisfactory cores were assigned the code 99.
Centralized Slide Review
After staining and interpretation at the participating centers, the TMA slides were returned and reviewed simultaneously at a multiheaded microscope by five of the authors (PR, RC, HR, MM, YK). Consensus scores were assigned for both staining intensity and percentage using the schema outlined above. These panel scores were subsequently treated as the “reference read” against which all others were compared. Through consensus agreement, the panel identified a single “reference slide” as having the best BKV IHC stain in terms of intensity, specificity, and lack of background staining.
Assessing Reproducibility of BKV IHC on Paraffin Sections
Reproducibility was assessed for the combined score (intensity and percent) as well as the two components separately (intensity-only and percent-only). Simple positive (any staining) versus negative (no staining) scores were also evaluated. In the real world diagnostic setting, the overall variation for BKV assessment between institutions (inter-institutional reproducibility) is influenced by a combination of different processing and staining protocols (inter-laboratory reproducibility) and different pathologists applying the same semi-quantitative scoring system (inter-observer reproducibility).
Inter-institutional reproducibility was determined by comparing the scores provided by each participant on their locally-stained slide to the corresponding scores provided by the local participant from the center that produced the reference slide.
Inter-laboratory reproducibility was determined by comparing the panel consensus scores for each slide to the panel consensus scores for the reference slide.
Inter-observer reproducibility was determined by comparing the scores of each local participant to the panel consensus scores for the same locally-stained slide read by that participant.
Statistical Analysis
Explorative data analysis was performed with Bland-Altman plots, in which the x-axis is the mean of two scores (panel score + participant score/2), essentially representing the best guess as to the correct result, and the y-axis is the difference between the same two scores (panel score – participant score) (13). For this analysis, each participant read was compared with the corresponding panel read on the same locally-stained slide (i.e. inter-observer variability) and mean values were calculated for each of the 25 tissue cores.
Cohen’s kappa statistics were calculated for the inter-institutional, inter-laboratory and inter-observer reproducibility, as defined above, for the positive vs. negative score and the combined score (intensity and percent). These values measure the degree of agreement between reads while taking into account the amount expected due to chance alone. Weighted kappa statistics, in which disagreements between observers are rated differently (larger discrepancies carry greater weights), were calculated for the individual intensity-only and percent-only scores (14). Weighted kappas were not used for the combined alpha-numeric scoring system as it is a non-linear schema. Mean kappa values were then determined for each of the above categories. All statistical calculations were performed in R version 3.0.2 (R Foundation for Statistical Computing, Vienna, Austria). The general guidelines for interpreting the significance of kappa values are as follows: <0 as no agreement (or less agreement than would be expected by chance alone), 0–0.20 as slight, 0.21–0.40 as fair, 0.41–0.60 as moderate, 0.61–0.80 as substantial, and 0.81–1 as near perfect agreement.
Quantitative PCR for BKV RNA and DNA in Coordinating Center
Real-time PCR was performed on 5–10 μm formalin-fixed whole block sections as well as tissue cores procured adjacent to those used to make the TMAs. RNA was extracted using the RNeasy FFPE Kit (Qiagen, Hilden, Germany) as per the manufacturer’s instructions for deparaffinization, proteinase K digestion, and binding to the RNeasy MinElute column. To measure the total nucleic acid content of the biopsy tissue, the DNAase digestion step was omitted. A 4 μL aliquot of the RNA or DNA was then reverse transcribed using the QuantiTect Reverse Transcription Kit (Qiagen, Hilden, Germany) for cDNA synthesis. The manufacturer’s instructions were followed except for omission of the genomic DNA wipeout buffer incubation step for tissues being evaluated for DNA content. Ten microliters (10 μL) of the eluted cDNA was used for quantifying BKV DNA by real-time PCR (ABI Prism 7700 Sequence Detector, ABI, Foster City, CA, USA) using the following oligonucleotide sequences derived from the BKV VP1 gene: forward primer: 5′-TGA TAG CC50 AGA GAG AAA AAT GC-3′; reverse primer: 5′-TCC ACA GGT TAG GTC CTC ATT TAAA-3′; probe sequence 5′-FAM-TTA CAG CAC AGC AAG AAT TCC CCT CCC TAMRA-3′.
Viral DNA data was normalized to the total number of cells analyzed by simultaneously quantifying the housekeeping gene aspartoacylase using the following oligonucleotides: forward primer 5′-CCC TGC TAC GTT TAT CTG ATT GAG-3′; reverse primer: 5′-CCC ACA GGA TAC TTG GCT ATG G-3′; probe sequence: 5′-VIC-TTA CAG CAC AGC AAG AAT TCC CCT CCC TAMRA-3′.
Amplification reactions were performed in a reaction volume of 25 μL containing Taqman Master Mix (2X, 12.5 μl), forward primer (10 μM, 0.5 μl), reverse primer (10 μM, 0.5 μl), probe (10 μM, 0.5 μl), sample DNA (5.0 μl), and double distilled water (6.0 μl). Thermal cycling steps included an initial denaturation at 95°C for 20 seconds, followed by 40 cycles at 95°C for 3 seconds, and 60°C for 30 seconds. No-template and negative control runs were included in each reaction plate. Standard curves for quantitation of BKV DNA were constructed using serial dilutions of a plasmid containing the entire linearized genome of BKV (ATCC#45025).
RESULTS
Trial Demographics
A total of 81 participating pathologists submitted their BKV scores. Forty-eight locally-stained slides were returned to the organizing center of the 60 originally sent out. Fifty-five surveys assessing BKV IHC staining methods and general trial questions were completed. Ninety-eight percent (98%) of the participants felt that regular participation in external proficiency testing for BKV IHC staining is important. Ninety-one percent (91%) indicated that the staining results on the BIFQUIT TMA slide were comparable to those observed in their routine practice.
The central panel reviewed a total of 1200 tissue spots (48 TMA slides × 25 spots/slide), with 92 (8%) being identified as inadequate for evaluation for technical reasons. The reference slide was scored by the panel as follows: 12 (48%) of the 25 spots as A1, one (4%) as B1, one (4%) as B3, two (8%) as C1 (Figure 1), and nine (36%) as 0. The distribution of the participant scores for their locally-stained slides in relation to the panel consensus scores for the reference slide is shown in Table 1.
Figure 1.

Strong staining of <10% of tubular nuclei (overall BKV score of C1) in a tissue core on the reference slide.
Table 1.
| TMA Core | Panel Consensus4 | Number of participant calls on slides stained in their own laboratory
|
||||||||||
|---|---|---|---|---|---|---|---|---|---|---|---|---|
| 0 | A1 | A2 | A3 | B1 | B2 | B3 | C1 | C2 | C3 | 99 | ||
| 1 | A1 | 2 | 2 | 2 | 1 | 7 | 19 | 11 | 9 | 15 | 11 | 2 |
| 2 | A1 | 3 | 7 | 3 | 0 | 3 | 19 | 13 | 9 | 13 | 9 | 2 |
| 3 | A1 | 1 | 3 | 0 | 1 | 5 | 22 | 8 | 4 | 13 | 22 | 2 |
| 4 | A1 | 2 | 1 | 1 | 0 | 4 | 7 | 0 | 11 | 22 | 7 | 26 |
| 5 | 0 | 71 | 2 | 1 | 0 | 2 | 0 | 0 | 2 | 1 | 0 | 2 |
| 6 | 0 | 72 | 0 | 0 | 0 | 2 | 0 | 0 | 0 | 1 | 0 | 6 |
| 7 (neg. control) | 0 | 75 | 2 | 0 | 1 | 0 | 0 | 0 | 2 | 0 | 0 | 1 |
| 8 (neg. control) | 0 | 49 | 1 | 0 | 0 | 1 | 0 | 0 | 1 | 0 | 0 | 29 |
| 9 (neg. control) | 0 | 78 | 0 | 0 | 0 | 1 | 0 | 0 | 1 | 0 | 0 | 1 |
| 10 (neg. control) | 0 | 75 | 3 | 0 | 0 | 0 | 0 | 0 | 0 | 0 | 1 | 2 |
| 11 | A1 | 2 | 2 | 0 | 1 | 5 | 10 | 8 | 2 | 17 | 33 | 1 |
| 12 | B1 | 4 | 4 | 3 | 2 | 6 | 11 | 15 | 9 | 9 | 15 | 3 |
| 13 | C1 | 8 | 11 | 2 | 0 | 22 | 9 | 6 | 12 | 9 | 0 | 2 |
| 14 | 0 | 28 | 13 | 0 | 0 | 9 | 0 | 0 | 6 | 0 | 0 | 25 |
| 15 | A1 | 9 | 4 | 0 | 0 | 24 | 4 | 1 | 30 | 7 | 1 | 1 |
| 16 | A1 | 7 | 9 | 2 | 0 | 18 | 4 | 1 | 21 | 10 | 8 | 1 |
| 17 | 0 | 39 | 22 | 1 | 0 | 7 | 3 | 0 | 2 | 0 | 2 | 5 |
| 18 | A1 | 25 | 20 | 0 | 0 | 23 | 2 | 0 | 5 | 0 | 1 | 5 |
| 19 | A1 | 13 | 17 | 5 | 6 | 2 | 7 | 18 | 0 | 1 | 8 | 4 |
| 20 | 0 | 16 | 12 | 12 | 4 | 5 | 3 | 18 | 0 | 1 | 6 | 4 |
| 21 | A1 | 1 | 6 | 3 | 0 | 26 | 6 | 1 | 25 | 9 | 3 | 1 |
| 22 | C1 | 1 | 0 | 0 | 0 | 2 | 2 | 1 | 25 | 32 | 14 | 4 |
| 23 | A1 | 4 | 3 | 1 | 0 | 16 | 11 | 1 | 21 | 13 | 7 | 4 |
| 24 | A1 | 4 | 4 | 0 | 0 | 14 | 8 | 3 | 20 | 9 | 5 | 14 |
| 25 (pos. cell line) | B3 | 2 | 3 | 0 | 0 | 0 | 0 | 1 | 1 | 0 | 48 | 26 |
Legend (% participants):

Intensity scoring scale: 0 (no staining), A (weak), B (moderate), C (strong).
Percentage (of positive tubular epithelial cell nuclei) scoring scale: 0 (none), 1 (<10%), 2 (10–25%), 3 (>25%).
99 = tissue core cannot be evaluated for technical reasons.
Panel consensus scores for the “reference slide” (i.e. the slide judged by the panel as having the best overall staining intensity, specificity, and lack of background deposition).
The correct grade (0) was assigned to three of the four negative controls (TMA cores #7, 9, 10) by at least 75 (93%) of the 81 participants. The remaining negative control (#8) was correctly identified by 49 (60%) of the participants, but 29 (35%) reported technical inadequacy (code 99). Six participants assigned false-positive scores to at least one of the negative controls. Of these, three had one false-positive, one had two, one had three, and one participant scored all four negative controls as positive. All tissue spots scored as false-positive by the participants were re-evaluated with the correct grade (0) by the panel, indicating that these were more likely data entry mistakes than true observer misinterpretations.
The positive control cell line (#25) was assigned grade B3 by the panel. Forty-eight participants (59%) scored it as C3, while 26 (32%) scored it as technically inadequate. This latter designation usually resulted from tissue detachment from the TMA slide. Two participants returned negative scores for the positive control and these results were affirmed by the panel on re-evaluation. Of note, these false-negative slides were stained in the only laboratories to use antibodies against SV40 VP1.
There was relatively more agreement with negative (i.e. #5–10) and strongly positive (i.e. #22, 25) cases, but less agreement with intermediate cases (i.e. #12), as shown in the Bland-Altman plots in Figure 2 (smaller bias indices at the far left and right of the x-axes). These plots also demonstrate that, for both staining intensity (Figure 2A) and percentage (Figure 2B), the panel assigned generally lower scores than the participants, with bias indices of −0.04 for intensity and −0.21 for percentage (bias index = average difference between panel score and participant score = [sum of (panel score − participant score)]/n).
Figure 2.
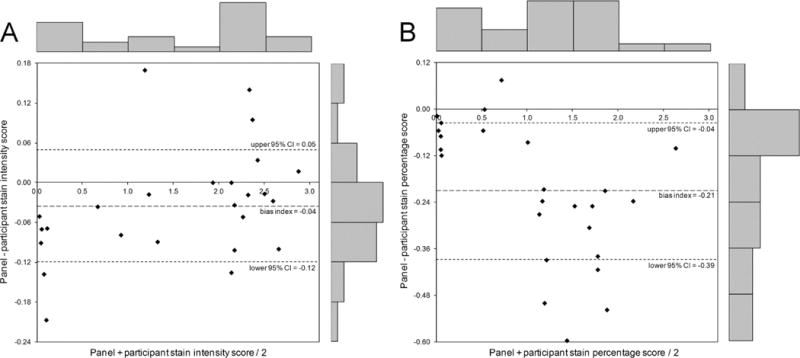
Bland-Altman plots for intensity of staining (A) and percentage of positive tubular nuclei (B). If a plot shows widely scattered data points, above and below zero, this suggests that there is no consistent bias of one observer (panel) versus the other (participants). These plots show that the panel assigned generally lower scores than the local participants. This is indicated by the fact that most points, each of which represents one of the 25 cores in the TMA, are below the zero line. This discrepancy was relatively greater for staining percentage (bias index = −0.21) than for staining intensity (bias index = −0.04). For staining percentage, the plot also shows that there is distinctly more discrepancy between the panel and participants for intermediate cases compared with negative and strongly positive cases. The frequency bars along the top and right-hand side of the graphs demonstrate the relative distribution of data points along both axes.
Reproducibility of BKV IHC on Paraffin Sections
Mean kappa values for inter-institutional, inter-laboratory and inter-observer reproducibility, as defined above, are summarized in Table 2. Data is presented for simple positive vs. negative scoring, combined alpha-numeric scoring, and the individual scores for staining intensity (intensity-only) and percentage of positive tubular nuclei (percent-only).
Table 2.
| Combined Score3 | Intensity-Only Score4 | Percent-Only Score4 | Positive vs. Negative5 | |
|---|---|---|---|---|
| Inter-institutional reproducibility: Variation between institutions resulting from differences in laboratory procedures plus subjective interpretation by different observers. Mean kappa values were calculated by comparing the scores provided by each participant on their locally-stained slide to the corresponding scores provided by the local participant from the center that produced the reference slide (n=81). | 0.25 (0.23–0.27) |
0.49 (0.44–0.54) |
0.42 (0.37–0.47) |
0.63 (0.58–0.68) |
| Inter-laboratory reproducibility: Variation resulting from differences in laboratory procedures. Mean kappa values were calculated by comparing the panel consensus scores for each slide to the panel consensus scores for the reference slide (n=48). | 0.24 (0.21–0.27) |
0.37 (0.32–0.42) |
0.40 (0.33–0.47) |
0.67 (0.63–0.71) |
| Inter-observer reproducibility: Variation resulting from subjective interpretation by different observers. Mean kappa values were calculated by comparing the scores of each local participant to the panel consensus scores on the same slide (n=59). | 0.43 (0.38–0.48) |
0.74 (0.68–0.80) |
0.66 (0.60–0.72) |
0.78 (0.72–0.84) |
Significance of kappa values: <0 no agreement (or less than expected by chance), 0–0.20 slight, 0.21–0.40 fair, 0.41–0.60 moderate, 0.61–0.80 substantial, and 0.81–1.00 almost perfect agreement.
Data is presented as mean and 95% confidence interval.
Combined score is presented as Cohen’s kappa statistics (weighted kappa is not applicable as it is non-linear).
Intensity-only and percent-only scores are presented as weighted kappa statistics.
Positive (any staining) vs. negative (no staining) score is presented as Cohen’s kappa statistics.
Inter-Institutional Reproducibility
The scores provided by each of the 81 participants were compared with those from the reference slide local participant. The combined alpha-numeric scoring system demonstrated fair overall inter-institutional reproducibility with a mean Cohen’s kappa of 0.25. A higher degree of inter-institutional agreement was observed when either staining intensity or percentage scores were considered separately. The intensity-only and percent-only scores showed moderate mean weighted kappas of 0.49 and 0.42, respectively. There was substantial agreement with simple positive vs. negative scoring with a mean Cohen’s kappa of 0.63.
Inter-Laboratory Reproducibility
The panel consensus scores for each of the 48 returned slides were compared with those for the reference slide. Isolating for the variation resulting from differences in laboratory procedures, the combined alpha-numeric score again showed only a fair mean Cohen’s kappa of 0.24. Fair inter-laboratory agreement was also seen for the intensity-only score with a mean weighted kappa of 0.37. The percent-only score demonstrated a higher degree of inter-laboratory reproducibility with a moderate mean weighted kappa of 0.40. Substantial agreement was again observed with positive vs. negative scoring with a mean Cohen’s kappa of 0.67.
Inter-Observer Reproducibility
Given that some institutions had multiple participants, the 48 returned slides actually corresponded to 59 participant reads. The scores provided by each of these participants were compared with the panel scores for the same slide. The inter-observer reproducibility was superior to inter-institutional and inter-laboratory agreement for all four scoring schemas. The combined alpha-numeric score demonstrated a moderate mean Cohen’s kappa of 0.43. Reproducibility was again superior when staining intensity and percentage scores were analyzed individually. The intensity-only, percent-only, and positive vs. negative scores all showed substantial mean kappas of 0.74, 0.66, and 0.78, respectively.
Figure 3 compares the inter-laboratory and inter-observer reproducibility of the intensity-only and percent-only scoring systems. Each data point represents the performance of a single participant in the trial. Those participants performing with an at least moderate (κ>0.4) or substantial (κ>0.6) inter-observer and inter-laboratory reproducibility can be seen in the upper-right corner of the graphs. Intensity-only scoring was associated with 36% of the participants having at least moderate and 7% having at least substantial combined reproducibility (Figure 3A). Percent-only scoring similarly showed 33% to have at least moderate and 7% to have at least substantial combined reproducibility (Figure 3B). Such scatter plots were sent to each participant with their respective position highlighted, thus providing individual feedback regarding their relative performance.
Figure 3.
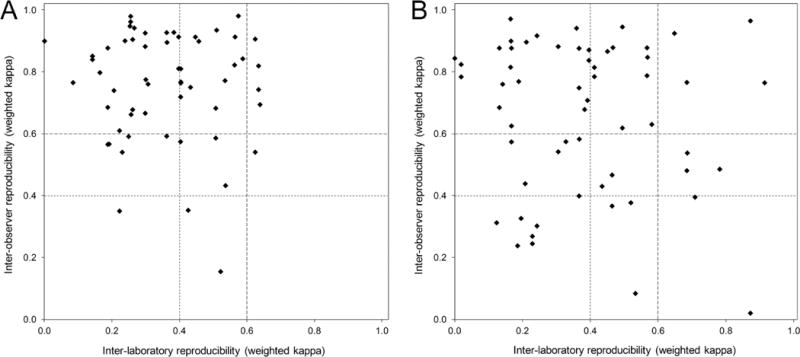
Scatter plots showing inter-observer versus inter-laboratory reproducibility for each participant (as represented by weighted kappa values) for BKV IHC staining intensity score (A) and staining percentage score (B). Distribution of the majority of the data points in the top-left quadrants indicates much better inter-observer reproducibility than inter-laboratory reproducibility. Kappa >0.4: at least moderate reproducibility; kappa >0.6: at least substantial reproducibility.
Best Practices in Staining Protocols
Most centers (>80%) used automated stainers with the most popular being Ventana, Dako, and Leica products. Almost all laboratories employed heat-induced antigen retrieval techniques with citrate (pH 5–7) or EDTA (pH 7–9) buffers. There was no significant difference between buffers, but those laboratories using microwave ovens or retrieval times less than 30 minutes had lower reproducibility. Sixty-eight percent (68%) of the respondents used an antibody to polyomavirus SV40 large T-antigen (clone PAb416) sold by Calbiochem. The remaining centers used similar anti-SV40 antibodies directed against large or small T-antigens (Oncogene, EMD Biosciences, Santa Cruz Biotechnology), whole virion (Lee Biomolecular, Access Biomedical), or VP1 capsid protein (AbCam polyclonal antibody #ab 53977). Antibodies derived from BK and JC virus proteins are also commercially available, but their species specificity has not been rigorously documented and they are not widely use. Antibody dilutions varied from 1:40 to 1:5000. Those using antibody clones other than PAb416 or dilutions higher than 1:100 had less reproducible results. The majority (70%) of laboratories utilized polymer-based detection, which produced better results than avidin-biotin systems.
PCR Analysis
RNA and DNA yield from whole block sections and TMA cores were comparable and only data from the whole block sections are presented here. In general, increasing intra-cellular concentrations of viral RNA and DNA were observed in tissues with more intense or widespread staining, thus validating the histologic scoring system. RNA yield was one to three orders of magnitude lower than DNA. Nevertheless, BKV RNA content per cell correlated moderately well with the percentage (r=0.62, p=0.02) and intensity (r=0.56, p=0.05) of IHC staining, as assessed on the corresponding TMA slide. BKV DNA did not show statistically significant correlation with staining percentage (r=0.11, p=0.73) or intensity (r=0.03, p=0.94). This is expected given that IHC detects viral protein expression rather than DNA load. For staining intensity, the median RNA and DNA copies per cell were 0 and 27 in grade 0, 10 and 2532 in grade A, and 161 and 50900 in grade B (Table 3; no grade C specimens were present in this analysis). For staining percentage, the median RNA and DNA copies per cell were 0 and 27 in grade 0, 6 and 49 in grade 1, 16 and 19402 in grade 2, and 216 and 29313 in grade 3 (Table 3). Detection of BKV DNA in some tissues graded as 0 for staining intensity and percentage is consistent with the superior detection sensitivity of PCR compared to IHC.
Table 3.
Relationship between staining intensity/percentage of tubular nuclei stained and intra-cellular BKV RNA/DNA load1
| Intensity-Only Score | n | BKV RNA copies/cell | BKV DNA copies/cell |
|---|---|---|---|
| 0 | 4 | 0 (0–28) | 27 (0.06–125541) |
| A | 5 | 10 (6–187) | 2532 (49–72690) |
| B | 4 | 161 (17–491) | 50900 (13737–72690) |
| C2 | 0 | n/a | n/a |
| Correlation coefficient (r) | 13 | 0.56 (p=0.05) | 0.03 (p=0.94) |
|
| |||
| Percent-Only Score | n | BKV RNA copies/cell | BKV DNA copies/cell |
|
| |||
| 0 | 4 | 0 (0–28) | 27 (0.06–125541) |
| 1 | 2 | 6 (6–6) | 49 (49–49) |
| 2 | 3 | 16 (10–77) | 19402 (2532–72690) |
| 3 | 4 | 216 (16–491) | 29313 (13737–72690) |
| Correlation coefficient (r) | 13 | 0.62 (p=0.02) | 0.11 (p=0.73) |
Data is presented as median and range.
No grade C specimens were present in this analysis.
DISCUSSION
The need for ongoing proficiency testing and standardization of diagnostic IHC is well recognized and mandated in national and international guidelines (15–17). In this regard, the result of BKV IHC carries significant weight in clinical decision making given that the diagnosis of BKVN cannot be made without it or another method of tissue virus detection, such as PCR. Furthermore, preliminary data presented at the 2013 Banff Conference indicate that quantification of BKV IHC can serve as a staging tool and thus has the potential to guide tailored treatment in individual patients (18). Therefore, respective efforts should be made to optimize BKV IHC reproducibility (7;16).
TMAs were utilized in this study because they provided a mechanism to distribute almost identical trial material to 60 multinational centers in a very efficient manner (7–9;12;19). This trial was designed with two major components to reflect the integral steps of diagnostic immunohistochemistry practice. First, a laboratory trial sought to provide external technical quality assessment by requiring participants stain a standardized TMA. Second, an evaluative trial was conducted to permit quality assessment of stain interpretation.
Although a single positive stained cell is enough to be clinically diagnostic, BKV IHC has been proposed as a criterion for staging patients with confirmed BKVN. A working proposal for BKVN staging developed at the 10th Banff Conference on Allograft Pathology in 2009 included viral replication, as judged by BKV IHC or in-situ hybridization, as a central feature (11). Other proposed staging features include the degree of interstitial fibrosis, tubular atrophy, and tubular epithelial injury. A preliminary reproducibility study involving the independent scoring of 24 renal allograft biopsies by four pathologists working in the same laboratory demonstrated this schema to have moderate inter-observer agreement (20). A subsequent assessment of its clinical predictive value in 71 patients with BKVN suggested that inflammation and fibrosis are more informative prognostic parameters than histologic viral load and tubular epithelial cell injury (21). However, these studies did not address whether IHC staining intensity or percentage is better for assessing viral replication in terms of correlation with molecular viral load. Furthermore, they did not specifically evaluate the reproducibility of the IHC assay. In this regard, the introduction of standardized BKV IHC scoring is advantageous for comparison between studies and centers and therefore the validation of grade-specific treatment protocols. It is generally accepted that detailed standard consensus criteria for histological assessment improves reproducibility, thus making data more comparable (22). However, it is important to be aware that overly complex grading schemas can actually result in poor reproducibility (23).
Overall, we found BKV IHC scoring to have superior inter-institutional reproducibility with individual assessment of staining intensity (κ=0.49) or percentage of positive tubular nuclei (κ=0.42) than with an alpha-numeric scoring system combining the two features (κ=0.25). As expected, the highest degree of reproducibility was associated with the most basic but least informative method of simple positive vs. negative scoring (κ=0.63). Similar relationships between these scoring schemas were seen with inter-laboratory and inter-observer agreement.
Although still superior to combined scoring (κ=0.24), only fair inter-laboratory reproducibility was observed for staining intensity (κ=0.37) and percentage (κ=0.40) as individual scores. This reflects the diversity of BKV IHC staining protocols across different laboratories. The use of numerous antibody clones of varying dilutions represented a significant source for the observed variation. This is underscored by the superior inter-laboratory agreement seen in a parallel BIFQUIT trial for C4d IHC (24). In the C4d trial, all laboratories used the same pre-diluted polyclonal antibody available from a limited number of vendors. Here, two participants using anti-SV40 antibodies directed against VP1 generated false-negative results for the positive control cell line. This is expected given that VP1 is a viral capsid protein distinct from the transfected large T-antigen expressed in the Cos7 cell line. In addition, six participants appear to have shifted rows during evaluation of the TMA, accidentally entering positive results for the negative controls. Re-evaluation by the panel confirmed correct negative staining in these cases. Low outlier kappa values associated with these participants contributed to the inferior inter-laboratory reproducibility and exclusion of these cases from the analysis would improve kappa values by an average of 0.04. As expected, superior inter-laboratory reproducibility was observed for simple positive vs. negative scoring (κ=0.67).
Substantial inter-observer agreement was found for staining intensity (κ=0.74), percentage (κ=0.66), and simple positive vs. negative scoring (κ=0.78). The expert panel assigned generally lower BKV scores than the local participants, suggesting that local pathologists may have adjusted their scoring to their local laboratory. Such local adjustments typically occur over time through the correlation of BKV results with in-house clinical feedback, morphology, and viral titers. Nevertheless, PCR analysis showed BKV RNA and DNA content to progressively increase with the intensity and percentage of IHC staining. These findings support the use of BKV IHC as a surrogate marker for molecular viral load. In clinical practice, some cases with very high intra-renal viral load can test negative with BKV IHC due to sampling error resulting from focal viral replication. It is also important to remember that polyomavirus large T-antigen IHC is not specific for BKV, since JC polyomaviruses also express the large T-antigen. While less likely than technical or sampling error, strong polyomavirus staining with minimal BK viremia should thus prompt consideration of infection with less common viruses like JC.
Based on the technical information provided by each participating laboratory, standardized staining protocol recommendations can be made for BKV IHC on formalin-fixed paraffin-embedded tissue. The optimal protocol would include heat-induced epitope retrieval >30 minutes, citrate or EDTA buffers, monoclonal rather than polyclonal antibodies to large T-antigen (PAb416 being the preferred clone) at a dilution of <1:100 for 25–35 minutes, and polymer-based detection systems for visualization. Furthermore, we found BKV IHC scoring on paraffin sections from renal allograft specimens to be more reproducible with a single-component scoring system (i.e. either staining intensity or percentage alone) as opposed to a combined alpha-numeric schema incorporating both parameters. Selection of one over the other may be of marginal relevance given their similar degree of inter-institutional reproducibility. However, staining percentage demonstrated slightly better correlation with molecular viral load and may therefore represent the preferred option. Overall, the findings of this study corroborate the recent consensus proposal of the Polyomavirus Working Group at the 2013 Banff Conference, which recommended a simplification of BKV IHC scoring to a three-tier schema (pv1–3) assessing only the percentage of tubular nuclei stained, with pv1 as <1%, pv2 as 1–10%, and pv3 as >10% (18). Preliminary data presented at the 2013 Banff Conference indicate that increased viral load in the tissue is associated with inferior outcome. Thus standardized and reproducible staging beyond simple absent/present diagnosis of BKVN has the potential for risk and treatment stratification of individual patients.
Supplementary Material
Design of the BKV BIFQUIT trial.
Acknowledgments
This trial was supported by a research grant from Astellas Canada Inc. to M.M. and in part by NIH grant RO1 AI 51227 to P.R. We thank Victoria Sheldon and Akshatha Raghuveer for outstanding logistical support. We also acknowledge the support of the Banff Foundation for Allograft Pathology, which was established with support from the Roche Organ Transplant Research Foundation (ROTRF).
The following institutions contributed tissue for the BIFQUIT BKV TMA
Volker Nickeleit, Chapel Hill, USA; Verena Bröcker, Hannover, Germany; Parmjeet Randhawa, Pittsburgh, USA; Michael Mengel, Edmonton, Canada; Cinthia Beskow-Drachenberg, Maryland, USA; Surya Seshan, New York, USA.
The authors would like to thank all participants of the BIFQUIT trial for contributing their time and resources, and valuable feedback during and after the trial. We apologize to those participants to whom we were unable to deliver the trial slides (usually due to customs regulations) and those participants from whom we received the slides too late to be reviewed by the panel and included in the analysis.
Centers that registered for the BIFQUIT BKV trial:
Department of Pathology, Methodist Hospital, Houston, TX, USA
University of North Carolina, Department of Pathology and Laboratory Medicine, Division of Nephropathology, Chapel Hill, NC, USA
Ohio State University, Columbus, OH, USA
Oregon Health and Science University, Department of Pathology, Portland, OR, USA
Department of Pathology Dartmouth-Hitchcock Medical Center, Lebanon, NH, USA
University of Illinois Medical Center, Department of Pathology, Chicago, IL, USA
Anatomic Pathology, Laboratory Service, North Florida/South Georgia Veterans Health System, Gainesville, Fl, USA
Huntsman Cancer Hospital University of Utah Department of Pathology, Salt Lake City, UT, USA
Department of Pathology, Cedars-Sinai Medical Center, Los Angeles, CA, USA
University of Virginia Health Sciences Center, Department of Pathology, Charlottesville, VA, USA
Department of Pathology University of Chicago Medical Center, Chicago, IL, USA
Pathology Department London Health Sciences centre, London, Ontario, Canada
Department of Laboratory Medicine St. Michael’s Hospital, Toronto, Ontario, Canada
Washington University School of Medicine, Department of Pathology and Immunology, Division of Anatomic Pathology, St Louis, MO, USA
Department of Pathology University of Maryland Hospital, Baltimore MD, USA
Department of Laboratory Medicine and Pathology Memorial Medical Center, Springfield, IL, USA
Department of Pathology University of Texas Medical Branch Department of Pathology, Galveston, TX, USA
Hospital das Clinicas Prédios dos Ambulatórios Divisão de Anatomia Patológica, São Paulo, Brazil
Hospital Infantil de Mexico “Federico Gomez” Departamento de Patologia Calle, Mexico City, Mexico
Department of Cellular and Anatomical Pathology, Derriford Hospital, Plymouth, UK
Department of Cellular Pathology, John Radcliffe Hospital, Oxford, UK
Department of Clinical and Transplant Pathology Institute for Clinical and Experimental Medicine, Prague, Czech Republic
Department of Pathology Health Sciences Centre, Winnipeg, MB, Canada
Department of Pathology, University Health Network, University of Toronto, Toronto, ON, Canada
Department of Laboratories, Seattle Children’s Hospital, Seattle, WA, USA
ProPath, Dallas, TX, USA
Department of Pathology, Foothills Medical Centre, Calgary, AB, Canada
Pontificia Universidad Católica de Chile Escuela deMedicina Departamento de Anatomía Patológica, Santiago, Chile
Department of Pathology, Oslo University Hospital, Oslo, Norway
Transplantation Laboratory- HUSLAB Helsinki University Central Hospital, Helsinki, Finland
Surgical Pathology Montefiore Medical Center, NY, USA
Division of Transplant Pathology, University of Pittsburgh, Department of Pathology, UPMC-Montefiore Hospital, Pittsburgh, PA, USA
Department of Pathology, Presbyterian Hospital Weill Cornell Medical College, New York, NY, USA
Institut fuer Pathologie Medizinische Hochschule Hannover, Hannover, Germany
Klinisches Institut für Pathologie, Wien, Austria
Department of Pathology, Beth Israel Deaconess Medical Center, Boston, Massachusetts, USA
Department of Pathology Singapore General Hospital, Singapore
Service de Pathologie CHUQ, Hôtel-Dieu de Québec, Québec City, Québec, Canada
Department of Pathology, Princess Margaret Hospital, Hong Kong
Rua Jose Maria de Oliveira Casaca, Bairra Jardim Maria Candida Sao Jose do Rio Preto, SP, Brazil
Department of Pathology, Hadassah Medical Organization, Hadassah University Hospital Kiryat Hadassah, Jerusalem, Israel
Department of Pathology, Emory University Hospital, Atlanta, GA, USA
Department of Cellular Pathology, Barts and the London NHS Trust, London, UK
Department of Pathology, LSU Health Sciences Center, LA, USA
Nephrology Department Hospital Vall d’Hebron, Barcelona, Spain
Department of Pathology, St. John Hospital and Medical Center, Detroit, MI, USA
University of Arizona, Department of Pathology, Tucson, AZ, USA
1st Department of Pathology Medical School National and Kapodistrian, Athens, Greece
Imperial College Healthcare NHS Trust, Hammersmith Hospital, Department of Histopathology, London, UK
Leiden University Medical Center, Department of Pathology, Leiden, The Netherlands
Department of Pathology, Massachusetts General Hospital, Boston, MA, USA
Department of Pathology, University of Washington Medical Center, Seattle, WA, USA
Department of Pathology, Albert Einstein Medical Center, Philadelphia, PA, USA
Intermountain Central Laboratory, Salt Lake City, UT, USA
Department of Pathology, UMC Utrecht, Utrecht, The Netherlands
Pathology & Laboratory Medicine, St. Paul’s Hospital, Vancouver, BC, Canada
Wake Forest University School of Medicine, Department of Pathology, Winston-Salem, NC, USA
Pathology, Mayo Medical Laboratories, Rochester, MN, USA
Department of Pathology, University of Iowa Hospital, Iowa City, IA, USA
Pathologische Ontleedkunde UZ Leuven Campus, Leuven, Belgium
Clinical Pathology and Cytology, Gula Straket, Goteborg, Sweden
Histopathology Department, Mubarak Al Kabeer Hospital, City of Jabriyah, Governate of Hawally, State of Kuwait
Surgical Pathology QA and Compliance, Fletcher Allen Health Care/University of Vermont, Burlington, Vermont, USA
Department of Anatomical Pathology, Austin Hospital, Heidelberg, Australia
Rhode Island Hospital, Providence, RI, USA
Institute of Pathology, Faculty of Medicine, University of Ljubljana, Ljubljana, Slovenia
Cellular Pathology, University Hospitals Birmingham NHS Foundation Trust The Medical School, Birmingham, UK
Department of Histopathology, Postgraduate Institute of Medical Education and Research, Chandigarh, India
Consultant Pathologist MBC, Riyadh, Kingdom of Saudi Arabia
Rua Candido Gaffree, Rio de Janeiro, Brazil
Section of Pathology/Anatomýa Patologica Fundacio Puigvert, Barcelona. Spain
Department of Pathology, Baystate Medical Center, Tufts University School of Medicine, Springfield, MA, USA
Department of Pathology, Medical University of South Carolina, Charleston, SC, USA
Servicio de Anatomia Patologica, Hospital Universitario Miguel Servet, Zaragoza, Spain
Department of Pathology and Laboratory Medicine, University of Wisconsin-Madison, Madison, WI, USA
Institute for Pathology, University Clinic, Basel, Switzerland
Pathology Department, Johns Hopkins Medical Institutions, Baltimore MD, USA
Department of Laboratory Medicine and Pathology, University of Alberta, Edmonton, AB, Canada
Abbreviations
- BIFQUIT
Banff Initiative for Quality Assurance in Transplantation
- BKV
polyomavirus BK
- BKVN
BKV nephropathy
- IHC
immunohistochemistry
- TMA
tissue microarray
Footnotes
DISCLOSURE
The authors of this manuscript have conflicts of interest to disclose as described by the American Journal of Transplantation. Michael Mengel is co-owner of multiblock GmbH (Hannover, Germany), a company producing tissue microarrays and providing services for quality assurance in diagnostic immunohistochemistry. None of the other authors have any conflicts of interest to disclose.
Additional Supplementary Information may be found in the online version of this article.
Reference List
- 1.Brennan DC, Agha I, Bohl DL, Schnitzler MA, Hardinger KL, Lockwood M, et al. Incidence of BK with tacrolimus versus cyclosporine and impact of preemptive immunosuppression reduction. Am J Transplant. 2005;5(3):582–94. doi: 10.1111/j.1600-6143.2005.00742.x. [DOI] [PubMed] [Google Scholar]
- 2.Drachenberg CB, Papadimitriou JC, Hirsch HH, Wali R, Crowder C, Nogueira J, et al. Histological patterns of polyomavirus nephropathy: correlation with graft outcome and viral load. Am J Transplant. 2004;4(12):2082–92. doi: 10.1046/j.1600-6143.2004.00603.x. [DOI] [PubMed] [Google Scholar]
- 3.Hariharan S. BK virus nephritis after renal transplantation. Kidney Int. 2006;69(4):655–62. doi: 10.1038/sj.ki.5000040. [DOI] [PubMed] [Google Scholar]
- 4.Buehrig CK, Lager DJ, Stegall MD, Kreps MA, Kremers WK, Gloor JM, et al. Influence of surveillance renal allograft biopsy on diagnosis and prognosis of polyomavirus-associated nephropathy. Kidney Int. 2003;64(2):665–73. doi: 10.1046/j.1523-1755.2003.00103.x. [DOI] [PubMed] [Google Scholar]
- 5.Hirsch HH, Randhawa P. BK virus in solid organ transplant recipients. Am J Transplant. 2009;9(Suppl 4):S136–S146. doi: 10.1111/j.1600-6143.2009.02904.x. [DOI] [PubMed] [Google Scholar]
- 6.Wadei HM, Rule AD, Lewin M, Mahale AS, Khamash HA, Schwab TR, et al. Kidney transplant function and histological clearance of virus following diagnosis of polyomavirus-associated nephropathy (PVAN) 2. Am J Transplant. 2006;6(5 Pt 1):1025–32. doi: 10.1111/j.1600-6143.2006.01296.x. [DOI] [PubMed] [Google Scholar]
- 7.Goldstein NS, Hewitt SM, Taylor CR, Yaziji H, Hicks DG. Recommendations for improved standardization of immunohistochemistry. Appl Immunohistochem Mol Morphol. 2007;15(2):124–33. doi: 10.1097/PAI.0b013e31804c7283. [DOI] [PubMed] [Google Scholar]
- 8.Mengel M, von Wasielewski R, Wiese B, Rudiger T, Muller-Hermelink HK, Kreipe H. Inter-laboratory and inter-observer reproducibility of immunohistochemical assessment of the Ki-67 labelling index in a large multi-centre trial. J Pathol. 2002;198(3):292–9. doi: 10.1002/path.1218. [DOI] [PubMed] [Google Scholar]
- 9.Mengel M, Kreipe H, von Wasielewski R. Rapid and large-scale transition of new tumor biomarkers to clinical biopsy material by innovative tissue microarray systems. Appl Immunohistochem Mol Morphol. 2003;11(3):261–8. doi: 10.1097/00129039-200309000-00010. [DOI] [PubMed] [Google Scholar]
- 10.Mengel M, Sis B, Haas M, Colvin RB, Halloran PF, Racusen LC, et al. Banff 2011 Meeting Report: New Concepts in Antibody-Mediated Rejection. Am J Transplant. 2012;12(3):563–70. doi: 10.1111/j.1600-6143.2011.03926.x. [DOI] [PMC free article] [PubMed] [Google Scholar]
- 11.Sis B, Mengel M, Haas M, Colvin RB, Halloran PF, Racusen L, et al. Banff ’09 Meeting Report: Antibody Mediated Graft Deterioration and Implementation of Banff Working Groups. Am J Transplant. 2010;10(3):464–71. doi: 10.1111/j.1600-6143.2009.02987.x. [DOI] [PubMed] [Google Scholar]
- 12.Mengel M, Hebel K, Kreipe H, von Wasielewski R. Standardized on-slide control for quality assurance in the immunohistochemical assessment of therapeutic target molecules in breast cancer. Breast J. 2005;11(1):34–40. doi: 10.1111/j.1075-122X.2005.21445.x. [DOI] [PubMed] [Google Scholar]
- 13.Altman DG, Bland JM. Measurement in medicine: the analysis of method comparison studies. Statistician. 1983;32:307–17. [Google Scholar]
- 14.Landis JR, Koch GG. The measurement of observer agreement for categorical data. Biometrics. 1977;33(1):159–74. [PubMed] [Google Scholar]
- 15.Taylor CR. New revised Clinical and Laboratory Standards Institute Guidelines for Immunohistochemistry and Immunocytochemistry. Appl Immunohistochem Mol Morphol. 2011;19(4):289–90. doi: 10.1097/PAI.0b013e31821b505b. [DOI] [PubMed] [Google Scholar]
- 16.Torlakovic EE, Riddell R, Banerjee D, El-Zimaity H, Pilavdzic D, Dawe P, et al. Canadian Association of Pathologists-Association canadienne des pathologistes National Standards Committee/Immunohistochemistry: best practice recommendations for standardization of immunohistochemistry tests. Am J Clin Pathol. 2010;133(3):354–65. doi: 10.1309/AJCPDYZ1XMF4HJWK. [DOI] [PubMed] [Google Scholar]
- 17.Wasielewski R, Hasselmann S, Ruschoff J, Fisseler-Eckhoff A, Kreipe H. Proficiency testing of immunohistochemical biomarker assays in breast cancer. Virchows Arch. 2008;453(6):537–43. doi: 10.1007/s00428-008-0688-4. [DOI] [PubMed] [Google Scholar]
- 18.Haas M, Sis B, Racusen LC, Solez K, Glotz D, Colvin RB, et al. Banff 2013 meeting report: inclusion of c4d-negative antibody-mediated rejection and antibody-associated arterial lesions. Am J Transplant. 2014;14(2):272–83. doi: 10.1111/ajt.12590. [DOI] [PubMed] [Google Scholar]
- 19.von Wasielewski R, Mengel M, Wiese B, Rudiger T, Muller-Hermelink HK, Kreipe H. Tissue array technology for testing interlaboratory and interobserver reproducibility of immunohistochemical estrogen receptor analysis in a large multicenter trial. Am J Clin Pathol. 2002;118(5):675–82. doi: 10.1309/URLK-6AVK-331U-0V5P. [DOI] [PubMed] [Google Scholar]
- 20.Sar A, Worawichawong S, Benediktsson H, Zhang J, Yilmaz S, Trpkov K. Interobserver agreement for Polyomavirus nephropathy grading in renal allografts using the working proposal from the 10th Banff Conference on Allograft Pathology. Hum Pathol. 2011;42(12):2018–24. doi: 10.1016/j.humpath.2011.03.008. [DOI] [PubMed] [Google Scholar]
- 21.Masutani K, Shapiro R, Basu A, Tan H, Wijkstrom M, Randhawa P. The Banff 2009 Working Proposal for polyomavirus nephropathy: a critical evaluation of its utility as a determinant of clinical outcome. Am J Transplant. 2012;12(4):907–18. doi: 10.1111/j.1600-6143.2012.03993.x. [DOI] [PMC free article] [PubMed] [Google Scholar]
- 22.Mengel M, Sis B, Halloran PF. SWOT analysis of Banff: Strengths, Weaknesses, Opportunities, and Threats of the international Banff consensus process and classification system for renal allograft pathology. Am J Transplant. 2007;7(10):2221–6. doi: 10.1111/j.1600-6143.2007.01924.x. [DOI] [PubMed] [Google Scholar]
- 23.Furness PN, Taub N, Assmann KJ, Banfi G, Cosyns JP, Dorman AM, et al. International variation in histologic grading is large, and persistent feedback does not improve reproducibility. Am J Surg Pathol. 2003;27(6):805–10. doi: 10.1097/00000478-200306000-00012. [DOI] [PubMed] [Google Scholar]
- 24.Mengel M, Chan S, Climenhaga J, Kushner YB, Regele H, Colvin RB, et al. Banff initiative for quality assurance in transplantation (BIFQUIT): reproducibility of C4d immunohistochemistry in kidney allografts. Am J Transplant. 2013;13(5):1235–45. doi: 10.1111/ajt.12193. [DOI] [PubMed] [Google Scholar]
Associated Data
This section collects any data citations, data availability statements, or supplementary materials included in this article.
Supplementary Materials
Design of the BKV BIFQUIT trial.