

Abstract
Rationale
Diabetes increases cardiovascular disease risk in humans and remains elevated despite cholesterol-lowering therapy with statins. Consistent with this, in mouse models diabetes impairs atherosclerosis plaque regression after aggressive cholesterol-lowering. miR33 is a key negative regulator of the reverse cholesterol transport factors, ABCA1 and HDL, which suggested that its inhibition may overcome this impairment.
Objective
To assess the effects of miR33 inhibition on atherosclerosis regression in diabetic mice.
Methods and Results
Reversa mice, which are deficient in the LDL receptor and in which hypercholesterolemia is reversed by conditional inactivation of the microsomal triglyceride transfer protein (Mttp) gene, were placed on an atherogenic diet for 16 weeks, then either made diabetic by STZ injection or kept normoglycemic. Lipid-lowering was induced by Mttp inactivation and mice were treated with anti-miR33 or control oligonucleotides. Whereas regression was impaired in diabetic mice treated with control oligonucleotides, anti-miR33 treatment decreased plaque macrophage content and inflammatory gene expression in these mice. The decreased macrophage content in anti-miR33-treated diabetic mice was associated with a blunting of hyperglycemia-induced monocytosis and reduced monocyte recruitment to the plaque, which was traced to an inhibition of the proliferation of bone marrow monocyte precursors associated with the upregulation of their Abca1.
Conclusions
miR33 inhibition overcomes deleterious effects of diabetes in atherosclerosis regression in mice, which suggests a therapeutic strategy in diabetic patients, who remain at elevated cardiovascular disease risk despite plasma cholesterol lowering.
Keywords: Atherosclerosis, diabetes mellitus, regression, miR33, high-density lipoprotein, microRNA
INTRODUCTION
Diabetes increases the clinical risk of cardiovascular morbidity and mortality. This risk remains elevated with conventional LDL-cholesterol lowering therapies, such as statins1. In the FIELD study, type 2 diabetic patients with mixed dyslipidemia (high triglycerides and low HDL-cholesterol (HDL-C)) showed the most benefit of combination fenofibrate/statin therapy, suggesting the importance of raising HDL-C in these patients2. In mouse models, diabetes dramatically accelerates the progression of atherosclerosis3 and we have shown that it inhibits atherosclerosis regression following aggressive LDL reduction. This was due to increased monocyte infiltration and macrophage burden in the plaque compared to non-diabetic mice4, 5. The plaque macrophages from diabetic mice also exhibited an M1 inflammatory phenotype, unlike the M2 inflammation-resolving/tissue remodeling macrophages we have typically found in regressing plaques in non-diabetic mice4, 6. These impairments were largely driven by hyperglycemia, as glucose reduction improved the response to lipid lowering5. Notably, this restored regression was associated with reduced circulating monocyte levels as a result of the loss of the proliferative stimulus that hyperglycemia has on monocyte bone marrow progenitor cells5.
In non-diabetic atherosclerotic mice, increasing the plasma level of HDL by providing apoA1 (by transgenesis7 or infusion8) or by anti-miR33 treatment9 promotes plaque regression with an enrichment of macrophages expressing anti-inflammatory M2 markers. An important component of this beneficial effect of HDL is ascribed to its ability to promote cholesterol efflux from macrophages in the plaque. This process is mediated by the ABC transporters, ABCA1 and ABCG1, which provide cholesterol to lipid-poor and spherical HDL particles, respectively. In the liver, ABCA1 also provides phospholipids to newly secreted apoA1 to generate nascent lipid-poor HDL particles. We have previously shown that Abca1 and Abcg1 mRNAs are both targets of miR3310 and that treatment of Ldlr−/− mice with anti-miR33 up-regulated ABCA1 in the liver and macrophages and resulted in plaque regression9. Taken with our findings that both Abca1 and Abcg1 are down-regulated by hyperglycemia11, which may contribute to impaired regression of atherosclerosis in diabetic mice after plasma lipid lowering, this made anti-miR33 treatment an attractive candidate for overcoming this impairment.
To test this hypothesis, we turned to the Reversa mouse, which we have reported to be a model of atherosclerosis regression12. To create a regression environment after plaques develop, the hyperlipidemia of the LDL receptor knockout (Ldlr−/−) mouse is suppressed by the conditional inactivation of the microsomal triglyceride transfer protein gene (Mttp), which shuts down the secretion by the liver of VLDL (the precursor of LDL). As clinical studies show that atherosclerotic plaque formation starts before the onset of diabetes13, our protocol was to first establish atherosclerosis by placing mice on a western diet for 16 weeks, and then inducing diabetes with streptozotocin (STZ) in a subset of mice. We then tested the effects of anti-miR33 (or control oligonucleotides) in both normoglycemic and diabetic mice after plasma lipid normalization.
Consistent with our previous results4, regression was impaired by diabetes in control oligonucleotide treated mice, but inhibition of miR33 caused a significant decrease in the content and inflammatory state of plaque macrophages. These beneficial effects of anti-miR33 therapy were associated with changes in the population of circulating monocytes and their bone marrow precursors, as will be presented. Overall, the results suggest that targeting of miR33 may improve cardiovascular risk reduction by statins and other lipid-lowering therapies in patients with hyperglycemia.
METHODS
Animals
Reversa mice (Ldlr−/−; ApoB100/100; Mttpfl/fl; Mx1-Cre+/+) 14 and C57Bl6J were cared for in accordance with the National Institutes of Health guidelines and the New York University Institutional Animal Care and Use Committee (Protocol 090908). Reversa pups were weaned at 4–5 weeks and placed on a western diet (21% (wt/wt) fat, 0.15% cholesterol (Research Dyets)) to allow the development of atherosclerotic plaques. After 15 weeks, mice were injected i.p. daily with STZ (50 mg/kg, Sigma-Aldrich) or citrate buffer for 5 days to induce diabetes or serve as a control. One week later, all mice were switched to a chow diet. Following the diet switch Reversa mice were injected i.p. with polyinosinic polycytidylic RNA (pIpC) (Sigma-Aldrich 15 mg/kg) every other day for a total of four injections4. Mice were then treated subcutaneously 4 times with the anti-sense oligonucleotides (ASO) anti-miR33 or the ASO control (Regulus Therapeutics, 10mg/kg) as previously described9. Regulus Therapeutics provided 2′ fluoro/methoxyethyl (2′F/MOE) modified, phosphorothioate backbone modified anti-miR33 (TGCAATGCAACTACAATGCAC) and mismatch control (TCCAATCCAACTTCAATCATC) anti-miR. At sacrifice, mice were anesthetized with xylazine/ketamine and blood was collected via cardiac puncture for plasma analyses. Mice were perfused with PBS, followed by 10% sucrose in PBS. Aortic roots were embedded in OCT medium and frozen immediately, and tissues were snap-frozen under liquid nitrogen and stored at −80°C until further use.
Plasma lipoprotein analyses
Total cholesterol, HDL-cholesterol (HDL-C), and triglyceride (TG) concentrations were measured using colorimetric assays (all kits from Wako Diagnostics, Richmond, VA). Glycemia was measured after 4 hours of fast with a blood glucometer (Freestyle lite, Roche).
Histochemical analyses
Aortic roots were harvested, frozen in OCT, and serial-sectioned at a thickness of 6 μm onto glass slides. For immunostaining of CD68 (macrophage marker), slides were fixed in 100% acetone and exposed to primary anti-CD68 antibody (Serotec), followed by biotinylated secondary antibody (Vector Laboratories), with visualization using a Vectastain ABC kit (Vector Laboratories). Microscopic images of aortic root sections were digitized, and morphometric measurements were performed using Image Pro Plus software (Micro Optical Solutions).
For collagen content, tissues were stained with picrosirius red and quantified with Image Pro Plus software using polarizing light microscopy.
Necrosis analysis
Necrosis, an indicator of the effectiveness of efferocytosis, was quantified in aortic roots from Reversa mice by measuring the acellular areas of plaques with Image Pro Plus software15.
Apoptosis analysis
Apoptosis was analyzed in aortic roots from Reversa mice by TUNEL method using an in situ cell detection kit (Roche Diagnostics). Nuclei were labeled with Vectashield Mounting media with DAPI (Vector labs). Only TUNEL positive cells that colocalized with DAPI-stained nuclei were considered apoptotic.
Laser capture microdissection
CD68+ cells were isolated from atherosclerotic plaques by laser capture micro-dissection (LCM) 16, 17. All LCM procedures were performed under RNase-free conditions. Aortic root sections were stained with hematoxylin-eosin and captured from 36 frozen sections. After LCM, RNA was isolated using the PicoPure Kit (Molecular Devices), and quality and quantity were determined using an Agilent 2100 Bioanalyzer (Agilent Technologies). RNA was converted to cDNA and amplified using the WT-Ovation Pico RNA Amplification Kit (NuGEN). Real-time PCR was performed with 5ng of amplified cDNA using the ABI PRISM 7300 sequence detection system (Applied Biosystems). Gene expression was assessed using the ΔΔCt calculation method.
Monocyte tracking
Monocytes were labeled as previously described18, 19. Briefly, 1μm Fluoresbrite FITC-dyed (YG) plain microspheres (Polysciences Inc.) were diluted in PBS (1:4), and 250μl of the solution was injected into the retro-orbital vein of mice to label circulating Ly6Clo monocytes. For the egress study, beads were injected at week 14 before any treatment. For the recruitment study, beads were injected 24h prior to harvesting. For both protocols, bead labeling efficiency was assessed by flow cytometry, 24h after bead injection18, 19.
Flow cytometry
Blood Leukocytes
Blood was collected via retro orbital bleeding with EDTA-coated capillaries. Red blood cells were lysed with RBL buffer (Sigma Aldrich), and blocking achieved with anti-mouse CD16/CD32 (eBioscience). Monocytes were identified by staining with PE anti-mouse CD115 (Biolegend) and APC anti-mouse Ly-6G/Ly-6C (Biolegend)18, 19. Neutrophils were identified as CD45hiCD115loLy6-C/Ghi cells. Flow cytometry was performed using a LSRII analyzer.
Hematopoietic stem and progenitor cells
Hematopoietic stem and progenitor cells were analyzed by flow cytometry as previously described5, 20. Briefly, bone marrow was harvested from femurs and tibias, and red blood cells were lysed with BD Pharm Lyse (BD Biosciences). Cells were incubated with a cocktail of antibodies against lineage-committed (lin) cells (B220, CD19, CD11b, CD3e, TER-119, CD2, CD8, CD4, Ly6-C/Ly6-G, all FITC) and markers to identify the stem and progenitor cells that were identified as LSK (lin−, Sac1+, and ckit+), CMP (lin−, Sca1−, ckit+, CD34int, and FcγRIIint/FcγRIIIint), and GMP (lin−, Sca1−, ckit+, CD34int, and FcγRIIhi/FcγRIIIhi). Cell cycle analysis was performed using DAPI (Sigma Aldrich) to measure cells in the S-G2M phase, G0 and sub-G0 (apoptotic). Flow cytometry was performed using an LSR II (for analysis) or MoFlo (for sorting). All flow cytometry data were analyzed using FlowJo X software (Tree Star). RNA from sorted cells was extracted with RNeasy Micro kit (Qiagen) and cDNA was obtained with SuperScript VILO (Life Technologies).
Statistical analysis
For atherosclerosis and immunohistochemical analyses, all comparisons were made using a 1-way ANOVA (P≤0.05), and data are expressed as mean ± SEM.
RESULTS
Anti-miR33 increases HDL-C and target gene expression in livers of diabetic mice
To assess the effects of miR33 inhibition on atherosclerosis regression in a hyperglycemic environment, Reversa mice were fed a western diet (WD; 21% fat, 0.15% cholesterol) for 16 weeks to allow complex plaques to develop (see Figure 1A for a schematic depiction of the overall protocol). At 15 weeks, mice were given daily (i.p.) injections for 5 consecutive days with citrate buffer or 50 mg/kg streptozotocin (STZ) to induce diabetes4. At 16 weeks, all mice were switched to a standard chow diet (6% fat) and injected i.p. four times every other day with pIpC to conditionally delete the Mttp gene and induce lipid lowering. Mttp deletion resulted in effective cholesterol lowering compared to baseline levels (baseline: 863±47 mg/dL to 83–101 mg/dL in the experimental groups; Table 1). The reduction in total cholesterol levels was independent of STZ or anti-miR (control or miR33) treatment.
Figure 1. α-miR33 treatment derepresses its target genes in the liver of Reversa mice.

(A) Experimental design: Reversa mice were placed on a western diet for 16 weeks. At 15 weeks, the mice received 5 injections of citrate (control) or 50mg/kg streptozotocin (diabetic). At 16 weeks, all mice were switched to a chow diet and received polyinosinic polycytidylic RNA (pIpC) 15 mg/kg every other day for a total of four injections to initiate lipid lowering. Mice then received weekly (s.c) injections of either control anti-miR or anti-miR33 2’F/MOE oligonucleotides (10mg/kg) for 4 weeks, prior to sacrifice (i.e 4 weeks post the final pIpC injection). Hepatic expression of (B) Abca1, (C) Abcg1, (D) Cpt1 and (E) Hmgcr. # p≤0.05 vs. con α-miR normoglycemic; * p≤0.05, *** p≤0.001 vs. con α-miR diabetic.
Table 1. Plasma characteristics of Reversa mice after 5 weeks of α-miR control or α-miR33 treatment.
Glycemia, total plasma cholesterol, HDL-C and triglyceride levels were obtained after 16 weeks of diet (baseline) and at sacrifice.
| Normoglycemic | Diabetic | ||||
|---|---|---|---|---|---|
|
| |||||
| mg/dL | Baseline | Con α-miR | α-miR33 | Con α-miR | α-miR33 |
| Glucose | - | 113±10 | 116±6 | 410±35*** | 365±29*** |
| TC | 863±46 | 101±14 | 93±10 | 83±13 | 94±9 |
| HDL-C | 35±3 | 25±3 | 33±3# | 35±2 | 50±6* |
| TG | - | 30±6 | 31±5 | 52±5# | 64±11# |
All data are expressed as mean ± SEM (n>10).
p≤0.05 vs. con α-miR normoglycemic;
p≤0.05,
p≤0.001 vs. con α-miR diabetic.
Following pIpC injections, mice were treated weekly by subcutaneous injection with either miR33 or control ASOs. After 4 weeks, anti-miR33 treatment increased HDL-C by 30% (p≤0.05) and 42% (p≤0.05) in the normoglycemic and in the diabetic groups, respectively (Table 1). Anti-miR33 treatment did not affect the blood glucose levels of either the normoglycemic or diabetic mice when compared to the corresponding ASO control-treated mice (Table 1). Consistent with previous observations in mouse models21 and diabetic patients22, plasma triglyceride levels were increased by hyperglycemia; no effect of anti-miR33 on triglyceride levels was observed when compared to control ASO treated mice (Table 1).
The efficacy of miR33 inhibition was evaluated by measuring the expression of known target mRNAs in the liver. As previously reported10, anti-miR33 treatment significantly increased Abca1 mRNA expression (p≤0.05) in normoglycemic mice (Figure 1B). Furthermore, although Abca1 mRNA was reduced by almost 50% (p≤0.05) in the livers of hyperglycemic mice, anti-miR33 treatment restored Abca1 expression to the level seen in normoglycemic anti-miR33 treated mice (Figure 1B). Abcg1 expression in the livers of diabetic mice was modestly reduced compared to normoglycemic mice (Figure 1C). Anti-miR33 treatment increased Abcg1 mRNA levels by 1.5-fold (p≤0.05) in the diabetic mice, whereas no effect of anti-miR33 was observed in normoglycemic mice. Levels of Cpt1 mRNA, another miR33 target gene, were also increased by anti-miR33 treatment in both normo- and hyperglycemic mice (p≤0.05; Figure 1D). Non-miR33 target genes, such as HMG-CoA reductase, were not affected by anti-miR33 treatment (Figure 1E), although its expression was increased in the diabetic mice (p≤0.05; Figure 1E), as previously reported23.
Anti-miR33 reduces plaque macrophage content in diabetic mice after plasma lipid lowering
Anti-miR33 treatment has been shown to promote plaque regression in Ldlr−/− mice fed WD for 16 weeks, and then switched to chow for the duration of treatment (4 weeks). This beneficial effect of anti-miR33 was associated with increased HDL-C and reverse cholesterol transport, presumably as a consequence of greater Abca1 expression in liver and plaque macrophages9. Consistent with our previous findings4, we observed that diabetes impaired plaque regression after lowering of plasma cholesterol as reflected by the decrease in plaque macrophage content (CD68+ cells) in the normoglycemic group (p≤0.001), but not in the diabetic group (Figure 2). Anti-miR33 treatment restored plaque regression in the diabetic group, and reduced macrophage content to the same level observed in normoglycemic mice. Interestingly, anti-miR33 treatment did not further reduce plaque macrophage content in the non-diabetic group, suggesting that in the absence of hyperglycemia, the reduction in plasma cholesterol level alone was sufficient to drive this process, as shown by the ~50% decrease of plaque CD68 content compared to baseline (Figure 2; Baseline 52% vs. Regression + anti-miR33 26±2.2%, p≤0.05). As we have observed previously4, reduction in macrophage content did not result in changes in total plaque area (Online Figure I), which has been shown to be from increases in plaque collagen content in the regressing plaque. Consistent with this, anti-miR33 treatment increased the plaque collagen content in the diabetic group, restoring it to the same level observed in normoglycemic mice (Figure 2B). Together, these data suggest that anti-miR33 treatment promotes a remodeling of the diabetic plaque towards a more stable-appearing phenotype.
Figure 2. α-miR33 treatment restores regression in diabetic mice.

Aortic roots from baseline and the regression groups were sectioned, fixed and stained for (A) CD68 and (B) collagen. Representative pictures of (A) CD68 immunostaining (magnification ×20) and (B) picrosirius red staining (under white and polarized light) of collagen (magnification ×10) are shown for each group. The areas of the plaques occupied by CD68+ cells and collagen (the latter as detected by polarized light) were quantified by Image Pro Plus Software and displayed in the graphs. Results are expressed as the percentage of plaque area. ^ p≤0.05 vs. baseline, # p≤0.05, ### p≤0.001 vs. con α-miR normoglycemic; *** p≤0.001 vs. α-miR33 diabetic.
Anti-miR33 treatment favorably alters plaque macrophage inflammatory phenotype in diabetic mice after plasma lipid lowering
We next assessed the effects of anti-miR33 on the phenotype of diabetic plaque macrophages by analyzing mRNA expression of laser-captured cells. Consistent with our previous findings4, 5, macrophages in the plaques from control anti-miR treated diabetic mice showed a pattern of gene expression predominantly of the inflammatory M1 phenotype (e.g. increased Il1β, Tnfα) and also had reduced expression of Abca1 (Table 2). Notably, anti-miR33 treatment of diabetic mice reduced mRNAs of M1 macrophage-related genes (Il1β, Tnfα, Nos2) and increased those of anti-inflammatory M2 macrophage-related genes (Ym1, Cd206). Furthermore, treatment with anti-miR33 restored levels of macrophage Abca1 mRNA in the diabetic group to that observed in normoglycemic mice (Table 2). These findings suggest that anti-miR33 treatment dampened the persistent inflammation in the plaque associated with hyperglycemia.
Table 2. Gene expression analysis of laser-captured plaque CD68+ cells.
CD68+ cells from aortic plaques of Reversa mice were isolated using LCM. mRNA was isolated, amplified and analyzed by RT-PCR. mRNA levels are presented as relative levels normalized to HPRT.
| Normoglycemic | Diabetic | ||||
|---|---|---|---|---|---|
|
| |||||
| Con α-miR | α-miR33 | Con α-miR | α-miR33 | ||
| α-miR33 targets | Abca1 | 116±21 | 96±11 | 61±7# | 110±12* |
| Abcg1 | 115±25 | 111±15 | 146±19 | 116±20 | |
|
| |||||
| M2 | Cd206 | 129±44 | 223±70 | 108±23 | 192±49 |
| Ym1 | 252±115 | 2479±1588# | 92±30 | 527±170* | |
|
| |||||
| M1 | Tnfα | 116±27 | 87±14 | 236±75 | 99±22 |
| Il1β | 138±40 | 90±21 | 304±74# | 63±12* | |
| Nos2 | 159±63 | 121±54 | 179±54 | 43±15 | |
|
| |||||
| Trafficking | Ccr2 | 122±26 | 153±60 | 349±77# | 126±16* |
| Ccr5 | 124±27 | 119±13 | 154±26 | 120±27 | |
| Ccr7 | 137±33 | 189±80 | 139±50 | 131±41 | |
| Netrin-1 | 123±38 | 188±46 | 195±45 | 155±41 | |
| Unc5b | 113±23 | 139±25 | 121±19 | 117±32 | |
|
| |||||
| Adhesion | Vcam1 | 103±12 | 138±27 | 2537±51# | 110±16* |
| Icam1 | 113±27 | 144±37 | 269±56 | 185±30 | |
Data are expressed as mean ± SEM (n≥6 per group).
p≤0.05 vs. con α-miR normoglycemic;
p≤0.05 vs. con α-miR diabetic.
Anti-miR33 treatment reduces plaque monocyte recruitment, but does not change macrophage egress
A decrease in macrophage content in the regressing plaque could be due to reduced recruitment of monocytes to the plaque, loss of macrophages through egress (regulated by retention and chemotaxis), or macrophage death6. To investigate the mechanisms underlying the reduction in macrophages in diabetic plaques by anti-miR33 treatment, we used an in vivo bead-labeling technique 12, 19 to assess monocyte recruitment and macrophage egress. To measure the recruitment of monocytes, mice were injected with fluorescent latex beads 24h before the harvesting of aortic roots and the number of beads in the plaques counted. Monocyte labeling was not affected by either diabetes or anti-miR treatment, indicating that neither condition had a significant effect on the phagocytic ability of circulating monocytes (Online Figure II). Hyperglycemia was associated with a 60% increase in monocyte recruitment to the plaque (p≤0.01; Figure 3B), consistent with our previous observations in another model of regression5. Notably, anti-miR33 treatment prevented this diabetes-induced increased recruitment of monocytes (p≤0.01; Figure 3B). Although these results could be attributed in large part to changes in the circulating number of monocytes (see below), studies in vitro suggested that anti-miR33 treatment could also have caused an intrinsic decrease in monocyte/macrophage chemotaxis in a hyperglycemic environment (Online Figure IIIA & IIIB).
Figure 3. α-miR33 treatment affects monocyte trafficking to the plaque.

Experimental design for monocyte trafficking. (A) Reversa mice were injected with fluorescent latex beads either 24h prior to harvesting (week 21) for the recruitment protocol or at week 14 of western diet for the egress protocol. (B) To assess monocyte recruitment mice were injected with fluorescent latex beads 24h prior to sacrifice, and beads counted in the aortic root. Data are expressed as mean ±SEM (n≥6 per group). ## p≤0.01 vs. con α-miR normoglycemic ** p≤0.01 vs. con α-miR diabetic. (C) To assess macrophage retention mice were injected with fluorescent latex beads at week 14, and the number of beads remaining at sacrifice used to assess macrophage retention (baseline was established 1 week post bead injection). Data are expressed as mean ±SEM (n≥6 per group). ^^^ p≤0.001 vs. baseline. (D) Quantitative analysis of TUNEL+DAPI+ cells per section in the aortic root, after regression. Results are expressed as the percentage of total cells per plaque ±SEM (n=4 per group). (E) Quantitative analysis of necrotic core area as a percentage of total plaque area ±SEM (n≥6 per group) # p≤0.5 vs. con α-miR normoglycemic * p≤0.01 vs. con α-miR diabetic.
To study macrophage egress, we injected fluorescent beads prior to the induction of diabetes or anti-miR treatment (week 14, Figure 3A). One week after bead injection, a group of mice was sacrificed to obtain baseline measurements of the content of labeled macrophages (i.e. CD68+ cells co-localized with beads) in aortic root plaques. As in the experiment described above, additional mice were then treated with STZ, pIpC and anti-miR (control or miR33, Figure 3A), and the beads remaining in the aortic root plaques at sacrifice were quantified. Reversal of hyperlipidemia was associated with a reduction in plaque bead content to ~50% of baseline independent of the treatment (p≤0.001; Figure 3C). These results suggest that though macrophages were actively leaving the plaque during regression, this process was not differentially affected by diabetes or anti-miR33 treatment. Consistent with this was the lack of significant changes in the plaque macrophage expression of the chemotactic factor Ccr724 or of the retention factor24 Netrin-1 and its receptor, Unc5b25 (Table 2).
Anti-miR33 treatment does not affect plaque macrophage apoptosis, but does increase efferocytosis
Plaque macrophage content can also be modulated by apoptosis, but we did not observe any significant differences in this among the groups as measured by TUNEL analysis (Figure 3D). Diabetes, however, promoted an increase in the area occupied by necrotic cores, which negatively reflects the level of efferocytotic activity15, compared to plaques from regressing normoglycemic mice (Figure 3E, p≤0.05), similar to its effects in progression26. Notably, anti-miR33 treatment of diabetic mice significantly reduced the plaque necrotic area to that of normoglycemic mice (Figure 3E, p≤0.05), suggesting that diabetes-associated deficiencies in efferocytosis were corrected.
Anti-miR33 treatment reduces hyperglycemia-induced monocytosis, but not neutrophilia
The increased recruitment of monocytes in the diabetic mice after plasma lipid reduction may be a consequence of the higher numbers of circulating monocytes observed in mice that have hyperglycemia, which are also elevated with hypercholesterolemia18–20. Indeed, in the present study, plasma lipid lowering induced a significant decrease in the level of monocytes (expressed as their % of circulating leukocytes) compared to baseline (p≤0.001; Figure 4A, B). Lipid lowering, however, had no effect on the monocyte levels in the control anti-miR treated diabetic group, likely due to the increased monocyte precursor proliferation via glucose-dependent mechanisms5. In contrast, anti-miR33 treatment decreased monocyte levels in the diabetic mice to levels comparable to the non-diabetic mice (p≤0.001; Figure 4A, B).
Figure 4. α-miR33 treatment decreases monocytosis in diabetic mice.

Total monocytes and neutrophils were analyzed by flow cytometry in the blood at 16 weeks of diet (baseline) or after treatment. (A) Representative flow cytometry plots. Quantification of (B) monocytes and (C) neutrophils. Data are expressed as mean ±SEM (n≥10 per group). ^^p≤0.01, *** p≤0.001 vs. baseline.
In addition to the monocytosis, hyperglycemia induced neutrophilia, as we previously observed5, but this was not affected by cholesterol lowering in the regression period or by anti-miR33 treatment (Figure 4C).
Anti-miR33 treatment reduces bone marrow monocyte progenitors in diabetic mice
We previously showed that diabetes induces myelopoiesis in the bone marrow (BM)5, and it has also been shown that the membrane content of cholesterol, as influenced by cholesterol efflux-related genes and plasma cholesterol levels, positively regulates myeloid cell production by increasing BM progenitor cell proliferation20, 27, 28. Because the anti-miR33 treatment is given concurrent with plasma lipid lowering, to study the effects of anti-miR33 on BM progenitors, we used normolipidemic C57Bl/6J (WT) mice, to avoid the confounding effects of hypercholesterolemia20.
A group of mice were made diabetic with STZ and treated with control anti-miR or anti-miR33 weekly for 4 weeks as before. Treatment with the control anti-miR or anti-miR33 had no effect on blood glucose levels (Figure 5A) or on plasma levels of total cholesterol and triglycerides (Online Figure IVA and IVB). As expected, anti-miR33 significantly increased HDL-C in both diabetic and normoglycemic mice (Figure 5B, Online Figure IVB). Consistent with our previous findings5, hyperglycemia induced an increase in the abundance and proliferation of both common myeloid (CMP) and granulocyte-macrophage progenitor cells (GMP), without affecting the stem cells (LSK) (Figure 5C & D). This was accompanied by a reduction of CMP and GMP, but not LSK in the G0 phase, confirming entry into the proliferative cell cycle (Online Figure VA). Importantly, the reduction in the abundance and proliferation of myeloid precursors with anti-miR33 in the diabetic mice was not due to enhanced apoptosis (Online Figure VB) or senescence (Online Figure VC).
Figure 5. α-miR33 treatment decreases bone marrow progenitors in diabetic mice.

C57Bl6/J mice were injected with citrate (normoglycemic) or 50mg/kg streptozotocin (diabetic). Mice were then injected 4 times with control α-miR or α-miR33 2’F/MOE oligonucleotides (10mg/kg). (A) Plasma blood glucose and (B) HDL-C 4 weeks post treatment. (C) Hematopoietic stem and progenitor cell populations in the BM were determined by flow cytometry and expressed as a percentage of cells in the BM. (D) Hematopoietic stem and progenitor cell cycle (G2M phase) was assessed by flow cytometry using DAPI. Data are expressed as mean ± SEM, n≥7/group. #p≤0.05, ##p≤0.01 vs. con α-miR normoglycemic; * p≤0.05 con α-miR diabetic.
Treatment with anti-miR33 reduced the expansion and proliferation of the CMP and GMP in the diabetic mice (Figure 5C, 6D), indicating that anti-miR33 acts via glucose-independent mechanisms to inhibit the production of monocytes in diabetes. This effect of anti-miR33 treatment on proliferation of monocyte progenitors, however, was not observed in macrophages in vitro; while there was evidence of their increased proliferation in a hyperglycemic environment, it was not suppressed by anti-miR33 treatment (Online Figure IIIC).
Figure 6. α-miR33 treatment restores Abca1 expression in bone marrow progenitors of diabetic mice.
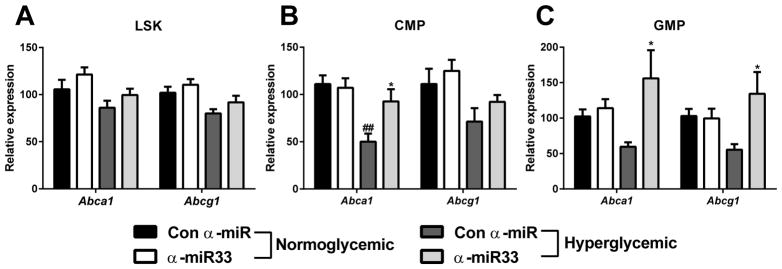
C57Bl6/J mice were injected with citrate (normoglycemic) or 50mg/kg streptozotocin (diabetic). Mice were then injected 4 times with control α-miR or α-miR33 2’F/MOE oligonucleotides (10mg/kg). Gene expression for Abca1 and Abcg1 was assessed by qPCR in the different bone marrow progenitor subsets (A) LSK, (B) CMP and (C) GMP, obtained by cell sorting. Data are expressed as mean ± SEM, n≥7/group. #p≤0.05, ##p≤0.01 vs. con α-miR normoglycemic ;* p≤0.05 vs. con α-miR diabetic.
Anti-miR33 treatment restores ABCA1 and ABCG1 gene expression in bone marrow monocyte progenitor cells
ABCA1 and ABCG1 have been shown to play a crucial role in hematopoietic stem cell proliferation28, 29. We hypothesized that hyperglycemia-induced BM progenitor proliferation was due to a defect of Abca1/Abcg1 expression in the different progenitor subsets, which would increase the plasma membrane cholesterol content of these cells, stimulating their proliferation28. Indeed, as observed in the liver and in plaque macrophages, Abca1 and Abcg1 gene expression was decreased by hyperglycemia in the CMP (Figure 6B) and GMP (Figure 6C), without affecting expression in the LSK population (Figure 6A). Notably, anti-miR33 treatment restored Abca1 expression in both the CMP and GMP subset (Figure 6B, 6C). These results suggest that anti-miR33 may prevent monocytosis at the level of BM progenitor cells, through its upregulation of Abca1 expression in those cells.
DISCUSSION
Diabetic patients after cholesterol lowering remain at higher risk of CVD relative to non-diabetics. Consistent with this, is our finding in two independent mouse models that after cholesterol-lowering, atherosclerosis regression is impaired by hyperglycemia4, 5. Because anti-miR33 treatment regressed plaques in non-diabetic mice9, we reasoned that a similar approach may overcome this impairment. Indeed, our results show that miR33 inhibition confers a number of atheroprotective benefits in the context of hyperglycemia, chief among them being the reduction in the content and inflammatory state of plaque macrophages. This was found to be due to the ability of anti-miR33 to reduce the monocytosis associated with diabetes, which decreased the continued recruitment of monocytes into plaques that occurs even in the face of lipid lowering30. These findings, then, expand the atheroprotective mechanisms of anti-miR33 to the diabetic setting, an area of great clinical importance.
Although we observed, as before12, egress of macrophages after plasma lipid lowering in Reversa mice, this was not further increased by anti-miR33 treatment in either normo- or hyperglycemic mice. The lack of increase in egress associated with anti-miR33 treatment was consistent with the absence of changes in the gene expression of previously identified factors affecting this pathway, including the chemotactic factor Ccr7 or the retention factor Netrin-1. We also observed no changes in plaque macrophage apoptosis and senescence or in macrophage proliferation in vitro with anti-miR33 treatment, but did find evidence for increased efferocytosis, as judged by necrotic core analysis. Thus, the basis for the reduction in plaque macrophage content in the diabetic mice by anti-miR33 appears to derive primarily from decreased recruitment of monocytes into the plaques and increased clearance of apoptotic cells. That recruitment continues in a regression environment has been previously established18, 30, and the present results represent another demonstration that its reduction can contribute to decreased plaque content of macrophages after cholesterol lowering5,18.
As we recently reported in another mouse model, hyperglycemia induces monocytosis due to BM progenitor proliferation, and this in turn results in increased recruitment of these cells to plaques after reduction in the plasma lipid level5. As shown in Figure 4 and 6, anti-miR33 treatment reduced monocytosis and BM progenitor proliferation despite persistence of the hyperglycemia, thereby preventing the expansion of the pool of recruitable cells by hyperglycemia. These findings are related to the report from Yvan-Charvet et al.28 that links cholesterol efflux-related genes in the BM progenitors to their proliferation and subsequent production of monocytes. Yvan-Charvet and colleagues showed that deficiency of Abca1 and Abcg1, even in the non-hyperlipidemic setting, led to monocytosis and leukocyte infiltration into tissues, presumably through changes in plasma membrane cholesterol that affected responsiveness to proliferative factors.28. In the present study, hyperglycemia induced a decrease in Abca1 and Abcg1 expression in the BM progenitors (Figure 6), which would be expected to be a proliferative stimulus. Restoration of Abca1 and Abcg1 expression with anti-miR33 treatment, therefore, would be predicted to normalize BM proliferation and the level of circulating monocytes, just as observed. Because monocytosis is also observed in people with diabetes and correlates with their risk of cardiovascular disease31, it is tempting to speculate that anti-miR33 therapy would be effective in that population to reduce this risk, in part, through similar effects in human bone marrow.
We previously reported that when plasma lipids are lowered, in addition to the reduction in the plaque content of macrophages, the inflammatory state of these cells is also lowered in normoglycemic, but not hyperglycemic, mice4, 7, 12. As also previously reported9, anti-miR33 treatment induces an enrichment in “anti-inflammatory” M2 macrophages. In the present study, consistent with this, and shown in Table 2, miR33 inhibition reversed this adverse effect of hyperglycemia on plaque macrophage inflammation. There are at least two potential bases for this. One could be related to previous findings from the laboratories of Alan Tall32 and John Parks33 that showed that free cholesterol enrichment of the plasma membrane, particularly in lipid-rafts in macrophages with ABCA1-deficiency, leads to enhanced inflammatory signaling via Toll-like receptors (TLRs). That the down-regulation of Abca1 by hyperglycemia and the restoration of its expression by anti-miR33 modulated plaque macrophage inflammatory state through this mechanism is supported by finding that increases in Ccr2, Vcam1 and Icam1, all NF-kB targets downstream of TLR-signaling, were reversed by anti-miR33. Despite Abcg1 also being a NF-kB target34,9, its gene expression was not changed in plaque macrophages or in CMP precursors, suggesting that under our experimental conditions, ABCG1 may be more likely in these cell types to be regulated by post-transcriptional mechanisms.
The other potential basis, particularly for the enrichment in M2 features, is that direct or indirect targets that promote the M2 phenotypic state of macrophages were de-repressed by the anti-miR33 treatment. A previous report35 has also implicated the eicosanoid pathway in the inflammatory process of diabetes-accelerated atherosclerosis. In the present studies, however, we found no significant evidence to suggest this pathway as a mechanism for the effects of anti-miR33 treatment, as judged by the lack of change in the gene expression of the major related enzymes (Acsl1, Pges1, Ptges; data not shown).
It is interesting to compare the benefits of anti-miR33 treatment in atherosclerosis regression to those in progression. Recent studies report conflicting results. Rotllan et al.36 and Horie et al.37 showed that miR33 inhibition, either by therapeutic or by genetic silencing, lead to a delay in plaque progression. Marquart et al.38, however, did not observe any differences in atherosclerosis progression between anti-miR33 treated and control oligonucleotide-treated mice. The major differences between the studies were the oligonucleotide inhibitors of miR33 used and the amount of cholesterol in the diets (0.15%37, 0.3%36 vs. 1.25%38), which resulted in a wide range of plasma cholesterol levels. It appears that when plasma cholesterol was above 1200 mg/dL, anti-miR33 was less able to be atheroprotective.
A qualitatively similar phenomenon may also occur in regression. We have seen in another mouse model of atherosclerosis that anti-miR33 treatment was able to improve the content and inflammatory state of the macrophages in the normoglycemic setting, but in that study, the plasma cholesterol levels were ≥250 mg/dL in the treatment groups9, compared to <100 mg/dL in the present study. The lack of an effect on regression of miR33 inhibition in the normoglycemic group in the present study, then, likely reflects that the plasma cholesterol level was sufficiently low so that no further treatment benefit would be realized unless there was the concurrent stress of hyperglycemia. Thus, like many therapeutics tested for cardiovascular disease risk reduction, there is likely a range of plasma cholesterol levels above which the effects of anti-miR33 treatment are attenuated and below which it cannot exert further improvements, with the range potentially dependent on the presence of co-morbidities.
In conclusion, the present results show for the first time that miR33 inhibition is able to overcome the deleterious effects of hyperglycemia on plaque regression in atherosclerotic mice after their plasma lipids were aggressively lowered. Because we did not test the effects of miR33 inhibition in a setting of hyperglycemia and insulin resistance, the full relevance of our findings to patients with type 2 diabetes mellitus remains to be established. Nevertheless, given that patients with either type 1 and 2 diabetes mellitus both have hyperglycemia and high rates of cardiovascular disease, it is tempting to suggest that anti-miR33 treatment as a promising combination strategy to make statins and other lipid-lowering therapies more effective in these patients to reduce their elevated risk.
Supplementary Material
Novelty and Significance.
What Is Known?
Compared to non-diabetics, diabetic patients have high rates of cardiovascular disease (CVD), low plasma levels of HDL, and attenuated risk reduction after plasma LDL-lowering therapies.
Diabetic mice have impaired atherosclerotics plaque regression after plasma LDL lowering compared to non-diabetic mice, in part from monocytosis associated with hyperglycemia.
miR-33 controls HDL metabolism in mice and non-human primates through regulation of ABCA1, and is considered to be a potential anti-atherosclerosis therapeutic target.
What New Information Does This Article Contribute?
After plasma LDL lowering, diabetic mice treated with anti-miR33 therapy had improved regression of atherosclerosis as indicated by decreases in the plaque content and inflammatory state of macrophages.
Decreased plaque content of macrophages was explained by a reduction in hyperglycemia-associated monocytosis as a result of anti-miR33 treatment and reduced recruitment of monocytes to plaques.
Reduced monocytosis reflected decreased proliferation of bone marrow monocyte precursors (BMP)most likely through upregulation of ABCA1, a factor known to regulate their proliferation.
The overwhelming cause of death in type 1 and 2 diabetic patients is CVD. Though diabetics have shown relative risk reduction in statin intervention trials, their absolute risk remains elevated, making the understanding of this phenomenon an important clinical need. Consistent with the clinical findings, in mouse models we showed that diabetes impairs atherosclerosis regression after aggressive lowering of high LDL levels. This impairment was traced to monocytosis, which drives more monocytes into diabetic plaques. In pre-clinical studies by others, the cholesterol content of the monocyte BMP was positively associated with their proliferation. We now show, for the first time, that anti-miR-33 therapy reduced cellular cholesterol content by increasing ABCA in the diabetic monocyte BMP and decreased BMP proliferation. This prevented diabetic monocytosis and decreased plaque recruitment of monocytes. We previously reported anti-inflammatory effects of anti-miR33 treatment on mouse plaque macrophages, and again observed these effects in diabetes. Thus, by reducing the content and inflammatory state of plaque macrophages after LDL lowering, anti-miR33 treatment was able to improve atherosclerosis regression in diabetic mice.
Acknowledgments
SOURCES OF FUNDING
NIH funding: KJM: R01 HL108182; EAF: R01 DK095684, R01 HL117226, R01 HL084312, P01 HL098055. AJM was supported by post-doctoral fellowship 12POST11890019 from the American Heart Association and a Viertel award from Diabetes Australia Research Trust.
Nonstandard Abbreviations and Acronyms
- ABCA1
ATP-binding cassette transporter A1
- ABCG1
ATP-binding cassette transporter G1
- ASO
Anti-sense oligonucleotides
- BM
Bone marrow
- CMP
Common myeloid progenitor
- GMP
Granulocyte-macrophage progenitor
- LSK
Lin−, Sac1+, ckit+ stem cells
- LCM
Laser capture micro-dissection
- miR33
microRNA 33
- Mttp
Microsomal triglyceride transfer protein
- pIpC
Polyinosinic polycytidylic
- STZ
Streptozotocin
Footnotes
DISCLOSURES
ED, TJB, KG, SP, AMJ: none
CCE: at the time of these studies, was a full-time employee at Regulus Therapeutics
KJM, EAF: Past members of Regulus Therapeutics Clinical Advisory Board
References
- 1.Beckman JA, Creager MA, Libby P. Diabetes and atherosclerosis: epidemiology, pathophysiology, and management. JAMA. 2002 May 15;287:2570–2581. doi: 10.1001/jama.287.19.2570. [DOI] [PubMed] [Google Scholar]
- 2.Sacks FM. After the Fenofibrate Intervention and Event Lowering in Diabetes (FIELD) study: implications for fenofibrate. Am J Cardiol. 2008 Dec 22;102:34L–40L. doi: 10.1016/j.amjcard.2008.09.073. [DOI] [PubMed] [Google Scholar]
- 3.Vikramadithyan RK, Hu Y, Noh HL, Liang CP, Hallam K, Tall AR, Ramasamy R, Goldberg IJ. Human aldose reductase expression accelerates diabetic atherosclerosis in transgenic mice. J Clin Invest. 2005 Sep;115:2434–2443. doi: 10.1172/JCI24819. [DOI] [PMC free article] [PubMed] [Google Scholar]
- 4.Parathath S, Grauer L, Huang LS, Sanson M, Distel E, Goldberg IJ, Fisher EA. Diabetes adversely affects macrophages during atherosclerotic plaque regression in mice. Diabetes. 2011 Jun;60:1759–1769. doi: 10.2337/db10-0778. [DOI] [PMC free article] [PubMed] [Google Scholar]
- 5.Nagareddy PR, Murphy AJ, Stirzaker RA, Hu Y, Yu S, Miller RG, Ramkhelawon B, Distel E, Westerterp M, Huang LS, Schmidt AM, Orchard TJ, Fisher EA, Tall AR, Goldberg IJ. Hyperglycemia promotes myelopoiesis and impairs the resolution of atherosclerosis. Cell Metab. 2013 May 7;17:695–708. doi: 10.1016/j.cmet.2013.04.001. [DOI] [PMC free article] [PubMed] [Google Scholar]
- 6.Moore KJ, Sheedy FJ, Fisher EA. Macrophages in atherosclerosis: a dynamic balance. Nat Rev Immunol. 2013 Oct;13:709–721. doi: 10.1038/nri3520. [DOI] [PMC free article] [PubMed] [Google Scholar]
- 7.Feig JE, Rong JX, Shamir R, Sanson M, Vengrenyuk Y, Liu J, Rayner K, Moore K, Garabedian M, Fisher EA. HDL promotes rapid atherosclerosis regression in mice and alters inflammatory properties of plaque monocyte-derived cells. Proc Natl Acad Sci U S A. 2011 Apr 26;108:7166–7171. doi: 10.1073/pnas.1016086108. [DOI] [PMC free article] [PubMed] [Google Scholar]
- 8.Hewing B, Parathath S, Barrett T, Chung WKK, Astudillo YM, Yamada T, Ramkhelawon B, Tallant TC, Yusufishaq MSS, DiDonato JA, Yuang Y, Berisha SZ, Hazen SL, Smith JD, Fisher EA. Effects of native and myeloperoxidase-modified apolipoprotein a-I on reverse cholesterol transport and atherosclerosis in mice. Arterioscler Thromb Vasc Biol. 2014;34:779–89. doi: 10.1161/ATVBAHA.113.303044. [DOI] [PMC free article] [PubMed] [Google Scholar]
- 9.Rayner KJ, Sheedy FJ, Esau CC, Hussain FN, Temel RE, Parathath S, van Gils JM, Rayner AJ, Chang AN, Suarez Y, Fernandez-Hernando C, Fisher EA, Moore KJ. Antagonism of miR-33 in mice promotes reverse cholesterol transport and regression of atherosclerosis. J Clin Invest. 2011 Jul;121:2921–2931. doi: 10.1172/JCI57275. [DOI] [PMC free article] [PubMed] [Google Scholar]
- 10.Rayner KJ, Suarez Y, Davalos A, Parathath S, Fitzgerald ML, Tamehiro N, Fisher EA, Moore KJ, Fernandez-Hernando C. MiR-33 contributes to the regulation of cholesterol homeostasis. Science. 2010 Jun 18;328:1570–1573. doi: 10.1126/science.1189862. [DOI] [PMC free article] [PubMed] [Google Scholar]
- 11.Passarelli M, Tang C, McDonald TO, O’Brien KD, Gerrity RG, Heinecke JW, Oram JF. Advanced glycation end product precursors impair ABCA1-dependent cholesterol removal from cells. Diabetes. 2005 Jul;54:2198–2205. doi: 10.2337/diabetes.54.7.2198. [DOI] [PubMed] [Google Scholar]
- 12.Feig JE, Parathath S, Rong JX, Mick SL, Vengrenyuk Y, Grauer L, Young SG, Fisher EA. Reversal of hyperlipidemia with a genetic switch favorably affects the content and inflammatory state of macrophages in atherosclerotic plaques. Circulation. 2011 Mar 8;123:989–998. doi: 10.1161/CIRCULATIONAHA.110.984146. [DOI] [PMC free article] [PubMed] [Google Scholar]
- 13.Haffner SM, Lehto S, Ronnemaa T, Pyorala K, Laakso M. Mortality from coronary heart disease in subjects with type 2 diabetes and in nondiabetic subjects with and without prior myocardial infarction. The New England journal of medicine. 1998 Jul 23;339:229–234. doi: 10.1056/NEJM199807233390404. [DOI] [PubMed] [Google Scholar]
- 14.Lieu HD, Withycombe SK, Walker Q, Rong JX, Walzem RL, Wong JS, Hamilton RL, Fisher EA, Young SG. Eliminating atherogenesis in mice by switching off hepatic lipoprotein secretion. Circulation. 2003 Mar 11;107:1315–1321. doi: 10.1161/01.cir.0000054781.50889.0c. [DOI] [PubMed] [Google Scholar]
- 15.Thorp E, Tabas I. Mechanisms and consequences of efferocytosis in advanced atherosclerosis. Journal of leukocyte biology. 2009 Nov;86:1089–1095. doi: 10.1189/jlb.0209115. [DOI] [PMC free article] [PubMed] [Google Scholar]
- 16.Trogan E, Choudhury RP, Dansky HM, Rong JX, Breslow JL, Fisher EA. Laser capture microdissection analysis of gene expression in macrophages from atherosclerotic lesions of apolipoprotein E-deficient mice. Proc Natl Acad Sci U S A. 2002 Feb 19;99:2234–2239. doi: 10.1073/pnas.042683999. [DOI] [PMC free article] [PubMed] [Google Scholar]
- 17.Trogan E, Fisher EA. Laser capture microdissection for analysis of macrophage gene expression from atherosclerotic lesions. Methods Mol Biol. 2005;293:221–231. doi: 10.1385/1-59259-853-6:221. [DOI] [PubMed] [Google Scholar]
- 18.Potteaux S, Gautier EL, Hutchison SB, van Rooijen N, Rader DJ, Thomas MJ, Sorci-Thomas MG, Randolph GJ. Suppressed monocyte recruitment drives macrophage removal from atherosclerotic plaques of Apoe−/− mice during disease regression. J Clin Invest. 2011 May;121:2025–2036. doi: 10.1172/JCI43802. [DOI] [PMC free article] [PubMed] [Google Scholar]
- 19.Tacke F, Alvarez D, Kaplan TJ, Jakubzick C, Spanbroek R, Llodra J, Garin A, Liu J, Mack M, van Rooijen N, Lira SA, Habenicht AJ, Randolph GJ. Monocyte subsets differentially employ CCR2, CCR5, and CX3CR1 to accumulate within atherosclerotic plaques. J Clin Invest. 2007 Jan;117:185–194. doi: 10.1172/JCI28549. [DOI] [PMC free article] [PubMed] [Google Scholar]
- 20.Murphy AJ, Akhtari M, Tolani S, Pagler T, Bijl N, Kuo CL, Wang M, Sanson M, Abramowicz S, Welch C, Bochem AE, Kuivenhoven JA, Yvan-Charvet L, Tall AR. ApoE regulates hematopoietic stem cell proliferation, monocytosis, and monocyte accumulation in atherosclerotic lesions in mice. J Clin Invest. 2011 Oct;121:4138–4149. doi: 10.1172/JCI57559. [DOI] [PMC free article] [PubMed] [Google Scholar]
- 21.Kako Y, Huang LS, Yang J, Katopodis T, Ramakrishnan R, Goldberg IJ. Streptozotocin-induced diabetes in human apolipoprotein B transgenic mice. Effects on lipoproteins and atherosclerosis. Journal of lipid research. 1999 Dec;40:2185–2194. [PubMed] [Google Scholar]
- 22.Ginsberg HN. Diabetic dyslipidemia: basic mechanisms underlying the common hypertriglyceridemia and low HDL cholesterol levels. Diabetes. 1996 Jul;45(Suppl 3):S27–30. doi: 10.2337/diab.45.3.s27. [DOI] [PubMed] [Google Scholar]
- 23.Lally S, Owens D, Tomkin GH. Genes that affect cholesterol synthesis, cholesterol absorption, and chylomicron assembly: the relationship between the liver and intestine in control and streptozotosin diabetic rats. Metabolism. 2007 Mar;56:430–438. doi: 10.1016/j.metabol.2006.10.028. [DOI] [PubMed] [Google Scholar]
- 24.Trogan E, Feig JE, Dogan S, Rothblat GH, Angeli V, Tacke F, Randolph GJ, Fisher EA. Gene expression changes in foam cells and the role of chemokine receptor CCR7 during atherosclerosis regression in ApoE-deficient mice. Proc Natl Acad Sci U S A. 2006 Mar 7;103:3781–3786. doi: 10.1073/pnas.0511043103. [DOI] [PMC free article] [PubMed] [Google Scholar]
- 25.van Gils JM, Derby MC, Fernandes LR, Ramkhelawon B, Ray TD, Rayner KJ, Parathath S, Distel E, Feig JL, Alvarez-Leite JI, Rayner AJ, McDonald TO, O’Brien KD, Stuart LM, Fisher EA, Lacy-Hulbert A, Moore KJ. The neuroimmune guidance cue netrin-1 promotes atherosclerosis by inhibiting the emigration of macrophages from plaques. Nat Immunol. 2012 Feb;13:136–143. doi: 10.1038/ni.2205. [DOI] [PMC free article] [PubMed] [Google Scholar]
- 26.Bornfeldt KE, Tabas I. Insulin resistance, hyperglycemia, and atherosclerosis. Cell Metab. Nov 2;14:575–585. doi: 10.1016/j.cmet.2011.07.015. [DOI] [PMC free article] [PubMed] [Google Scholar]
- 27.Tolani S, Pagler TA, Murphy AJ, Bochem AE, Abramowicz S, Welch C, Nagareddy PR, Holleran S, Hovingh GK, Kuivenhoven JA, Tall AR. Hypercholesterolemia and reduced HDL-C promote hematopoietic stem cell proliferation and monocytosis: studies in mice and FH children. Atherosclerosis. 2013 Jul;229:79–85. doi: 10.1016/j.atherosclerosis.2013.03.031. [DOI] [PMC free article] [PubMed] [Google Scholar]
- 28.Yvan-Charvet L, Pagler T, Gautier EL, Avagyan S, Siry RL, Han S, Welch CL, Wang N, Randolph GJ, Snoeck HW, Tall AR. ATP-binding cassette transporters and HDL suppress hematopoietic stem cell proliferation. Science. 2010 Jun 25;328:1689–1693. doi: 10.1126/science.1189731. [DOI] [PMC free article] [PubMed] [Google Scholar]
- 29.van Eck M, Bos IS, Kaminski WE, Orso E, Rothe G, Twisk J, Bottcher A, Van Amersfoort ES, Christiansen-Weber TA, Fung-Leung WP, Van Berkel TJ, Schmitz G. Leukocyte ABCA1 controls susceptibility to atherosclerosis and macrophage recruitment into tissues. Proc Natl Acad Sci U S A. 2002 Apr 30;99:6298–6303. doi: 10.1073/pnas.092327399. [DOI] [PMC free article] [PubMed] [Google Scholar]
- 30.Llodra J, Angeli V, Liu J, Trogan E, Fisher EA, Randolph GJ. Emigration of monocyte-derived cells from atherosclerotic lesions characterizes regressive, but not progressive, plaques. Proc Natl Acad Sci U S A. 2004 Aug 10;101:11779–11784. doi: 10.1073/pnas.0403259101. [DOI] [PMC free article] [PubMed] [Google Scholar]
- 31.Ford ES. Leukocyte count, erythrocyte sedimentation rate, and diabetes incidence in a national sample of US adults. American journal of epidemiology. 2002 Jan 1;155:57–64. doi: 10.1093/aje/155.1.57. [DOI] [PubMed] [Google Scholar]
- 32.Sun Y, Ishibashi M, Seimon T, Lee M, Sharma SM, Fitzgerald KA, Samokhin AO, Wang Y, Sayers S, Aikawa M, Jerome WG, Ostrowski MC, Bromme D, Libby P, Tabas IA, Welch CL, Tall AR. Free cholesterol accumulation in macrophage membranes activates Toll-like receptors and p38 mitogen-activated protein kinase and induces cathepsin K. Circulation research. 2009 Feb 27;104:455–465. doi: 10.1161/CIRCRESAHA.108.182568. [DOI] [PMC free article] [PubMed] [Google Scholar]
- 33.Zhu X, Owen JS, Wilson MD, Li H, Griffiths GL, Thomas MJ, Hiltbold EM, Fessler MB, Parks JS. Macrophage ABCA1 reduces MyD88-dependent Toll-like receptor trafficking to lipid rafts by reduction of lipid raft cholesterol. Journal of lipid research. 2010 Nov;51:3196–3206. doi: 10.1194/jlr.M006486. [DOI] [PMC free article] [PubMed] [Google Scholar]
- 34.Yvan-Charvet L, Kling J, Pagler T, Li H, Hubbard B, Fisher T, Sparrow CP, Taggart AK, Tall AR. Cholesterol efflux potential and antiinflammatory properties of high-density lipoprotein after treatment with niacin or anacetrapib. Arterioscler Thromb Vasc Biol. 2010 Jul;30:1430–1438. doi: 10.1161/ATVBAHA.110.207142. [DOI] [PMC free article] [PubMed] [Google Scholar]
- 35.Kanter JE, Kramer F, Barnhart S, Averill MM, Vivekanandan-Giri A, Vickery T, Li LO, Becker L, Yuan W, Chait A, Braun KR, Potter-Perigo S, Sanda S, Wight TN, Pennathur S, Serhan CN, Heinecke JW, Coleman RA, Bornfeldt KE. Diabetes promotes an inflammatory macrophage phenotype and atherosclerosis through acyl-CoA synthetase 1. Proc Natl Acad Sci U S A. Mar 20;109:E715–724. doi: 10.1073/pnas.1111600109. [DOI] [PMC free article] [PubMed] [Google Scholar]
- 36.Rotllan N, Ramirez CM, Aryal B, Esau CC, Fernandez-Hernando C. Therapeutic silencing of microRNA-33 inhibits the progression of atherosclerosis in Ldlr−/− mice--brief report. Arterioscler Thromb Vasc Biol. 2013 Aug;33:1973–1977. doi: 10.1161/ATVBAHA.113.301732. [DOI] [PMC free article] [PubMed] [Google Scholar]
- 37.Horie T, Baba O, Kuwabara Y, Chujo Y, Watanabe S, Kinoshita M, Horiguchi M, Nakamura T, Chonabayashi K, Hishizawa M, Hasegawa K, Kume N, Yokode M, Kita T, Kimura T, Ono K. MicroRNA-33 deficiency reduces the progression of atherosclerotic plaque in ApoE−/− mice. J Am Heart Assoc. 2012 Dec;1:e003376. doi: 10.1161/JAHA.112.003376. [DOI] [PMC free article] [PubMed] [Google Scholar]
- 38.Marquart TJ, Wu J, Lusis AJ, Baldan A. Anti-miR-33 Therapy Does Not Alter the Progression of Atherosclerosis in Low-Density Lipoprotein Receptor-Deficient Mice. Arterioscl Throm Vas. 2013 Mar;33:455–8. doi: 10.1161/ATVBAHA.112.300639. [DOI] [PMC free article] [PubMed] [Google Scholar]
- 39.Iqbal AJ, Regan-Komito D, Christou I, White GE, McNeill E, Kenyon A, Taylor L, Kapellos TS, Fisher EA, Channon KM, Greaves DR. A real time chemotaxis assay unveils unique migratory profiles amongst different primary murine macrophages. PloS One. 8:e58744. doi: 10.1371/journal.pone.0058744. [DOI] [PMC free article] [PubMed] [Google Scholar]
Associated Data
This section collects any data citations, data availability statements, or supplementary materials included in this article.