

Abstract
Thiamine (vitamin B1) deficiency, associated with a variety of conditions, including chronic alcoholism and bariatric surgery for morbid obesity, can result in the neurological disorder Wernicke’s encephalopathy (WE). Recent work building upon early observations in animal models of thiamine deficiency has demonstrated an inflammatory component to the neuropathology observed in thiamine deficiency. The present, multilevel study including in vivo magnetic resonance imaging (MRI) and spectroscopy (MRS) and postmortem quantification of chemokine and cytokine proteins sought to determine whether a combination of these in vivo neuroimaging tools could be used to characterize an in vivo MR signature for neuroinflammation. Thiamine deficiency for 12 days was used to model neuroinflammation; glucose loading in thiamine deficiency was used to accelerate neurodegeneration. Among 38 animals with regional brain tissue assayed postmortem for cytokine/chemokine protein levels, three groups of rats (controls+glucose, n=6; pyrithiamine+saline, n=5; pyrithiamine+glucose, n=13) underwent MRI/MRS at baseline (time 1), after 12 days of treatment (time 2), and 3h after challenge (glucose or saline, time 3). In the thalamus of glucose-challenged, thiamine deficient animals, correlations between in vivo measures of pathology (lower levels of N-acetyle aspartate and higher levels of lactate) and postmortem levels of monocyte chemotactic protein-1 (MCP-1, also known as chemokine ligand 2, CCL2) support a role for this chemokine in thiamine deficiency-related neurodegeneration, but do not provide a unique in vivo signature for neuroinflammation.
Keywords: thiamine, TDP, lactate, microglia, MCP-1, magnetic resonance imaging, magnetic resonance spectroscopy, immunohistochemistry, liver, brain
INTRODUCTION
Mounting evidence, primarily from experimental models of conditions including Alzheimer’s disease (e.g., McLarnon, 2014), Parkinson’s Disease (e.g., Sanchez-Guajardo et al., 2013), schizophrenia (e.g., Upthegrove et al., 2014), and major depressive disorder (e.g., Najjar et al., 2014), suggests that inflammatory processes play a role in central nervous system (CNS) pathology. Indeed, it has been suggested that molecules released by injured neurons can interact with activated microglia to trigger a self-perpetuating cycle of injury with prolonged microglial activation that contributes to neurodegeneration (Block and Hong, 2005). Identifying in vivo, non-invasive markers capable of dissociating neuroinflammatory and neurodegenerative processes would be valuable for longitudinally evaluating progression of diseases with inflammatory components and the effects of therapeutic interventions. Magnetic resonance imaging (MRI) and spectroscopy (MRS) can assess the structure and chemical composition of the brain in vivo and together have the potential to be used as biomarkers for neuroinflammation.
The acute neuropsychiatric consequence of thiamine (vitamin B1) deficiency, Wernicke’s encephalopathy (WE), is associated with conditions such as alcoholism, bariatric surgery for morbid obesity (Berger and Singhal, 2014; Merola et al., 2012), cancer, HIV/AIDS, and advanced age (Lee et al., 2000). Animal models support a contribution of classical sterile neuroinflammatory mechanisms (cf., Graeber et al., 2011) in thiamine deficiency related pathology. Indeed, neuropathologic consequences of thiamine deficiency include blood-brain barrier breakdown (Beauchesne et al., 2009; Calingasan and Gibson, 2000; Ke and Gibson, 2004; Nixon et al., 2008) and accumulation of innate and adaptive immune cells in CNS tissue (McRee et al., 2000; Meng and Okeda, 2003). Alterations in glial cell morphology were reported in early studies of experimental thiamine deficiency (Collins, 1967; Robertson et al., 1968; Tellez and Terry, 1968) and in human WE (Victor et al., 1971). Activated macrophages/microglia have been noted in several vulnerable brain regions (Todd and Butterworth, 1999). Further, in the vulnerable thalamus (Karuppagounder et al., 2007; Vemuganti et al., 2006) and inferior colliculus (Vemuganti et al., 2006), cytokine genes and proteins (e.g., IL-1β, TNF-α) have been shown to be upregulated. Although inflammation reflecting neuronal damage may appear late in the temporal sequence of events following thiamine deficiency, cytokine signaling may spread damage to other brain regions (Ke et al., 2005; Ke and Gibson, 2004). It has been proposed that the sequence of events leading to neurodegeneration in thiamine deficiency begins with oxidative stress causing neuronal secretion of monocyte chemoattractant protein-1 (MCP-1) that activates microglia to secrete cytokines that then promote neuronal death (Yang et al., 2011).
Studies have attempted to demonstrate relationships between in vivo MR metrics and postmortem markers of neuroinflammation. For example, the size of T2-weighted hyperintensities in an animal model of multiple sclerosis were shown to correlate with inflammatory cell accumulation (Tourdias et al., 2011). In a model of hydrocephalus, ventricular enlargement was associated with increased expression of GFAP (a marker of astrocytosis) and Iba-1 (a marker of microgliosis)(Xu et al., 2012). MRS in neuroinflammatory conditions such as multiple sclerosis and HIV typically identifies a pattern of reduced levels of N-acetyl aspartate (NAA, a marker of neuronal integrity) (Rigotti et al., 2012; Schweinsburg et al., 2005), elevated levels of choline-containing compounds (Cho, a marker of cell-membrane metabolism and cellular turnover) (Inglese et al., 2003; Mader et al., 2008; Valcour et al., 2012), and elevated levels of myo-Inositol (mI, a putative glial marker) (Bagory et al., 2012; Fernando et al., 2004; Harezlak et al., 2011; Kirov et al., 2009).
By using both in vivo MRI and MRS and postmortem quantification of chemokine/cytokine protein levels in several brain regions, the current study sought to determine relationships between in vivo MR markers of pathology and molecules associated with inflammation with the intention of determining an in vivo MR signature for neuroinflammation. Three groups of animals were included: control animals, thiamine-deficient animals challenged with saline (to model neuroinflammation in the absence of severe neurodegeneration), and thiamine-deficient animals challenged with glucose (to model neurodegeneration) (Jordan et al., 1998). Measurement of whole blood levels of thiamine and its phosphate derivatives was used to index severity of thiamine deficiency.
METHODS
Animals
The Institutional Animal Care and Use Committees (IACUC) at SRI International and Stanford University approved all research protocols in accordance with NIH IACUC guidelines, and the Guide for the Care and Use of Laboratory Animals (Committee, 2010). A total of 56 adult, male, wild-type Wistar rats weighing 280.5±4.8g at study entry were individually housed with free access to food and water. Animals used in these experiments were maintained in fully accredited facilities. The number of animals used in specific assays is presented in Table
Thiamine Deprivation Treatment
Following the protocol employed in prior studies (Ciccia and Langlais, 2000; Langlais and Zhang, 1997; Pfefferbaum et al., 2007; Pitkin and Savage, 2001), all 56 rats received thiamine-deficient chow (Harlan-Teklad, Madison, WI, TD81029). Control animals (n=19) additionally received daily intraperitoneal (IP) injections of thiamine hydrochloride (0.4 mg/kg). The remaining 37 animals received daily IP injections of pyrithiamine hydrobromide (0.5 mg/kg): pyrithiamine-treated (PT) rats were made thiamine-deficient until ataxia was observed, typically by day 12 of treatment. A glucose challenge was given to accelerate neurodegeneration (Harper, 1980; Jordan et al., 1998; Victor et al., 1989; Wallis et al., 1978; Watson et al., 1981). All 19 thiamine treated (i.e., control) animals were challenged with glucose (5g/kg) by intravenous (IV) administration in the caudal tail vein (i.e., control + glucose, CG), 10 pyrithiamine-treated animals received IV saline (i.e., pyrithiamine + saline, PS), and 27 pyrithiamine-treated animals were challenged with IV glucose (i.e., pyrithiamine + glucose, PG). All chemicals were obtained from Sigma Aldrich, Saint Louis, MO.
Behavioral Analysis
Neurological examination (Becker, 2000; Roberts et al., 1996; Yaksh et al., 1977) was performed daily on 19 CG and 37 PT animals beginning on day 8 and continuing daily until day 12 or 13 of thiamine deprivation. Rats were rated (0=absent, 1=present) for the presence of behavioral signs in the following categories: autonomic, sensory, arousal, posture, motor, central, and responses to stimulation.
Measurement of Thiamine and its Derivatives
Whole blood (~1.5ml) was collected via retro-orbital bleed in EDTA tubes at baseline (11 CG, 23 PT) and after 12–13 days of thiamine deficiency (19 CG, 37 PT). Of 27 animals that received glucose challenge, 10 had blood collected after the challenge to determine if glucose challenge further affected levels of thiamine and its derivatives. AniLyitics Inc. (Gaithersburg, MD), measured thiamine and its phosphate derivatives (thiamine monophosphate (TMP) and thiamine diphosphate (TDP)) using recommended methods (Mancinelli et al., 2003).
MR Scanning Procedures and Data Analysis
Schedule
MRI and MRS were acquired on 24 animals (6 CG, 5 PS, 13 PG) at baseline (time 1), on days 12 or 13 of thiamine deprivation (time 2), and within 3h of saline or glucose challenge (time 3), administered immediately upon completion of the 2nd scan (Figure 1a). All 56 animals, whether they were MR scanned or not, were sacrificed within 6h of the challenge.
Figure 1.

a) Experimental schedule indicating the 3 scan time points. b) Pattern of weight loss in the 2 groups (CG=control (n=19); PT=pyrithiamine treated (n=37)) beginning on day 8 of treatment. * p≤.05.
Anesthesia and Monitoring
Animals were held in an MR-invisible structure providing support for a radiofrequency (RF) coil and nose cone for delivery of isoflurane anesthesia (1.5–3%) and oxygen (1.5L/min) (Adalsteinsson et al., 2004). Blood oxygen saturation, pulse rate, rectal temperature, and respiration were monitored throughout the ~2h MR scan.
MRI Acquisition
Imaging was conducted on a clinical 3T GE Signa MR scanner equipped with a high-strength insert gradient coil (peak strength=600 mT/m, peak slew rate=3200 T/m/s; (Chronik et al., 2000a; Chronik et al., 2000b) operated at 500mT/m and a slew rate of 1800mT/m/ms. A custom-made rat brain quadrature head coil (Ø=44mm) was used for both RF excitation and signal reception. A gradient-recalled echo localizer scan was used to position the animals in the scanner and for graphical prescription of the subsequent scans. High resolution, dual-echo, fast spin-echo (FSE) images were acquired in the rat axial plane, coronal to the magnet system bore (echo time (TE)1/TE2/repetition time (TR)=11.3/56.7/5000ms, field of view=64x48mm2, 256x192 matrix, echo train length=8, 50 slices, 0.3mm thick, 0mm separation, in-plane resolution=0.25x.25mm2, 4 separate acquisitions each with 2 NEX).
Image Post-processing
Briefly, post-processing of FSE images included motion correction, alignment of the image to a whole-head image of a template animal, and longitudinal alignment. Bilateral regions of interest (ROI) that were unaffected by treatment were used as bilateral reference regions (9.6mm3) for comparison of T2 values in bilateral samples of the thalamus (4.5 mm3), hippocampus (11.9mm3), frontal cortex (8.1mm3), non-brain control muscle (5.9mm3) and regions encompassing the inferior colliculi (11.9mm3).
For ventricular quantification, after rigid alignment to a laboratory standard template, bilateral 93.58mm3 ROIs were projected onto each animal’s T2 image. An intensity histogram was created for the T2 values from the combined left and right ROIs, and a Gaussian plus quadratic function was modeled with a non-linear least-squares fit with 6 unknown parameters (“IDL gauss fit” function). All voxels 2.5 SD greater than the center of the Gaussian function were deemed ventricle CSF.
MRS Acquisition
FSE images were used to prescribe a single voxel (4x5x9mm) in the thalamus according to the atlas of Paxinos and Watson (Paxinos and Watson, 2005). Spectroscopic data were acquired with constant time point-resolved spectroscopy (CT-PRESS) (Dreher and Leibfritz, 1999; Mayer and Spielman, 2005). The quality of the spectra allowed evaluation of signals of the major proton metabolites: N-acetyl aspartate (NAA, 2.01 ppm), total creatine (tCr, 3.03 ppm), choline-containing compounds, (Cho, 3.20 ppm), glutamate (Glu, 2.36ppm), and lactate (Lac, 1.31 ppm). We chose not to assess mI because of the variability inherent in its quantification (Okada et al., 2007).
Liver Histology
Left lateral lobe liver specimens from all rats (19 CG, 10 PS, 27 PG) were fixed then routinely processed for light microscopic examination by a veterinary pathologist (RL) for hepatic pathology on a 0 to 5 scale: 0=absent, 1=minimal (<5% of tissue), 2=mild (5–20% of tissue), 3=moderate (20–50% of tissue), 4=severe (50–75% of tissue), and 5=massive (>75% of tissue) (Zahr et al., 2009b).
Brain Cytokines
Unilateral brain regions (right) from 15 CG, 6 PS, and 17 PG animals were quickly dissected from the right hemisphere using a rat coronal (1mm) brain matrix on dry ice. Although 38 animals were dissected, brain regions were represented unequally due to loss of some regions during dissections. Brain regions collected included inferior colliculi (n=30), thalamus (n=38), hypothalamus (n=37), anterior vermis of the cerebellum (n=29), and hippocampus (n=38); these regions were chosen because of their presumed sensitivity to thiamine deficiency. The cytokine assay was carried out in duplicate according to the instructions provided with Mesoscale Singleplex Kits (Gaithersburg, MD) for tumor necrosis factor (TNF)-α, MCP-1 (CCL2), interleukin (IL)-1β, IL-6, and IL-10.
Brain Histology
Left brain hemispheres from 5 CG and 5 PG animals were fixed and hemi-coronal sections (40μm) were collected on a Leica cryostat (Buffalo Grove, IL; 40). Sections from the inferior colliculus, thalamus, and hippocampus were used to evaluate microglial activation (immunopositive for Iba-1, enlarged cell bodies, retracted and thickened processes).
Statistics
For variables collected prior to glucose challenge, statistics were conducted on 2 groups (i.e., CG and PT); for variables collected after glucose challenge, 3 group (CG, PS, PG) comparisons were conducted. Because of significant weight loss in PT animals, values for levels of thiamine and its phosophate derivatives were weight-corrected based on the weights of 19 CG animals on day 8 of treatment; MR variables of interest were weight-corrected based on weight on day 8 of treatment of the 6 CG animals that were scanned. Between-group and within-group differences were examined with repeated-measures analysis of variance (ANOVAs). Follow-up t-tests analyzed between group differences; Wilcoxon signed rank test examined within group differences when relevant. Bivariate analyses, both parametric and nonparametric, tested relationships between variables in PT (i.e., PS+PG) rats only.
RESULTS
Weight and Behavioral Changes in Response to Thiamine Deficiency
A repeated-measures ANOVA of weights on days 8 through 12 of treatment was significant for group (F(1,46)=13.41 p=.0006), time (F(5,230)=97.48, p=.0001), and their interaction (F(5,230)=48.19, p=.0001). PT animals began to weigh significantly less than CG animals from day 8 onward (p=.0491, Figure 1b, Table 2).
Table 2.
Weight (g) means ± standard errors
| baseline | day 8 | day 9 | day 10 | day 11 | day 12 | |
|---|---|---|---|---|---|---|
| CG (n=19) | 277.2±8.34 | 339.43±9.39 | 331.87±8.73 | 335.74±8.67 | 342.91±9.06 | 343.47±8.85 |
| PT (n=37) | 282.22±5.97 | 317.11±5.95 | 312.08±6.21 | 304.84±6.21 | 296.94±6.22 | 286.70±6.35 |
Although the neurological exam conducted included a large number of variables, only a few behaviors clearly distinguished CG and PT groups and included piloerection and splayed legs, evident as early as day 8 of treatment. Trunk tone was compromised beginning on day 9; gait disturbances and loss of righting reflex (LORR) were evident on day 10 of treatment (Table 3).
Table 3.
Number of animals observed to exhibit behavior on day of treatment*
| piloerection | splayed legs trunk tone | gait problems | LORR** | ||
|---|---|---|---|---|---|
|
| |||||
| never observed | 9 | 5 | 11 | 10 | 7 |
| day 8 | 6 | 2 | 0 | 0 | 0 |
| day 9 | 8 | 7 | 2 | 0 | 0 |
| day 10 | 3 | 3 | 7 | 5 | 3 |
| day 11 | 5 | 16 | 4 | 6 | 8 |
| day 12 | 5 | 2 | 9 | 10 | 8 |
| day 13 | 1 | 2 | 4 | 6 | 11 |
of 37 PT animals observed.
Loss of Righting Reflex
Of 27 animals that received glucose challenge (i.e., PG animals), 8 were observed to have epileptiform-like activity, but only 3/8 had complete time-point 3 scans. In the 3 animals that were observed to have epileptiform-like activity and were also scanned, ventricular volume and lactate levels were higher and NAA levels lower than in animals that had not exhibited such events (the small number of animals with both epileptiform-like activity and scans precludes statistical analysis).
Thiamine Depletion Detected with TDP
Erythrocyte levels of TDP showed group differences following thiamine deficiency (Figure 2, Table 4): compared with CG animals, PT animals had lower TDP levels at the thiamine-deficient time point (p=.0001). Glucose challenge did not further affect TDP levels in the 10 animals that received glucose challenge and had TDP levels measured (Table 5). In contrast to TDP, neither TMP nor thiamine concentrations were sensitive to thiamine deprivation (Figure 2, Table 4).
Figure 2.
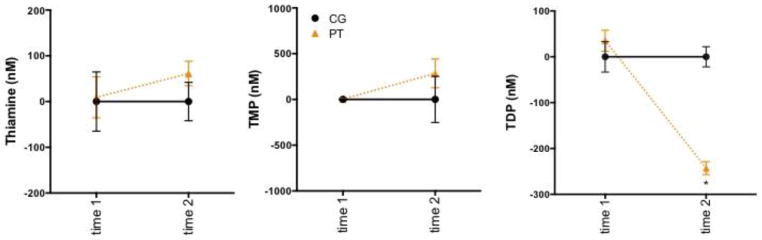
Levels of thiamine and its phosphate derivatives in CG=control (n=19) and PT=pyrithiamine treated (n=37) animals at baseline and following 12 days of thiamine deficiency. * p=.0001.
Table 4.
Weight-Corrected Dependent Variables*
| ANOVA interaction (time 1 – time 2)# | CG vs. PT t-testb | |
|---|---|---|
| Thiamine Measurements | ||
| TDP | F(32)=22.72, p=.0001 | 0.0001 |
| thiamine | n.s. | n.s. |
| TMP | n.s. | n.s. |
| MRI Volume and T2 Effects | ||
| ventricular volume | F(22)=4.32, p=.0495 | 0.0108 |
| inferior colliculi | F(22)=7.44, p=.0123 | 0.0060 |
| thalamic nuclei | F(22)=4.55, p=.0443 | n.s. |
| dorsal hippocampus | n.s. | n.s. |
| ventral hippocampus | n.s. | n.s. |
| frontal cortex | n.s. | n.s. |
| muscle | n.s. | n.s. |
| MRS Metabolites | ||
| N-acetyl aspartate (NAA) | F(22)=10.19, p=.0042 | 0.0007 |
| total Creatine (tCr) | n.s. | n.s. |
| choline-containing compounds (Cho) | F(22)=6.27, p=.0202 | 0.0260 |
| glutamate (Glu) | n.s. | n.s. |
| lactate (Lac) | n.s. | n.s. |
repeated measures ANOVA for baseline vs. thiamine-deficient time-point
all sig. ANOVAs sig. for group, time, and their interaction with the exception of those for thalamic nuclei (no group effect ) t at thiamine-deficient time point (i.e., time 2)
Table 5.
Weight-Corrected Within Group
| Comparisons | |||
|---|---|---|---|
|
| |||
| Wilcoxon signed | rank test | (time 2 – time 3) | |
|
| |||
| CG | PS | PG | |
| TDP | n.a. | n.a. | n.s. |
| ventricular volume | n.s. | n.s. | 0.0244 |
| inferior colliculi T2 | n.s. | n.s. | 0.1230 |
| thalamic nuclei T2 | n.s. | n.s. | 0.0137 |
| N-acetyl aspartate (NAA) | n.s. | n.s. | 0.0840 |
| choline-containing compounds (Cho) | n.s. | n.s. | n.s. |
| lactate (Lac) | n.s. | n.s. | 0.0039 |
n.a. - not applicable; n.s. - not significant
Magnetic Resonance Imaging: Focal Insult in the Context of Global Effects
Representative MR images from CG and PG animals at the 3 scan times are presented in Figure 3. Separate group-by-time (time 1 vs. time 2) ANOVAs were conducted for ventricular volume, T2 ratios (T2 in ROIs/T2 in reference region, where longer T2s are consistent with evidence for compromised tissue) in the inferior colliculi, thalami, ventral hippocampi, dorsal hippocampi, and frontal cortex, and a control area delineated in muscle (Figure 4, Table 4).
Figure 3.

Exemplary MRI images from a CG rat and a PG rat at the 3 scan time points.
Figure 4.

Three scan time points in the 3 groups of animals (ConGlucose=CG (n=6); PyrSaline=pyrithiamine + saline challenge (n=5), PyrGlucose=pyrithiamine + glucose challenge (n=13) showing a) ventricular volume; and signal intensities (i.e., ratios: T2 in region of interest/T2 in reference region) in b) inferior colliculi, c) thalamic nuclei, d) ventral hippocampi.
Ventricular volume showed a group effect, a time-effect, and a group-by-time interaction (Figure 4a, Table 4). PT compared with CG animals had enlarged ventricles following thiamine deficiency. Glucose challenge resulted in further enlargement of the ventricles (Table 5). The inferior colliculi showed effects of group, time, and an interaction (Figure 4b, Table 4). PT compared with CG animals had higher T2 ratios of the inferior colliculi following thiamine deficiency. Glucose challenge caused further increases in the T2 ratios of the inferior colliculi that did not reach statistical significance (Table 5). ANOVAs for the T2 ratios of the thalamus showed time effects and an interaction, but no group effects (Figure 4c, Table 4). Glucose challenge resulted in significant increases in thalamic T2 ratios (Table 5). ANOVAs for the T2 ratios in dorsal and ventral hippocampi (Figure 4d), frontal cortex, and muscle did not show statistically significant effects of group, time, or their interactions (Table 4).
Magnetic Resonance Spectroscopy: Evidence for Neuronal Injury
Figure 5 shows voxel placement in the thalamus and representative MR spectra from a CG and a PG animal at the 2nd scan. Separate group-by-time (time 1 vs. time 2) ANOVAs indicated group, time, and interaction effects for NAA and Cho (Figure 5, Table 4). PT compared with CG animals had lower thalamic NAA following thiamine deficiency. Further NAA declines that did not reach statistical significance were evident in glucose challenged animals (Table 5). Thalamic Cho levels were lower with thiamine deficiency in PT compared with CG animals, but glucose challenge caused no further effects on Cho. Thalamic Lac levels did not distinguish groups at the thiamine-deficient time point (Figure 5, Table 4), but glucose challenge caused large increases in Lac levels (Figure 5, Table 5).
Figure 5.
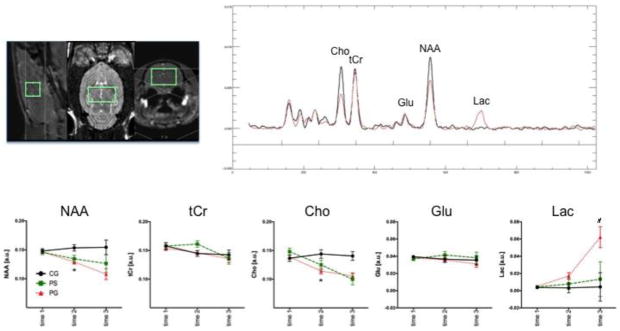
MRS voxel placement in the thalamus and exemplary spectra from a control (CG, black) and a pyrithiamine-treated (PG, red) rat at scan time point 2. Metabolite signal intensities at the 3 scan time points in the 3 groups of animals (CG (n=6); PS=pyrithiamine + saline challenge (n=5), PG=pyrithiamine + glucose challenge (n=13)): 1) N-acetyl aspartate (NAA), 2) total creatine (tCr), 3) choline-containing compounds (Cho), 4) glutamate (Glu), and 5) lactate (Lac) in arbitrary units (a.u.). * p≤.05 between group; # p≤.05 within group.
Liver Histology: No Evidence for Hepatic Damage
All animals evaluated (including CG, PS, and PG rats) scored 0 (i.e., no pathology) or an average close to 0 on hepatic pathology variables: microvesicular and macrovesicular lipidosis, hepatocyte swelling or necrosis, mallory body formation, inflammation (neutrophilic parenchymal, neutrophilic portocentric, lympho-histiocytic portocentric), bile duct proliferation, fibrosis (sinusoidal, portocentric, centrilobular, portal-portal, or central-portal), and regeneration (microscopic or macroscopic).
Brain Cytokine Proteins: Evidence for Ubiquitous MCP-1 Secretion
Separate 3-group ANOVAs were conducted for each of the 5 chemokines/cytokines (i.e., MCP-1, TNF-α, IL-1β, IL-10, IL-6) in 5 brain structures (inferior colliculi, thalamus, hypothalamus, anterior vermis, hippocampus). ANOVAs were significant for 10 of 25 comparisons (Figure 6, Table 6): MCP-1 in all five regions; IL-6, IL-1β, and IL-10 in the inferior colliculus; IL-6 in the hypothalamus, and TNF-α in the anterior vermis. Follow-up effects meeting family-wise Bonferroni correction for 5 cytokines with α=.05, required a 2-tailed significance of p≤0.01 are indicated in bold in Table 6.
Figure 6.
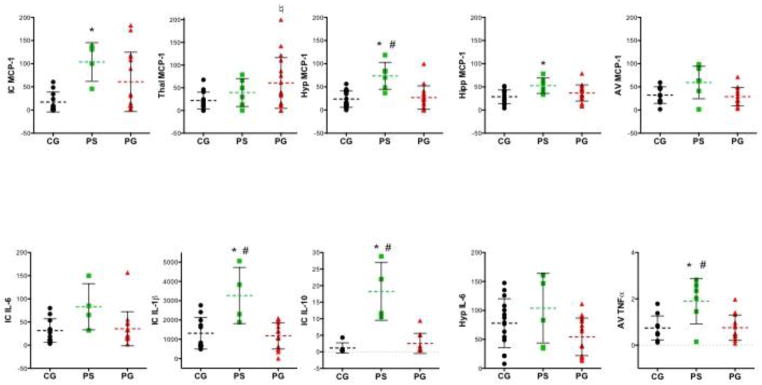
Chemokine (i.e., MCP-1) and cytokine levels (pg/mg protein) in various brain regions assessed postmortem in the 3 groups (CG=control + glucose challenge (n=15); PS=pyrithiamine + saline challenge (n=6), PG=pyrithiamine + glucose challenge (n=17). IC=inferior colliculus, Thalm=thalamus, Hyp=hypothalamus, Hip=hippocampus, AV=anterior vermis of the cerebellum. *CG vs. PS, ♮CG vs. PG, # PS vs. PG.
Table 6.
Effects of Thiamine Deficiency on Cytokines in Select Brain Regions
| Region | Protein | ANOVA | follow up t-tests | ||
|---|---|---|---|---|---|
|
| |||||
| CG vs. PS | CG vs. PG | PS vs. PG | |||
| inferior colliculus | MCP-1 | F(2,27)=5.02, p=.0140 | 0.0063 | 0.0365 | n.s. |
| IL-6 | F(2,27)=3.49, p=.0448 | 0.0176 | n.s. | 0.0224 | |
| IL-1P | F(2,27)=10.00, p=.0006 | 0.0005 | n.s. | 0.0002 | |
| IL-10 | F(2,27)=22.24, p=.0001 | 0.0001 | n.s. | 0.0001 | |
| TNF-a | F(2,27)=.27, p=.7642 | n.s. | n.s. | n.s. | |
| thalamus | MCP-1 | F(2,35)=3.77, p=.0330 | n.s. | 0.0096 | n.s. |
| IL-6 | F(2,35)=.18, p=.8346 | n.s. | n.s. | n.s. | |
| IL-1p | F(2,35)=.27, p=.7667 | n.s. | n.s. | n.s. | |
| IL-10 | F(2,35)=2.83, p=.0779 | 0.0299 | n.s. | n.s. | |
| TNF-a | F(2,35)=.07, p=.9324 | n.s. | n.s. | n.s. | |
| hypothalamus | MCP-1 | F(2,34)=11.09, p=.0002 | 0.0001 | n.s. | 0.0002 |
| IL-6 | F(2,34)=3.34, p=.0474 | n.s. | n.s. | 0.0182 | |
| IL-1P | F(2,34)=1.61, p=.2154 | n.s. | n.s. | n.s. | |
| IL-10 | F(2,34)=.24, p=.7895 | n.s. | n.s. | n.s. | |
| TNF-a | F(2,34)=2.63, p=.0864 | n.s. | n.s. | n.s. | |
| hippocampus | MCP-1 | F(2,35)=4.59, p=.0170 | 0.0047 | n.s. | 0.0497 |
| IL-6 | F(2,35)=1.63, p=.2109 | n.s. | n.s. | n.s. | |
| IL-1 p | F(2,35)=.006, p=.9938 | n.s. | n.s. | n.s. | |
| IL-10 | F(2,35)=.04, p=.9524 | n.s. | n.s. | n.s. | |
| TNF-a | F(2,35)=3.15, p=.0550 | 0.0383 | n.s. | 0.0193 | |
| anterior vermis | MCP-1 | F(2,26)=3.88, p=.0336 | 0.0305 | n.s. | 0.0121 |
| IL-6 | F(2,26)=.71, p=.5025 | n.s. | n.s. | n.s. | |
| IL-1 p | F(2,26)=1.93, p=.1658 | n.s. | n.s. | n.s. | |
| IL-10 | F(2,26)=.46, p=.6353 | n.s. | n.s. | n.s. | |
| TNF-a | F(2,26)=7.55, p=.0026 | 0.0018 | n.s. | 0.0013 | |
p-values in bold indicate significance following a family-wise Bonferroni correction for 5 cytokines with a=.05 and p<0.01.
Brain Histology: Evidence for Focal Microglial Activation
The number of Iba-1 positive cells, reflecting microglial activation, relative to total cell counts was significantly greater in the PG than CG group in the inferior colliculus (t(8)=44.64, p=.0001), thalamus (t(8)=15.91, p=.0001), and hippocampus (t(7)=3.02, p=.0194) (Figure 7).
Figure 7.

a) Number of activated microglia (indicated by morphology and staining for Iba-1) relative to cell count in inferior colliculus (IC), thalamus (Thal), and hippocampus (Hipp) for 5 control + glucose (CG) and 5 pyrithamine + glucose (PG) animals. b) left – thalamic section from a control animal showing inactive microglia; right – thalamic section from a thiamine deficient animal showing activated microglia.
Relations among in vivo and postmortem measures
In PG animals only, thalamic NAA (r= −.63, p=.0494; ρ=−.65, p=.0425; Figure 8a) and thalamic lactate (r= .68, p=.03; ρ=.68, p=.0289; Figure 8b) levels at time 3 correlated with thalamic MCP-1 levels. None of the other chemokine/cytokine protein measures correlated with markers of in vivo pathology.
Figure 8.
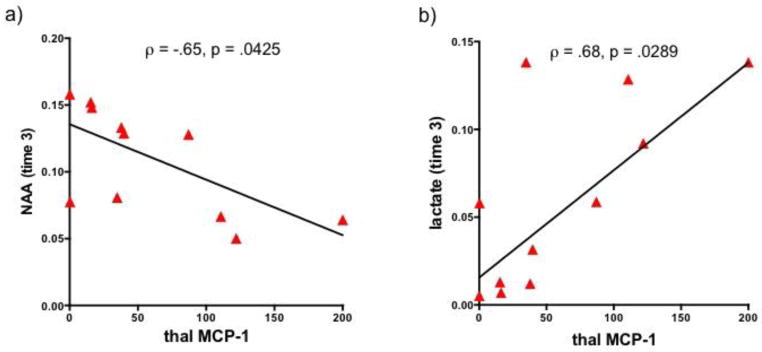
Correlations in pyrthiamine-treated animals (green= PS, red=PG) between thalamic monocyte chemotactic protein-1 (MCP-1) levels and thalamic a) N-acetyl aspartate (NAA) and b) lactate at time 3.
DISCUSSION
Here, using in vivo neuroimaging and postmortem quantification of chemokines/cytokines, we sought to determine an in vivo signature of neuroinflammation. Thiamine deficiency resulted in weight loss, changes in behavior, and reduced whole blood TDP levels, but no histopathological evidence for liver damage. Because at postmortem, elevations in chemokines/cytokines were evident in the PS group, which had not been challenged with glucose, we presume that in vivo results at time 2 are more reflective of neuroinflammatory than neurodegenerative processes. Thiamine deficiency prior to glucose challenge (i.e., time 2) resulted in ventricular enlargement, hyperintensities evident in the inferior colliculus, and decreases in NAA and Cho levels in the thalamus (Table 7). Glucose challenge in the thiamine-deficient state caused further enlargement of the lateral ventricles, emergence of thalamic hyperintensities, and increases in thalamic lactate levels (Table 7). The rapid and large accumulation of lactate following glucose challenge strongly suggests the emergence of neurodegenerative processes (Biros et al., 1986; Petito et al., 1987; Wagner et al., 1986). Although we hypothesized that MR metrics would reveal a pattern of changes sufficient to characterize neuroinflammation, the results of this study indicate that the in vivo imaging sequences used herein could not distinguish neuroinflammation from neurodegeneration.
Table 7.
Summary of Findings
| time 2 (12 days TD) in vivo results | time 3 (12 days TD+glucose) in vivo results | postmortem histology | postmortem protein quantification | |
|---|---|---|---|---|
| lateral ventricles | enlarged | further enlarged | ||
| inferior colliculus | hyperintense | hyperintense | microglial activation | elevated MCP-1, IL-1 p, IL-10 w/o glucose |
| thalamus | decreased NAA + Cho | hyperintense, decreased NAA, increased Lac | microglial activation | elevated MCP-1 + glucose |
| hippocampus | no detectable effect | no detectable effect | microglial activation | elevated MCP-1 w/o glucose |
Recent work has attempted to explain the weight loss observed in thiamine deficiency. C57Bl/6 mice fed a thiamine deficient diet for 16 days showed severe (17–24%) weight loss related to significant decreases in food intake and increases in resting energy expenditure; experiments suggested that thiamine deficiency may inhibit a critical regulator of food intake, hypothalamic adenosine monophosphate-activated protein kinase (AMPK) (Liu et al., 2014). Thiamine deficiency also resulted in changes to physiology and behavior including piloerection, splayed legs, gait problems, loss of trunk tone, and loss of righting reflex. Eight animals were observed to have epileptiform-like activity described accurately by observations reported in an 8-year old boy with thiamine deficiency: “opisthotonus…was replaced by milder, sudden contractions of various muscle groups which resulted in bizarre involuntary movements (Sullivan, 1970).” Together, these observational results are in agreement with earlier reports that the first symptom of experimental thiamine deficiency is weight loss, followed by ataxia (i.e., gait problems), loss of righting reflex, and the emergence of seizures and opisthotonus (Zhang et al., 1995). Some of the behavioral changes observed herein have similar presentations in the human condition (e.g., ataxia, motor incoordination) while others (e.g., piloerection) do not (Vetreno et al., 2012). Also in agreement with previous results (e.g., Mancinelli et al., 2003), the current study indicates that erythrocyte measures of TDP are sensitive to changes in biological thiamine status (Mancinelli et al., 2003) and are the most suitable indicator of total body stores (Brin, 1964; Fell and Talwar, 1998; Warnock et al., 1978). Although liver disease can exacerbate thiamine deficiency (Butterworth, 1995), and thiamine deficiency can interfere with metabolic activity in the liver (Blair et al., 1999), our results demonstrated that thiamine deficiency does not necessarily result in evidence for liver steatosis, hepatitis, or cirrhosis.
Again, because elevations in chemokines/cytokines were detected in the PS group (i.e., animals not challenged by glucose), we presume that neuroimaging findings at time 2, prior to glucose challenge, reflect the CNS in a more neuroinflammatory than neurodegenerative state. The pattern of changes at time 2 included enlarged ventricles, hyperintensities in the inferior colliculus, and reduced NAA and Cho in the thalamus, but no lactate elevation. Enlargement of the ventricles has previously been reported in thiamine deficiency (Dror et al., 2010), but this MR metric is a non-specific index of brain pathology (e.g., Zahr et al., 2013). The edematous nature of inferior collicular pathology (Watanabe and Kanabe, 1978) may explain why it is detected early in the course of in thiamine deficiency by in vivo MRI, which is sensitive to brain pathology caused by tissue edema (Jung et al., 2012). As with ventricular enlargement, however, hyperintensities noted on T2-weighted scans are nonspecific and reflect several different tissue processes including, but not limited to, edema, cellular infiltration, gliosis, demyelination, and severe necrosis (Pirko and Johnson, 2008). Finally, in agreement with previous studies in thiamine deficiency (Lee et al., 2001; Lee et al., 1995; Mascalchi et al., 2002; Murata et al., 2001; Pfefferbaum et al., 2007; Rose et al., 1993), but in contradiction to findings in neuroinflammatory diseases showing elevations in Cho (Inglese et al., 2003; Mader et al., 2008; Valcour et al., 2012), MRS in the thalamus detected lower NAA and lower Cho levels following thiamine deficiency. Since thiamine deficiency is associated with neuroinflammation (Beauchesne et al., 2009; Calingasan and Gibson, 2000; Ke and Gibson, 2004; McRee et al., 2000; Meng and Okeda, 2003; Nixon et al., 2008), this result suggests that Cho is not a selective marker for neuroinflammation (Chang et al., 2013; Mader et al., 2008). Thus, the MRI and MRS changes detected here at time 2, which likely represent the brain in a more inflamed than degenerated state, do not provide a unique signature for neuroinflammation.
Glucose challenge in a thiamine deficient state caused further ventricular enlargement, revealed thalamic hyperintensities, and showed a profound increase in thalamic lactate. Accumulation of lactate and associated pH changes are thought to promote cellular dysfunction and loss (Danielsen and Ross, 1999; Hakim, 1984; McRee et al., 2000; Siesjo, 1982) and worsen neurologic symptoms in thiamine-deficient patients (Navarro et al., 2005). Significant increases in lactate (cf., Rose et al., 1993; Rugilo et al., 2003) together with ventricular volume enlargement following glucose challenge are highly suggestive of neurodegenerative effects (Biros et al., 1986; Petito et al., 1987; Wagner et al., 1986).
Our correlational analysis demonstrated a relationship between MRS-detectable NAA (negative association) and lactate (positive association) in the thalamus and thalamic MCP-1 quantified postmortem. CNS cell death is associated with reduced levels of NAA and elevated levels of Lac (Higuchi et al., 1993; van der Toorn et al., 1994; Zahr et al., 2009a). Previous studies have posited that a positive relationship between extent of astrocytosis and microgliosis and of enlargement of ventricles indicates a role for inflammation in contributing to neuropathology (Xu et al., 2012). Support for such conclusions is unlikely given the difficulty in distinguishing between inflammation as a response or contributor to injury. MCP-1 is a powerful leukocyte recruitment/activation factor that is relatively specific for monocytes/macrophages (Toews et al., 1998) and is rapidly expressed in the brain following aspiration lesions (Muessel et al., 2000). Indeed, MCP-1 double-deficient mice do not show blood-borne macrophage recruitment (Schilling et al., 2009). The current study, however, cannot determine whether MCP-1 is secreted in response to injury (Minami and Satoh, 2003; Semple et al., 2010) or if it precedes injury and contributes to spreading a cytotoxic cascade from more to relatively less vulnerable brain regions (Yang et al., 2011).
The current study set out to establish an in vivo MR-detectable marker for neuroinflammation in an animal model of thiamine deficiency known to include neuroinflammatory components. Although a pattern of MR changes was evident prior to severe neurodegeneration as triggered by glucose challenge and indicated by a profound increase in lactate, the pattern of changes in MRI and MRS was not unique to neuroinflammation.
Table 1.
Number of animals in each assay
| Thiamines | MR Imaging | Liver Histology | Brain Histology | Brain Cytokines | |
|---|---|---|---|---|---|
| Thiamines | 56 | 24 | 56 | 10 | 38 |
| MR Imaging | 24 | 24 | 24 | 8 | 22 |
| Liver Histology | 56 | 24 | 56 | 10 | 38 |
| Brain Histology | 10 | 8 | 10 | 10 | 10 |
| Brain Cytokines | 38 | 22 | 38 | 10 | 38 |
Highlights.
In vivo MRI and postmortem brain cytokine biomarkers were identified in a controlled model of thiamine deficiency.
In vivo markers included enlarged ventricles and hyperintensities in the inferior colliculi of thiamine-deficient rats
Glucose administration in the context of thiamine deficiency rapidly intensified in vivo brain pathology
MCP-1 chemokine levels in the thalamus correlated selectively with in vivo measures of pathology.
Acknowledgments
Grants: AA005965, AA013521-INIA, AA017168-K05
Footnotes
Publisher's Disclaimer: This is a PDF file of an unedited manuscript that has been accepted for publication. As a service to our customers we are providing this early version of the manuscript. The manuscript will undergo copyediting, typesetting, and review of the resulting proof before it is published in its final citable form. Please note that during the production process errors may be discovered which could affect the content, and all legal disclaimers that apply to the journal pertain.
References
- Adalsteinsson E, Hurd RE, Mayer D, Sailasuta N, Sullivan EV, Pfefferbaum A. In vivo 2D J-resolved magnetic resonance spectroscopy of rat brain with a 3-T clinical human scanner. NeuroImage. 2004;22:381–386. doi: 10.1016/j.neuroimage.2003.12.046. [DOI] [PubMed] [Google Scholar]
- Bagory M, Durand-Dubief F, Ibarrola D, Comte JC, Cotton F, Confavreux C, Sappey-Marinier D. Implementation of an absolute brain 1H-MRS quantification method to assess different tissue alterations in multiple sclerosis. IEEE transactions on bio-medical engineering. 2012;59:2687–2694. doi: 10.1109/TBME.2011.2161609. [DOI] [PubMed] [Google Scholar]
- Beauchesne E, Desjardins P, Hazell AS, Butterworth RF. eNOS gene deletion restores blood-brain barrier integrity and attenuates neurodegeneration in the thiamine-deficient mouse brain. Journal of neurochemistry. 2009;111:452–459. doi: 10.1111/j.1471-4159.2009.06338.x. [DOI] [PubMed] [Google Scholar]
- Becker HC. Animal models of alcohol withdrawal. Alcohol Research Health. 2000;24:105–113. [PMC free article] [PubMed] [Google Scholar]
- Berger JR, Singhal D. The neurologic complications of bariatric surgery. Handb Clin Neurol. 2014;120:587–594. doi: 10.1016/B978-0-7020-4087-0.00039-5. [DOI] [PubMed] [Google Scholar]
- Biros MH, Dimlich RV, Barsan WG. Postinsult treatment of ischemia-induced cerebral lactic acidosis in the rat. Annals of emergency medicine. 1986;15:397–404. doi: 10.1016/s0196-0644(86)80174-3. [DOI] [PubMed] [Google Scholar]
- Blair PV, Kobayashi R, Edwards HM, 3rd, Shay NF, Baker DH, Harris RA. Dietary thiamin level influences levels of its diphosphate form and thiamin-dependent enzymic activities of rat liver. The Journal of nutrition. 1999;129:641–648. doi: 10.1093/jn/129.3.641. [DOI] [PubMed] [Google Scholar]
- Block ML, Hong JS. Microglia and inflammation-mediated neurodegeneration: multiple triggers with a common mechanism. Progress in neurobiology. 2005;76:77–98. doi: 10.1016/j.pneurobio.2005.06.004. [DOI] [PubMed] [Google Scholar]
- Brin M. Erythrocyte as a Biopsy Tissue for Functional Evaluation of Thiamine Adequacy. JAMA. 1964;187:762–766. doi: 10.1001/jama.1964.03060230090022. [DOI] [PubMed] [Google Scholar]
- Butterworth RF. Pathophysiology of alcoholic brain damage: synergistic effects of ethanol, thiamine deficiency and alcoholic liver disease. Metabolic brain disease. 1995;10:1–8. doi: 10.1007/BF01991777. [DOI] [PubMed] [Google Scholar]
- Calingasan NY, Gibson GE. Vascular endothelium is a site of free radical production and inflammation in areas of neuronal loss in thiamine-deficient brain. Annals of the New York Academy of Sciences. 2000;903:353–356. doi: 10.1111/j.1749-6632.2000.tb06386.x. [DOI] [PubMed] [Google Scholar]
- Chang L, Munsaka SM, Kraft-Terry S, Ernst T. Magnetic resonance spectroscopy to assess neuroinflammation and neuropathic pain. J Neuroimmune Pharmacol. 2013;8:576–593. doi: 10.1007/s11481-013-9460-x. [DOI] [PMC free article] [PubMed] [Google Scholar]
- Chronik B, Alejski A, Rutt BK. Design and fabrication of a three-axis multilayer gradient coil for magnetic resonance microscopy of mice. Magma. 2000a;10:131–146. doi: 10.1007/BF02601848. [DOI] [PubMed] [Google Scholar]
- Chronik BA, Alejski A, Rutt BK. Design and fabrication of a three-axis edge ROU head and neck gradient coil. Magn Reson Med. 2000b;44:955–963. doi: 10.1002/1522-2594(200012)44:6<955::aid-mrm18>3.0.co;2-1. [DOI] [PubMed] [Google Scholar]
- Ciccia RM, Langlais PJ. An examination of the synergistic interaction of ethanol and thiamine deficiency in the development of neurological signs and long-term cognitive and memory impairments. Alcoholism, clinical and experimental research. 2000;24:622–634. [PubMed] [Google Scholar]
- Collins GH. Glial cell changes in the brain stem of thiamine-deficient rats. The American journal of pathology. 1967;50:791–814. [PMC free article] [PubMed] [Google Scholar]
- Committee. Guide for the Care and Use of Laboratory Animals. 8. National Academies Press; Washington, D.C: 2010. [Google Scholar]
- Danielsen E, Ross BD. Magnetic resonance spectroscopy diagnosis of neurological diseases. 1. New York: 1999. [Google Scholar]
- Dreher W, Leibfritz D. Detection of homonuclear decoupled in vivo proton NMR spectra using constant time chemical shift encoding: CT-PRESS. Magnetic resonance imaging. 1999;17:141–150. doi: 10.1016/s0730-725x(98)00156-8. [DOI] [PubMed] [Google Scholar]
- Dror V, Eliash S, Rehavi M, Assaf Y, Biton IE, Fattal-Valevski A. Neurodegeneration in thiamine deficient rats-A longitudinal MRI study. Brain research. 2010;1308:176–184. doi: 10.1016/j.brainres.2009.10.032. [DOI] [PubMed] [Google Scholar]
- Fell GS, Talwar D. Assessment of status. Curr Opin Clin Nutr Metab Care. 1998;1:491–497. doi: 10.1097/00075197-199811000-00003. [DOI] [PubMed] [Google Scholar]
- Fernando MS, O’Brien JT, Perry RH, English P, Forster G, McMeekin W, Slade JY, Golkhar A, Matthews FE, Barber R, Kalaria RN, Ince PG Neuropathology Group of MC. Comparison of the pathology of cerebral white matter with postmortem magnetic resonance imaging (MRI) in the elderly brain. Neuropathol Appl Neurobiol. 2004;30:385–395. doi: 10.1111/j.1365-2990.2004.00550.x. [DOI] [PubMed] [Google Scholar]
- Graeber MB, Li W, Rodriguez ML. Role of microglia in CNS inflammation. FEBS letters. 2011;585:3798–3805. doi: 10.1016/j.febslet.2011.08.033. [DOI] [PubMed] [Google Scholar]
- Hakim AM. The induction and reversibility of cerebral acidosis in thiamine deficiency. Annals of neurology. 1984;16:673–679. doi: 10.1002/ana.410160609. [DOI] [PubMed] [Google Scholar]
- Harezlak J, Buchthal S, Taylor M, Schifitto G, Zhong J, Daar E, Alger J, Singer E, Campbell T, Yiannoutsos C, Cohen R, Navia B, Consortium HIVN. Persistence of HIV-associated cognitive impairment, inflammation, and neuronal injury in era of highly active antiretroviral treatment. AIDS. 2011;25:625–633. doi: 10.1097/QAD.0b013e3283427da7. [DOI] [PMC free article] [PubMed] [Google Scholar]
- Harper CG. Sudden, unexpected death and Wernicke’s encephalopathy: a complication of prolonged intravenous feeding. Aust N Z J Med. 1980;10:230–235. doi: 10.1111/j.1445-5994.1980.tb03720.x. [DOI] [PubMed] [Google Scholar]
- Higuchi T, Fernandez EJ, Maudsley AA, Weiner MW. Mapping of cerebral metabolites in rats by 1H magnetic resonance spectroscopic imaging. Distribution of metabolites in normal brain and postmortem changes. NMR in biomedicine. 1993;6:311–317. doi: 10.1002/nbm.1940060505. [DOI] [PubMed] [Google Scholar]
- Inglese M, Li BS, Rusinek H, Babb JS, Grossman RI, Gonen O. Diffusely elevated cerebral choline and creatine in relapsing-remitting multiple sclerosis. Magn Reson Med. 2003;50:190–195. doi: 10.1002/mrm.10481. [DOI] [PubMed] [Google Scholar]
- Jordan LR, Zelaya FO, Rose SE, Bower AJ, Galloway G, Wholohan T, Nixon PF. Changes in the hippocampus induced by glucose in thiamin deficient rats detected by MRI. Brain research. 1998;791:347–351. doi: 10.1016/s0006-8993(98)00203-0. [DOI] [PubMed] [Google Scholar]
- Jung YC, Chanraud S, Sullivan EV. Neuroimaging of Wernicke’s encephalopathy and Korsakoff’s syndrome. Neuropsychol Rev. 2012;22:170–180. doi: 10.1007/s11065-012-9203-4. [DOI] [PMC free article] [PubMed] [Google Scholar]
- Karuppagounder SS, Shi Q, Xu H, Gibson GE. Changes in inflammatory processes associated with selective vulnerability following mild impairment of oxidative metabolism. Neurobiology of disease. 2007;26:353–362. doi: 10.1016/j.nbd.2007.01.011. [DOI] [PMC free article] [PubMed] [Google Scholar]
- Ke ZJ, Calingasan NY, DeGiorgio LA, Volpe BT, Gibson GE. CD40-CD40L interactions promote neuronal death in a model of neurodegeneration due to mild impairment of oxidative metabolism. Neurochemistry international. 2005;47:204–215. doi: 10.1016/j.neuint.2005.03.002. [DOI] [PubMed] [Google Scholar]
- Ke ZJ, Gibson GE. Selective response of various brain cell types during neurodegeneration induced by mild impairment of oxidative metabolism. Neurochemistry international. 2004;45:361–369. doi: 10.1016/j.neuint.2003.09.008. [DOI] [PubMed] [Google Scholar]
- Kirov II, Patil V, Babb JS, Rusinek H, Herbert J, Gonen O. MR spectroscopy indicates diffuse multiple sclerosis activity during remission. J Neurol Neurosurg Psychiatry. 2009;80:1330–1336. doi: 10.1136/jnnp.2009.176263. [DOI] [PMC free article] [PubMed] [Google Scholar]
- Langlais PJ, Zhang SX. Cortical and subcortical white matter damage without Wernicke’s encephalopathy after recovery from thiamine deficiency in the rat. Alcoholism, clinical and experimental research. 1997;21:434–443. doi: 10.1111/j.1530-0277.1997.tb03788.x. [DOI] [PubMed] [Google Scholar]
- Lee DC, Chu J, Satz W, Silbergleit R. Low plasma thiamine levels in elder patients admitted through the emergency department. Acad Emerg Med. 2000;7:1156–1159. doi: 10.1111/j.1553-2712.2000.tb01268.x. [DOI] [PubMed] [Google Scholar]
- Lee H, Holburn GE, Price RR. In vivo and in vitro proton NMR spectroscopic studies of thiamine-deficient rat brains. J Magn Reson Imaging. 2001;13:163–166. doi: 10.1002/1522-2586(200102)13:2<163::aid-jmri1025>3.0.co;2-z. [DOI] [PubMed] [Google Scholar]
- Lee H, Tarter J, Holbourn GE, Price RR, Weinstein DD, Martin PR. In vivo localized proton NMR spectroscopy of thiamine-deficient rat brain. Magn Reson Med. 1995;34:313–318. doi: 10.1002/mrm.1910340306. [DOI] [PubMed] [Google Scholar]
- Liu M, Alimov AP, Wang H, Frank JA, Katz W, Xu M, Ke ZJ, Luo J. Thiamine deficiency induces anorexia by inhibiting hypothalamic AMPK. Neuroscience. 2014;267:102–113. doi: 10.1016/j.neuroscience.2014.02.033. [DOI] [PMC free article] [PubMed] [Google Scholar]
- Mader I, Rauer S, Gall P, Klose U. (1)H MR spectroscopy of inflammation, infection and ischemia of the brain. European journal of radiology. 2008;67:250–257. doi: 10.1016/j.ejrad.2008.02.033. [DOI] [PubMed] [Google Scholar]
- Mancinelli R, Ceccanti M, Guiducci MS, Sasso GF, Sebastiani G, Attilia ML, Allen JP. Simultaneous liquid chromatographic assessment of thiamine, thiamine monophosphate and thiamine diphosphate in human erythrocytes: a study on alcoholics. Journal of Chromatography B Analyt Technol Biomed Life Sci. 2003;789:355–363. doi: 10.1016/s1570-0232(03)00139-9. [DOI] [PubMed] [Google Scholar]
- Mascalchi M, Belli G, Guerrini L, Nistri M, Del Seppia I, Villari N. Proton MR spectroscopy of Wernicke encephalopathy. Ajnr. 2002;23:1803–1806. [PMC free article] [PubMed] [Google Scholar]
- Mayer D, Spielman DM. Detection of glutamate in the human brain at 3 T using optimized constant time point resolved spectroscopy. Magn Reson Med. 2005;54:439–442. doi: 10.1002/mrm.20571. [DOI] [PubMed] [Google Scholar]
- McLarnon JG. Correlated Inflammatory Responses and Neurodegeneration in Peptide-Injected Animal Models of Alzheimer’s Disease. Biomed Res Int. 2014;2014:923670. doi: 10.1155/2014/923670. [DOI] [PMC free article] [PubMed] [Google Scholar]
- McRee RC, Terry-Ferguson M, Langlais PJ, Chen Y, Nalwalk JW, Blumenstock FA, Hough LB. Increased histamine release and granulocytes within the thalamus of a rat model of Wernicke’s encephalopathy. Brain research. 2000;858:227–236. doi: 10.1016/s0006-8993(99)02309-4. [DOI] [PubMed] [Google Scholar]
- Meng JS, Okeda R. Neuropathological study of the role of mast cells and histamine-positive neurons in selective vulnerability of the thalamus and inferior colliculus in thiamine-deficient encephalopathy. Neuropathology : official journal of the Japanese Society of Neuropathology. 2003;23:25–35. doi: 10.1046/j.1440-1789.2003.00481.x. [DOI] [PubMed] [Google Scholar]
- Merola JF, Ghoroghchian PP, Samuels MA, Levy BD, Loscalzo J. Clinical problem-solving. At a loss. N Engl J Med. 2012;367:67–72. doi: 10.1056/NEJMcps1111668. [DOI] [PubMed] [Google Scholar]
- Minami M, Satoh M. Chemokines and their receptors in the brain: pathophysiological roles in ischemic brain injury. Life sciences. 2003;74:321–327. doi: 10.1016/j.lfs.2003.09.019. [DOI] [PubMed] [Google Scholar]
- Muessel MJ, Berman NE, Klein RM. Early and specific expression of monocyte chemoattractant protein-1 in the thalamus induced by cortical injury. Brain research. 2000;870:211–221. doi: 10.1016/s0006-8993(00)02450-1. [DOI] [PubMed] [Google Scholar]
- Murata T, Fujito T, Kimura H, Omori M, Itoh H, Wada Y. Serial MRI and (1)H-MRS of Wernicke’s encephalopathy: report of a case with remarkable cerebellar lesions on MRI. Psychiatry research. 2001;108:49–55. doi: 10.1016/s0925-4927(01)00304-3. [DOI] [PubMed] [Google Scholar]
- Najjar S, Pearlman DM, Hirsch S, Friedman K, Strange J, Reidy J, Khoukaz M, Ferrell RB, Devinsky O, Najjar A, Zagzag D. Brain biopsy findings link major depressive disorder to neuroinflammation, oxidative stress, and neurovascular dysfunction: a case report. Biological psychiatry. 2014;75:e23–26. doi: 10.1016/j.biopsych.2013.07.041. [DOI] [PubMed] [Google Scholar]
- Navarro D, Zwingmann C, Hazell AS, Butterworth RF. Brain lactate synthesis in thiamine deficiency: a re-evaluation using 1H-13C nuclear magnetic resonance spectroscopy. Journal of neuroscience research. 2005;79:33–41. doi: 10.1002/jnr.20290. [DOI] [PubMed] [Google Scholar]
- Nixon PF, Jordan L, Zimitat C, Rose SE, Zelaya F. Choroid plexus dysfunction: the initial event in the pathogenesis of Wernicke’s encephalopathy and ethanol intoxication. Alcoholism, clinical and experimental research. 2008;32:1513–1523. doi: 10.1111/j.1530-0277.2008.00723.x. [DOI] [PubMed] [Google Scholar]
- Okada T, Sakamoto S, Nakamoto Y, Kohara N, Senda M. Reproducibility of magnetic resonance spectroscopy in correlation with signal-to-noise ratio. Psychiatry research. 2007;156:169–174. doi: 10.1016/j.pscychresns.2007.03.007. [DOI] [PubMed] [Google Scholar]
- Paxinos G, Watson C. The Rat Brain in Stereotaxic Coordinates. Elsevier Academic Press; London: 2005. [Google Scholar]
- Petito CK, Kraig RP, Pulsinelli WA. Light and electron microscopic evaluation of hydrogen ion-induced brain necrosis. J Cereb Blood Flow Metab. 1987;7:625–632. doi: 10.1038/jcbfm.1987.115. [DOI] [PMC free article] [PubMed] [Google Scholar]
- Pfefferbaum A, Adalsteinsson E, Bell RL, Sullivan EV. Development and resolution of brain lesions caused by pyrithiamine- and dietary-Induced thiamine deficiency and alcohol exposure in the alcohol-preferring rat: A longitudinal magnetic resonance imaging and spectroscopy study. Neuropsychopharmacology. 2007;32:1149–1177. doi: 10.1038/sj.npp.1301107. [DOI] [PubMed] [Google Scholar]
- Pirko I, Johnson AJ. Neuroimaging of demyelination and remyelination models. Curr Top Microbiol Immunol. 2008;318:241–266. doi: 10.1007/978-3-540-73677-6_10. [DOI] [PubMed] [Google Scholar]
- Pitkin SR, Savage LM. Aging potentiates the acute and chronic neurological symptoms of pyrithiamine-induced thiamine deficiency in the rodent. Behavioural brain research. 2001;119:167–177. doi: 10.1016/s0166-4328(00)00350-8. [DOI] [PubMed] [Google Scholar]
- Rigotti DJ, Gass A, Achtnichts L, Inglese M, Babb JS, Naegelin Y, Hirsch J, Amann M, Kappos L, Gonen O. Multiple Sclerosis Severity Scale and whole-brain N-acetylaspartate concentration for patients’ assessment. Multiple sclerosis (Houndmills, Basingstoke, England) 2012;18:98–107. doi: 10.1177/1352458511415142. [DOI] [PMC free article] [PubMed] [Google Scholar]
- Roberts AJ, Cole M, Koob GF. Intra-amygdala muscimol decreases operant ethanol self-administration in dependent rats. Alcohol Clin Exp Res. 1996;20:1289–1298. doi: 10.1111/j.1530-0277.1996.tb01125.x. [DOI] [PubMed] [Google Scholar]
- Robertson DM, Wasan SM, Skinner DB. Ultrastructural features of early brain stem lesions of thiamine-deficient rats. The American journal of pathology. 1968;52:1081–1097. [PMC free article] [PubMed] [Google Scholar]
- Rose SE, Nixon PF, Zelaya FO, Wholohan BT, Zimitat C, Moxon LN, Crozier S, Brereton IM, Doddrell DM. Application of high field localised in vivo 1H MRS to study biochemical changes in the thiamin deficient rat brain under glucose load. NMR Biomed. 1993;6:324–328. doi: 10.1002/nbm.1940060507. [DOI] [PubMed] [Google Scholar]
- Rugilo CA, Uribe Roca MC, Zurru MC, Capizzano AA, Pontello GA, Gatto EM. Proton MR spectroscopy in Wernicke encephalopathy. Ajnr. 2003;24:952–955. [PMC free article] [PubMed] [Google Scholar]
- Sanchez-Guajardo V, Barnum CJ, Tansey MG, Romero-Ramos M. Neuroimmunological processes in Parkinson’s disease and their relation to alpha-synuclein: microglia as the referee between neuronal processes and peripheral immunity. ASN neuro. 2013;5:113–139. doi: 10.1042/AN20120066. [DOI] [PMC free article] [PubMed] [Google Scholar]
- Schilling M, Strecker JK, Ringelstein EB, Kiefer R, Schabitz WR. Turn-over of meningeal and perivascular macrophages in the brain of MCP-1-, CCR-2- or double knockout mice. Experimental neurology. 2009;219:583–585. doi: 10.1016/j.expneurol.2009.07.003. [DOI] [PubMed] [Google Scholar]
- Schweinsburg BC, Taylor MJ, Alhassoon OM, Gonzalez R, Brown GG, Ellis RJ, Letendre S, Videen JS, McCutchan JA, Patterson TL, Grant I, Group H. Brain mitochondrial injury in human immunodeficiency virus-seropositive (HIV+) individuals taking nucleoside reverse transcriptase inhibitors. Journal of neurovirology. 2005;11:356–364. doi: 10.1080/13550280591002342. [DOI] [PubMed] [Google Scholar]
- Semple BD, Kossmann T, Morganti-Kossmann MC. Role of chemokines in CNS health and pathology: a focus on the CCL2/CCR2 and CXCL8/CXCR2 networks. J Cereb Blood Flow Metab. 2010;30:459–473. doi: 10.1038/jcbfm.2009.240. [DOI] [PMC free article] [PubMed] [Google Scholar]
- Siesjo BK. Lactic acidosis in the brain: occurrence, triggering mechanisms and pathophysiological importance. Ciba Found Symp. 1982;87:77–100. doi: 10.1002/9780470720691.ch5. [DOI] [PubMed] [Google Scholar]
- Sullivan TJ. Thiamine deficiency presenting as opisthotonus. J Pediatr. 1970;77:1092–1093. doi: 10.1016/s0022-3476(70)80104-4. [DOI] [PubMed] [Google Scholar]
- Tellez I, Terry RD. Fine structure of the early changes in the vestibular nuclei of the thiamine-deficient rat. The American journal of pathology. 1968;52:777–794. [PMC free article] [PubMed] [Google Scholar]
- Todd KG, Butterworth RF. Early microglial response in experimental thiamine deficiency: an immunohistochemical analysis. Glia. 1999;25:190–198. doi: 10.1002/(sici)1098-1136(19990115)25:2<190::aid-glia9>3.0.co;2-b. [DOI] [PubMed] [Google Scholar]
- Toews AD, Barrett C, Morell P. Monocyte chemoattractant protein 1 is responsible for macrophage recruitment following injury to sciatic nerve. Journal of neuroscience research. 1998;53:260–267. doi: 10.1002/(SICI)1097-4547(19980715)53:2<260::AID-JNR15>3.0.CO;2-A. [DOI] [PubMed] [Google Scholar]
- Tourdias T, Hiba B, Raffard G, Biran M, Nishiguchi T, Aussudre J, Franconi JM, Brochet B, Petry KG, Dousset V. Adapted focal experimental autoimmune encephalomyelitis to allow MRI exploration of multiple sclerosis features. Experimental neurology. 2011;230:248–257. doi: 10.1016/j.expneurol.2011.04.023. [DOI] [PubMed] [Google Scholar]
- Upthegrove R, Manzanares-Teson N, Barnes NM. Cytokine function in medication-naive first episode psychosis: a systematic review and meta-analysis. Schizophrenia research. 2014;155:101–108. doi: 10.1016/j.schres.2014.03.005. [DOI] [PubMed] [Google Scholar]
- Valcour V, Chalermchai T, Sailasuta N, Marovich M, Lerdlum S, Suttichom D, Suwanwela NC, Jagodzinski L, Michael N, Spudich S, van Griensven F, de Souza M, Kim J, Ananworanich J, Group RSS. Central nervous system viral invasion and inflammation during acute HIV infection. J Infect Dis. 2012;206:275–282. doi: 10.1093/infdis/jis326. [DOI] [PMC free article] [PubMed] [Google Scholar]
- van der Toorn A, Verheul HB, Berkelbach van der Sprenkel JW, Tulleken CA, Nicolay K. Changes in metabolites and tissue water status after focal ischemia in cat brain assessed with localized proton MR spectroscopy. Magn Reson Med. 1994;32:685–691. doi: 10.1002/mrm.1910320602. [DOI] [PubMed] [Google Scholar]
- Vemuganti R, Kalluri H, Yi JH, Bowen KK, Hazell AS. Gene expression changes in thalamus and inferior colliculus associated with inflammation, cellular stress, metabolism and structural damage in thiamine deficiency. The European journal of neuroscience. 2006;23:1172–1188. doi: 10.1111/j.1460-9568.2006.04651.x. [DOI] [PubMed] [Google Scholar]
- Vetreno RP, Ramos RL, Anzalone S, Savage LM. Brain and behavioral pathology in an animal model of Wernicke’s encephalopathy and Wernicke-Korsakoff Syndrome. Brain Res. 2012;1436:178–192. doi: 10.1016/j.brainres.2011.11.038. [DOI] [PMC free article] [PubMed] [Google Scholar]
- Victor M, Adams RD, Collins GH. The Wernicke-Korsakoff Syndrome. F.A. Davis Co; Philadelphia: 1971. [PubMed] [Google Scholar]
- Victor M, Adams RD, Collins GH. The Wernicke-Korsakoff Syndrome and Related Neurologic Disorders Due to Alcoholism and Malnutrition. 2. F.A. Davis Co; Philadelphia: 1989. [Google Scholar]
- Wagner KR, Ting P, Westfall MV, Yamaguchi S, Bacher JD, Myers RE. Brain metabolic correlates of hypoxic-ischemic cerebral necrosis in mid-gestational sheep fetuses: significance of hypotension. J Cereb Blood Flow Metab. 1986;6:425–434. doi: 10.1038/jcbfm.1986.75. [DOI] [PubMed] [Google Scholar]
- Wallis WE, Willoughby E, Baker P. Coma in the Wernicke-Korsakoff syndrome. Lancet. 1978;2:400–401. doi: 10.1016/s0140-6736(78)91867-6. [DOI] [PubMed] [Google Scholar]
- Warnock LG, Prudhomme CR, Wagner C. The determination of thiamin pyrophosphate in blood and other tissues, and its correlation with erythrocyte transketolase activity. The Journal of Nutrition. 1978;108:421–427. doi: 10.1093/jn/108.3.421. [DOI] [PubMed] [Google Scholar]
- Watanabe I, Kanabe S. Early edematous lesion of pyrithiamine induced acute thiamine deficient encephalopathy in the mouse. J Neuropathol Exp Neurol. 1978;37:401–413. doi: 10.1097/00005072-197807000-00004. [DOI] [PubMed] [Google Scholar]
- Watson AJ, Walker JF, Tomkin GH, Finn MM, Keogh JA. Acute Wernickes encephalopathy precipitated by glucose loading. Ir J Med Sci. 1981;150:301–303. doi: 10.1007/BF02938260. [DOI] [PubMed] [Google Scholar]
- Xu H, Zhang SL, Tan GW, Zhu HW, Huang CQ, Zhang FF, Wang ZX. Reactive gliosis and neuroinflammation in rats with communicating hydrocephalus. Neuroscience. 2012;218:317–325. doi: 10.1016/j.neuroscience.2012.05.004. [DOI] [PubMed] [Google Scholar]
- Yaksh TL, Kohl RL, Rudy TA. Induction of tolerance and withdrawal in rats receiving morphine in the spinal subarachnoid space. Eur J Pharmacol. 1977;42:275–284. doi: 10.1016/0014-2999(77)90294-1. [DOI] [PubMed] [Google Scholar]
- Yang G, Meng Y, Li W, Yong Y, Fan Z, Ding H, Wei Y, Luo J, Ke ZJ. Neuronal MCP-1 mediates microglia recruitment and neurodegeneration induced by the mild impairment of oxidative metabolism. Brain pathology (Zurich, Switzerland) 2011;21:279–297. doi: 10.1111/j.1750-3639.2010.00445.x. [DOI] [PMC free article] [PubMed] [Google Scholar]
- Zahr NM, Crawford EL, Hsu O, Vinco S, Mayer D, Rohlfing T, Sullivan EV, Pfefferbaum A. In vivo glutamate decline associated with kainic acid-induced status epilepticus. Brain research. 2009a;1300:65–78. doi: 10.1016/j.brainres.2009.08.060. [DOI] [PMC free article] [PubMed] [Google Scholar]
- Zahr NM, Mayer D, Rohlfing T, Orduna J, Luong R, Sullivan EV, Pfefferbaum A. A mechanism of rapidly reversible cerebral ventricular enlargement independent of tissue atrophy. Neuropsychopharmacology. 2013;38:1121–1129. doi: 10.1038/npp.2013.11. [DOI] [PMC free article] [PubMed] [Google Scholar]
- Zahr NM, Mayer D, Vinco S, Orduna J, Luong R, Sullivan EV, Pfefferbaum A. In vivo evidence for alcohol-induced neurochemical changes in rat brain without protracted withdrawal, pronounced thiamine deficiency, or severe liver damage. Neuropsychopharmacology. 2009b;34:1427–1442. doi: 10.1038/npp.2008.119. [DOI] [PMC free article] [PubMed] [Google Scholar]
- Zhang SX, Weilersbacher GS, Henderson SW, Corso T, Olney JW, Langlais PJ. Excitotoxic cytopathology, progression, and reversibility of thiamine deficiency-induced diencephalic lesions. J Neuropathol Exp Neurol. 1995;54:255–267. doi: 10.1097/00005072-199503000-00012. [DOI] [PubMed] [Google Scholar]