


Abstract
Protein p6 of Bacillus subtilis bacteriophage Φ29 is essential for phage development. In vitro it activates the initiation of DNA replication and is involved in the early to late transcriptional switch. These activities require the formation of a nucleoprotein complex in which the DNA forms a right-handed superhelix wrapping around a multimeric protein core. However, there was no evidence of p6 binding to Φ29 DNA in vivo. By crosslinking, chromatin immunoprecipitation and real-time PCR we show that protein p6 binds to most, if not all, the viral genome in vivo, although with higher affinity for both DNA ends, which contain the replication origins. In contrast, the affinity for plasmid DNA is negligible, but greatly increases when the negative supercoiling decreases, as shown in vivo by treatment of cells with novobiocin and in vitro by fluorescence quenching with plasmids with different topology. In conclusion, binding of protein p6 all along the Φ29 genome strongly suggests that its functions in replication and transcription control could be local outcomes of a more global role as a histone-like protein. The p6 binding dependence on DNA topology could explain its preferential binding to viral with respect to bacterial DNA, whose level of negative supercoiling is presumably higher than that of Φ29 DNA.
INTRODUCTION
In living cells, genomes are packed and organized by architectural proteins associated with DNA. Randomly folded naked DNA would occupy a much larger volume than that of the nuclear compartment or the bacterial cell. Besides, such DNA would be unable to correctly perform essential functions such as replication, transcription, recombination, repair, segregation, mitosis or meiosis. These processes require the interaction of proteins that modify the conformation of DNA by inducing compaction, bending and/or supercoiling.
In Eukarya the main architectural proteins are histones, which compact and scaffold chromosomes into a chromatin fiber formed by nucleosomes. Histones drive structural changes in chromatin to regulate the accessibility and transcriptional state of genes (for a review see 1). Other non-histone, sequence-unspecific DNA-binding proteins, such as HMG, also participate in structuring the DNA by competing with and modulating histone binding and by inducing curvature and distortions in DNA (for a review see 2). Condensins and cohesins are members of the SMC proteins, a family of chromosomal ATPases that play central roles in chromosome condensation and sister chromatid cohesion, respectively (for a review see 3). As purified mitotic 13S condensin induces positive supercoiling in plasmid DNA, it is believed that condensin regularly supercoils interphase chromatin by affecting global writhe (4).
In Eubacteria the DNA architectural role has been allotted to the so-called histone-like proteins (for reviews see 5,6). These proteins are mostly sequence-non-specific and are proposed to distribute along the entire nucleoid, as shown mainly by fluorescence approaches (7–9). In Escherichia coli the most abundant ones are HU, Fis, H-NS, IHF, Dps and StpA (10). In Bacillus subtilis it has been proposed that other proteins such as HBsu (7) and L24 (11) organize the nucleoid in vivo or play a local architectural role like LrpC (12,13). A single SMC protein is also found in B.subtilis, but not in E.coli, which however contains a protein, MukB, with a similar structure. Like their eukaryotic counterparts, both SMC and MukB are essential for chromosome condensation, supercoiling and correct partitioning (for a review see 14).
B.subtilis phage Φ29 protein p6 is small (103 amino acids) (15) and very abundant, at ∼700 000 copies/infected cell, 1.4 times the amount necessary to cover all the Φ29 DNA molecules present at mid-infection times (16). Comparatively, the most abundant histone-like protein of E.coli, Dps, reaches 180 000 copies/cell in late stationary phase, and HU 60 000 copies/cell (10); in B.subtilis, HBsu attains 50 000 copies/cell, only 0.2-fold the amount necessary to bind the full Φ29 DNA (17). In vitro protein p6 binds DNA without sequence specificity (18,19), restraining positive supercoils on a covalently closed DNA, similarly to condensins, involved in the high order compaction of DNA needed for the formation of mitotic chromosomes (20). A model has been proposed for the p6–DNA nucleoprotein complex, in which the DNA is right-handedly wrapped around a multimeric core of protein p6, therefore restraining positive supercoiling (21), with a ΔLk of +0.1 per single protein p6 dimer (18). Finally, protein p6 has a pleiotropic effect, participating in viral DNA replication and transcription control. In vitro p6 binds to Φ29 DNA termini to enhance the initiation of DNA replication (22) from the origins located at both DNA ends and to repress transcription from the early promoter C2 at the right DNA end (23–25). Protein p6 also binds to the central transcription control region where, together with the viral transcription regulator p4, it triggers the switch of in vitro transcription from the main early promoters A2b and A2c to the late promoter A3 (26–28). However, and in spite of all the wealth of in vitro data, there was no in vivo evidence of p6 binding to DNA.
Consequently, to determine whether protein p6 indeed binds Φ29 DNA in vivo and, if so, to test its binding specificity, we used formaldehyde-crosslinked chromatin immunoprecipitation (X-ChIP) (29,30). This powerful technique has allowed mapping of the in vivo DNA-binding sites of diverse proteins of many organisms (for a review see 31), including such B.subtilis proteins as SMC (9). To obtain quantitative data on protein p6 binding affinities for different DNA regions we combined the X-ChIP approach with real-time PCR.
In this work we show that protein p6 is able to bind most, if not all, the viral genome, strongly suggesting that its functions in DNA replication and transcriptional control are local outcomes of a more general role as an architectural protein. We also show that binding to the viral DNA is much higher than that to plasmid DNA. However, the affinity for the latter is enhanced when negative supercoiling is decreased, as shown in vivo and in vitro. Protein p6 supercoiling-dependent binding could be the basis for the preferential binding to Φ29 with respect to plasmid DNA.
MATERIALS AND METHODS
Bacteria, plasmids and phages
Bacillus subtilis 110NA (trpC2, spoOA3, su–) (32) containing pUB110 derivatives pPR55w6 and pPR55ow6 (33) was used. Figure 1 shows a map of these plasmids, which contain Φ29 gene 6 in either the correct (w6) or inverted (ow6) orientation. Phage Φ29 sus 14 (1242), a delayed lysis mutant (34), was used for all infections. Bacteria were grown in LB broth supplemented with 5 mM MgSO4. Phleomycin (Cayla S.A.R.L.) was added to the medium at a final concentration of 0.8 µg/ml. As a source of plasmid pL259, a BlueScript KS Plus derivative (35), a strain of E.coli DH5α was used; in this case, 10 µg/ml ampicillin was added to the medium.
Figure 1.
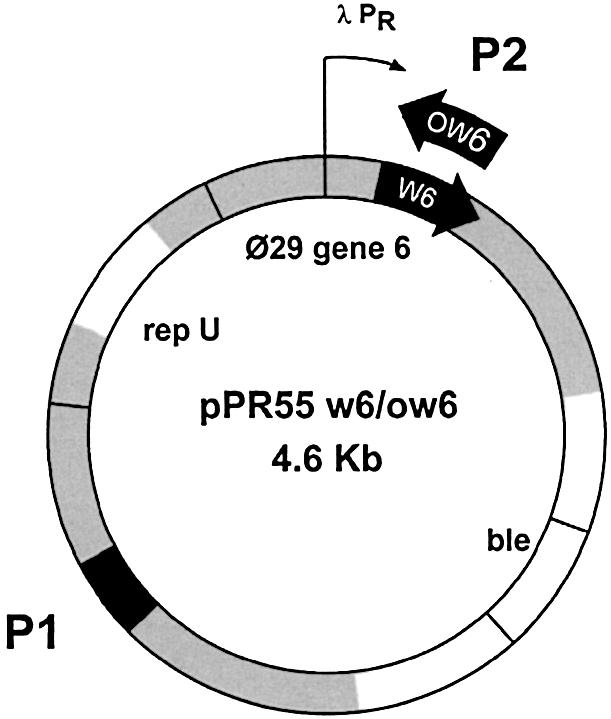
Map of plasmids pPR55w6 and pPR55ow6. These plasmids (4.6 kb) contain Φ29 gene 6 under the control of the λ PR promoter in pPR55w6 or in the inverted orientation in pPR55ow6. Genes encoding the replication protein repU and for phleomycin resistance (ble) are indicated. The sequences selected for PCR amplification are shown in black and the protein p6-binding regions studied, P1 and P2, are shown in gray, as explained in Figure 2B.
Reagents
Micrococcal nuclease was from Amersham Pharmacia Biotech and proteinase K from Boehringer Mannheim. Wheatgerm topoisomerase I was acquired from Promega and SpeI from New England Biolabs. Protein A–Sepharose CL-4B, lysozyme, RNase A, ampicillin, chloramphenicol, novobiocin, nalidixic acid and chloroquine were from Sigma. Formaldehyde at 37% was purchased from Calbiochem.
DNAs and oligonucleotides
Proteinase K-digested Φ29 DNA was obtained as described (36); plasmids pPR55ow6 and pL259, used for fluorescence measurements, were purified using a Promega Wizard Plus SV miniprep kit. The sequences of the oligonucleotides used for PCR (Isogen) and the coordinates of the amplified DNA sequences are depicted in Table 1.
Table 1. Oligonucleotides used in this work.
| Region | Coordinates | Sequence |
|---|---|---|
| Φ1 |
U-1 |
5′-AAAGTAAGCCCCCACCCTCACATG |
| |
L-259 |
5′-GCCCACATACTTTGTTGATTGG |
| Φ2 |
U-4895 |
5′-GATTTCTCTCTGCATCATTTTTGC |
| |
L-5257 |
5′-CAAAATATCTTCGTGTTCTTCTGG |
| Φ3 |
U-7255 |
5′-GAAGTAGATGATATTAAGGACGCC |
| |
L-7528 |
5′-CTGACAGAAGACCAAGCACATCGG |
| Φ4 |
U-9507 |
5′-CTGACAACATCGGAAATTACAGCG |
| |
L-9820 |
5′-TTGTTGTAAACGTCTCTCTGACCC |
| Φ5 |
U-11567 |
5′-GGATTCTCAATGACGGGTTAGA |
| |
L-11778 |
5′-CACATACACAGGAAAACCAGACTC |
| Φ6 |
U-18988 |
5′-AAATAGATTTTCTTTCTTGGCTAC |
| |
L-1928 |
5′-AAAGTAGGGTACAGCGACAACATAC |
| P1 |
U-2578 |
5′-GGGCACAAATCGCATCGTGGAACG |
| |
L-2873 |
5′-TCTTGGTCGTCAGACTGATGGGCC |
| P2 |
U-155 |
5′-GGGCACAAATCGCATCGTGGAACG |
| L-456 | 5′-TCTTGGTCGTCAGACTGATGGGCC |
Sequences of the primers used for amplification of Φ29 (Φ1–Φ6) or plasmid (P1 and P2) DNA sequences. The coordinates of the terminal 5′ nucleotides are given, indicating whether they correspond to the upper (U) or lower (L) strand.
Crosslinking, immunoprecipitation and DNA amplification
The X-ChIP was performed basically as described (37). Analysis of DNA samples was performed by real-time PCR in a Light-Cycler instrument using a Light Cycler-FastStart DNA Master SYBR Green I hot-start reaction mix (Roche). Samples corresponding to total, αp6-immunoprecipitated or preimmune serum (pi)-immunoprecipitated DNA were amplified for each DNA region using the primers depicted in Table 1. The crossing points (the cycle at which amplification enters the exponential phase) were determined and data were interpolated to a standard curve constructed with known amounts of purified, full-length Φ29 or plasmid DNA. The raw data were expressed as pg Φ29 or plasmid DNA per ml culture. Protein p6 binding was expressed as the immunoprecipitation coefficient (IC), the quotient between the specifically immunoprecipitated DNA (αp6 – pi) and the total DNA amount for a given region.
The amplification conditions included a preheating step of 20 min at 95°C to activate the polymerase, followed by 30 cycles comprising a denaturation step of 15 s at 95°C for all regions, a hybridization step of 5 s at 53°C for regions Φ1 and Φ5, 5 s at 50°C for Φ6, 10 s at 51°C for Φ3 and Φ4, 10 s at 50°C for P1 and 10 s at 48°C for Φ2 and P2, and an elongation step at 72°C lasting 15 s for Φ1 and Φ5, 30 s for Φ3 and Φ4, 40 s for Φ6 and P1 and 60 s for Φ2 and P2. Finally, a melting analysis was performed by continuous fluorescence measurement from 65 to 95°C, to ensure the presence of a single specific amplification product. Non-specific hybridization of primers to bacterial DNA was previously ruled out in a control with uninfected cells.
Topoisomer analysis
For the analysis of plasmid pPR55ow6 isolated from novobiocin- or nalidixic acid-treated cells, ∼1 µg purified plasmid was treated with 1 U topoisomerase I for 30 s at 30°C in a buffer containing 50 mM Tris–HCl, pH 7.5, 50 mM NaCl, 0.1 mM EDTA, 1 mM dithiothreitol and 10 mM MgCl2. Reactions were stopped by addition of SDS to 1% and samples applied to a 1.2% agarose gel. Electrophoresis was run in 1× TBE buffer (90 mM Tris–borate and 2 mM EDTA) for 14 h at 35 V and 3 h at 100 V. The gel was soaked in 1 µg/ml chloroquine for 4 h, rotated 90° and electrophoresed at 100 V for 3 h. Finally, the gel was stained with ethidium bromide and photographed with a UviDoc-008.XD apparatus. Image processing and densitometry was performed with ImageQuant software. The median of the topoisomer distribution was calculated as described (38).
For the fluorescence measurements, stocks of plasmid pL259 with different topoisomer distributions were obtained by treatment for different times with 10 U topoisomerase I and, where indicated, with protein p6 to induce positive supercoiling. Samples were digested with proteinase K and purified by phenol extraction and ethanol precipitation. Aliquots were taken and subjected to 2-dimensional agarose gel electrophoresis as described above. The linearized form of plasmid pL259 was obtained by digestion with SpeI.
Fluorescence measurements
Fluorescence measurements were performed in a Varian Cary Eclipse spectrofluorometer and monitored in a 2 mm path length cell at a temperature of 15°C. The tryptophan residue of protein p6 was excited at a wavelength of 290 nm and fluorescence measured at 350 nm.
The value of maximal quenching of fluorescence (Qmax = 0.84) upon DNA binding was determined by reverse titration experiments in which increasing amounts of linearized plasmid pL259 were added to a fixed amount of protein p6. The experiments were done in 50 mM Tris–HCl, pH 7.5, 10 mM MgCl2, at a protein p6 concentration of 1, 3, 7 and 12 µM to ensure that the point of complete saturation was reached (39). The fluorescence emission constant (fA = 290/µM) of free protein p6 was determined by measuring the fluorescence of increasing amounts of p6 in the absence of DNA.
To determine the effective binding constant (Keff = Kω, ω being the cooperativity) of protein p6 to the different topological forms of the plasmid, direct titration experiments were performed (40,41). Protein p6 was added to plasmid DNA (20 µM) in 50 mM Tris–HCl, pH 7.5, 10 mM MgCl2, measuring fluorescence after mixing the sample by gentle shaking and incubating for 30–60 s. To calculate Keff, we carried out a fitting procedure based on previously published expressions (40) and on the theory of McGhee and von Hippel (42) for the binding of proteins to polynucleotides. The fitting procedure was started by fixing the values of Qmax, fA and the binding site size of a protein p6 monomer (n = 12) (21) and setting K and ω as the fitting parameters, and continued by an iteration algorithm designed in our laboratory (43). We also performed a graphical approximation to Keff as described (41). In a plot of the saturation fraction versus [p6]free, assuming that ω >> n, the value of [p6]free corresponding to half saturation yields 1/Kω (39,42).
RESULTS
Protein p6 binds preferentially to Φ29 DNA in vivo
To determine whether p6 binds Φ29 DNA in vivo we used the X-ChIP technique. After treatment with formaldehyde DNA was sonicated and immunoprecipitated with αp6 antibodies. A control immunoprecipitation was performed in parallel with preimmune serum. Selected sequences, 300 bp on average, were amplified and quantified by real-time PCR. Protein p6 binding is expressed as IC, in which the value obtained with preimmune (pi) serum was subtracted from that obtained with αp6 serum and normalized to the total amount of DNA (T) of that region {IC = [(αp6 – pi)/T] × 106}. αp6, pi and T values were calculated by real-time PCR and expressed as pg DNA/ml culture. Therefore, protein p6 binding to different DNA regions of plasmid and viral DNA can be directly compared, since it is not dependent on their amount in the cell nor on their amplification efficiency. Figure 2A indicates the genomic position of the six Φ29 DNA regions analyzed, scattered along the viral chromosome and termed Φ1–Φ6. As illustrated in Figure 2B, these regions comprise not only the amplified sequence (∼300 bp, black), but also ∼450 additional base pairs on each side (gray), as the average size of sonicated DNA was ∼750 bp. Regions Φ1 and Φ6 correspond to the left and right Φ29 DNA ends, respectively, and contain the replication origins; Φ6 also comprises the early promoter C2. Region Φ2 includes the central transcriptional control region, with the early promoters A2b and A2c and the late promoter A3. Regions Φ3, Φ4 and Φ5 correspond to late genes.
Figure 2.

Location of the Φ29 DNA regions analyzed for protein p6 binding. (A) Genetic map of the linear Φ29 DNA (19.3 kb). The positions of the genes, numbered 1–17, are indicated; .5–.9 stands for 16.5–16.9 respectively. The 5′-bound terminal protein is depicted as a black circle. The arrows point in the direction of transcription: the early promoters C2, A2b and A2c transcribe leftwards and the late promoter A3 rightwards. The sequences selected for PCR amplification are shown in black and the regions studied for protein p6 binding, Φ1–Φ6, are shown in gray. (B) Detail of an average region studied for p6 binding. DNA is sheared by sonication to an average size of 750 bp. Each region would then comprise all the overlapping DNA fragments that contain the amplified sequence (black rectangles). According to the average size of the amplified sequences (∼300 bp) and that of the sonicated DNA fragments (∼750 bp), every DNA tract analyzed has ∼1200 bp. This value would be only 750 bp for regions Φ1 and Φ6, as the amplified sequences are located at the ends of the linear DNA.
Figure 3 shows protein p6 binding to the six Φ29 DNA regions, Φ1–Φ6, as well as to a region, termed P1, from plasmid pPR55ow6, a pUB110 derivative (33), in Φ29-infected B.subtilis cells. We measured protein p6 binding at 20 (Fig. 3A) and 35 (Fig. 3B) min post-infection. At 20 min the p6/Φ29 DNA ratio is higher than at 35 min, since, as measured by real-time PCR, DNA replication had just started (M.Alcorlo, personal communication) and the intracellular amount of protein p6 had not still leveled off (16). In contrast, at 35 min the DNA concentration had increased more than that of protein p6 and consequently the IC values were lower. At both times we observed that protein p6 binds to all six Φ29 DNA regions studied, which are scattered and comprise ∼30% of the total Φ29 DNA (see Fig. 2A). The highest p6 binding corresponds to regions Φ1 and Φ6 at both DNA ends, whereas the affinity for the internal regions is lower, especially for region Φ2, which contains the transcription control region. Finally, binding to plasmid DNA is significantly lower than that to any of the Φ29 DNA regions analyzed. This is especially clear at 35 min, when the IC for P1 is 15-fold lower than that for region Φ2, the lowest affinity Φ29 DNA region.
Figure 3.

Protein p6 binding to Φ29 and plasmid DNA. Cells harboring plasmid pPR55ow6 (see Fig. 1) were infected, crosslinked 20 (A) or 35 (B) min later and processed as described in Materials and Methods. Protein p6 binding to Φ29 and plasmid DNA regions (Φ1–Φ6 and P1, respectively) is expressed as the immunoprecipitation coefficient IC (see text).
As an additional control, immunoprecipitation was also performed with antibodies against Φ29 protein p17, another viral early protein that does not bind DNA in vitro and whose intracellular concentration is close to that of protein p6 (44). No protein p17 binding was detected for the Φ29 DNA regions analyzed (not shown), therefore, the possibility that the results are due to random protein–DNA collisions rather than to a genuine interaction can be ruled out.
Protein p6 binding to plasmid DNA is enhanced by decreasing negative supercoiling
In vitro experiments suggested that p6 restrains DNA positive supercoiling (18), therefore we studied the effect of topology on p6 binding to plasmid DNA. For these experiments we used plasmids pPR55 w6/ow6 (see Fig. 1) and the gyrase inhibitors novobiocin, which decreases negative supercoiling, and as a control nalidixic acid, which does not change superhelicity (45). Figure 4 shows the topoisomer distribution of plasmids after novobiocin or nalidixic acid treatment, with the respective medians indicated by arrows. Thus, as expected, under our in vivo conditions negative supercoiling of plasmid DNA is clearly decreased by novobiocin, but essentially unchanged by nalidixic acid.
Figure 4.

Effect of gyrase inhibitors on the linking number of plasmid DNA. Topoisomer distribution of plasmid DNA purified from cells treated with novobiocin or nalidixic acid. Cells harboring plasmid pPR55ow6 were grown up to108 cells/ml and 20 min later 500 µg/ml novobiocin or nalidixic acid were added. Cells were harvested 10 min later and plasmid DNA was purified and treated with topoisomerase I. Topoisomers were resolved by 2-dimensional agarose gel electrophoresis as described in Materials and Methods. The asterisk indicates the position of nicked DNA. The arrows point to the position of the most abundant topoisomer, determined by densitometry with ImageQuant software. Numbers indicate the median of the topoisomer distribution.
Therefore, we studied protein p6 binding to plasmid DNA in the absence or presence of novobiocin or nalidixic acid. Cells hosting plasmid pPR55ow6 were infected with Φ29, grown for an additional 20 min and then crosslinked after addition or not of novobiocin or nalidixic acid. Uninfected cells harboring plasmid pPR55w6, which express protein p6 constitutively, were also crosslinked in the absence or presence of novobiocin and nalidixic acid as described. Protein p6 binding, expressed as IC, was determined by real-time PCR for region P1 of plasmid pPR55ow6 in Φ29-infected cells (P1φ) and for regions P1 and P2 of plasmid pPR55w6 in protein p6-producing cells (P1p and P2p) (see Fig. 1). Figure 5 shows that addition of novobiocin results in a significant increase in protein p6 binding to plasmid DNA in both Φ29-infected and uninfected cells. Binding to region P1 in Φ29-infected cells (P1φ) increased 23-fold (IC = 1645) and for regions P1 and P2 in protein p6-producing uninfected cells (P1p and P2p) the increases were 34- (IC = 4546) and 27-fold (IC = 2780). In contrast, nalidixic acid, which does not change DNA topology, produced only slight changes in protein p6 binding. The higher protein p6 binding to region P1 in p6-producing cells with respect to infected cells could be due to titration of p6 by Φ29 DNA. In summary, these results clearly indicate that protein p6 binding to DNA is dependent on superhelicity.
Figure 5.

Protein p6 binding to plasmid DNA in the absence or presence of novobiocin or nalidixic acid. Cells hosting plasmid pPR55ow6 were infected with Φ29 and 20 min later split into three aliquots. One was crosslinked without further treatment; the other two were treated with either novobiocin or nalidixic acid (500 µg/ml each), together with chloramphenicol (34 µg/ml). Under these conditions chloramphenicol completely prevents expression of p6 (unpublished results). Cells were crosslinked 10 min later. Uninfected cells harboring plasmid pPR55w6, which expresses protein p6 constitutively at levels similar to those in infected cells, were also crosslinked in the absence or presence of novobiocin and nalidixic acid as described. Protein p6 binding, expressed as IC (see text) was measured for region P1 of plasmid pPR55ow6 in Φ29-infected cells (P1φ) and for regions P1 and P2 of plasmid pPR55w6 in protein p6-producing cells (P1p and P2p) (see Fig. 1).
Supercoiling-dependent protein p6 binding to plasmid DNA in vitro
We studied the effect of topology on p6 binding to plasmid DNA in vitro. Protein p6 has a single tryptophan residue at position 46 whose fluorescence is quenched upon DNA binding. Therefore, we measured p6 binding by fluorescence quenching with different topological forms of plasmid pL259, which allows calculation of the respective binding constants of protein p6. We also analyzed the linearized form of the plasmid (L) as a control. Figure 6A shows the native form of the plasmid, designated supercoiled form I (sc I), and the topoisomer distributions of topoisomerase I-treated plasmids, termed sc II, sc III and sc IV.
Figure 6.

Analysis by fluorescence quenching of protein p6 binding in vitro to plasmids with different topology. (A) Topoisomer distribution of the samples used for fluorescence studies. Plasmid pL259 was isolated from E.coli DH5α. The supercoiled form I (sc I), corresponds to the untreated plasmid, whereas sc II and sc III are topoisomerase I-treated plasmid and sc IV topoisomerase I-treated plasmid in the presence of protein p6 to favor the production of positive topoisomers. After purification, ∼1.5 µg was applied to a 1.2% agarose gel and subjected to 2-dimensional gel electrophoresis as described in Materials and Methods. (B) Direct titration of 20 µM plasmid pL259. Fluorescence emission was measured after each addition of protein p6 and plotted against the protein p6 concentration. L, linearized plasmid, sc I–sc IV as above. The final asymptotic lines for the binding curves of linear (dotted) and sc I (dashed) samples are shown and extrapolated to the abscissa. Data are from a single representative experiment performed at least three times. (C). The saturation fraction (θ) is plotted against the free protein p6 concentration, from the data shown in (B). The Keff values were estimated from these curves as the inverse of the [p6]free when 50% of the DNA is bound to protein.
As a previous step, we calculated the maximal quenching value (Qmax) of protein p6 by reverse titration experiments (as described in 39), in which increasing amounts of the linearized plasmid were added to a fixed amount of protein p6, measuring the maximal fluorescence quenching that was reached. We assayed four concentrations of p6, 1, 3, 7 and 12 µM, finding an increase in the apparent Qmax from 0.60 at 1 µM p6 to 0.80 at 3 µM and 0.84 at 7 µM. This value of 0.84 remained constant at 12 µM p6.
To determine the Keff values for the different topological forms of pL259 we performed direct titration experiments in which increasing amounts of protein were added to a fixed amount of DNA (40,41), as described in Materials and Methods. As shown in Figure 6B, in all cases the initial slope of the curves decreased, indicating binding to DNA. The turning point and the slope of the curves during the DNA binding phase indicate different affinities for protein p6, being highest for the linear DNA and lowest for the sc I form. The slopes of the curves of the sc II, sc III and sc IV forms are proportional to their degree of negative supercoiling. When a certain protein concentration is reached, the slope increases parallel to that of the free protein. For the linear DNA sample this is shown in Figure 6B as a dotted line. The point where this line intercepts the abscissa corresponds to a protein concentration [p6] = Qmax [DNA]/n (40). For the [DNA] used, we obtained a value of Qmax/n = 0.072, which gives Qmax = 0.86 for n = 12, very close to that of 0.84 obtained by reverse titration; for Qmax = 0.84, a value of n = 11.7 is obtained, close to that of 12 obtained by footprinting (21). In the corresponding lines for the supercoiled samples, the slope also increases parallel to that of the free protein, but intercepts the abscissa at a lower protein p6 concentration. In Figure 6B we show the slope of sc I as a dashed line for which Qmax/n = 0.038, which would give Qmax = 0.46 for n = 12 or n = 22 for Qmax = 0.84. This significant variation with respect to the values obtained for the linear DNA would indicate that for a topologically restricted DNA, saturation cannot be reached: as every protein p6 molecule that binds restrains positive supercoiling (18) and produces a compensatory negative supercoiling, this would further impair the next molecule binding. Eventually, the superhelical tension would prevent saturation of DNA by protein p6. The amount of protein p6 allowed to bind DNA would be inversely proportional to the degree of negative supercoiling of the sample. The Keff values for p6 binding to the DNA samples were calculated by computer fitting of direct titrations fluorescence data as described in Materials and Methods. They were found to be 6.7 × 10⁵ for sc I, 1.0 × 10⁶ for sc II, 1.4 × 10⁶ for sc III, 1.7 × 10⁶ for sc IV and 2.7 × 10⁶ per M for the linear sample. Here it is not possible to determine K and ω independently due to the inability of supercoiled samples to reach saturation, as explained above.
Figure 6C shows a plot of the saturation fraction (θ) against [p6]free in order to obtain a graphical estimation of Keff values, defined as the reciprocal of [p6]free when 50% of the DNA is bound to protein (41). The Keff values obtained, 7.5 × 10⁵ for sc I, 1.1 × 10⁶ for sc II, 1.3 × 10⁶ for sc III, 1.6 × 10⁶ for sc IV and 2.6 × 10⁶ per M for the linear sample, are nearly identical to those obtained from the fit of direct titration data and together confirm the dependence of p6 binding on the superhelical state of the DNA. Direct titrations were also performed with linearized and supercoiled native pPR55ow6 plasmid, used in the in vivo studies, obtaining analogous results (not shown).
In summary, these data demonstrate that p6 binding is inversely proportional to the degree of negative supercoiling of DNA, in agreement with the observed effect of novobiocin in p6 binding to plasmid DNA in vivo and with the ability of p6 to restrain positive supercoils in vitro (18). This supercoiling-dependent binding most probably constitutes the basis of the p6 specificity for viral DNA observed in vivo, as the non-covalently closed Φ29 DNA is presumably less negatively supercoiled than the bacterial DNA.
DISCUSSION
Proteins involved in organization and compaction of chromosomes have been described in virtually every organism. These architectural proteins share basic features such as abundance, sequence-non-specificity and pleiotropic effects, involved in diverse DNA transactions. In bacteria these proteins are commonly known as ‘histone-like’ (5–6) and a number of them have been co-localized in vivo with the nucleoid (7–9). Using X-ChIP and real-time PCR we here provide direct evidence that protein p6 of B.subtilis bacteriophage Φ29 binds in vivo all along the viral genome in the manner of a histone-like protein. We have studied p6 binding to six regions of Φ29 DNA in vivo, scattered along and comprising ∼30% of the viral genome, demonstrating that protein p6 binds to all of them. This strongly suggests that protein p6 is likely to form nucleoprotein complexes along most, if not all, the viral DNA. However, binding to Φ29 DNA is not the same in all the regions, but highest at the two DNA ends, which could be due to the presence of sequences preferentially binding p6 (46). This high binding is probably related to a requirement for protein p6 in viral DNA replication (47) and for repression of the early promoter C2 (23–25). Interestingly, binding to internal regions Φ3, Φ4 and Φ5, where no role for p6 has ever been described, is higher than to region Φ2, where p6 is involved in the early–late transcriptional switch (26–28). In summary, p6 binding along Φ29 DNA strongly supports an architectural role, in agreement with other p6 features, such as its abundance, lack of sequence specificity and effects in replication and transcription, which could be envisaged as local outcomes of a more global role as a histone-like protein.
We also show that protein p6 binds with high preference to viral with respect to plasmid DNA and that it is superhelicity which provides this specificity, as the level of negative supercoiling of bacterial (plasmid and chromosomal) DNA is presumably lower than that of non-covalently closed Φ29 DNA. In vivo, we have shown that when the negative superhelicity of the plasmid is decreased by novobiocin, protein p6 binding is significantly increased in infected and uninfected cells; on the other hand, binding was essentially unchanged with nalidixic acid, which inhibits gyrase but does not alter the topological state of the plasmid. We have confirmed these results in vitro by fluorescence quenching of protein p6 with plasmids of different degrees of supercoiling, the highest affinity corresponding to the linearized, topologically unconstrained form. Therefore, protein p6 binding increases when negative supercoiling is lowered, strongly suggesting that, as shown in vitro (18), protein p6 restrains positive supercoiling in vivo. Supercoiling-dependent DNA binding is a smart strategy to prevent titration of a sequence-non-specific protein such as p6 by bacterial DNA, with a much higher mass than that of viral DNA.
In conclusion, we report the first in vivo direct evidence of a bacteriophage DNA architectural protein. We have demonstrated that: (i) phage Φ29 protein p6 binds all along the Φ29 DNA; (ii) this binding is specific to viral DNA; (iii) p6 binding depends on DNA superhelicity so that the specificity could be based on a lower negative superhelicity of viral DNA. Together with all the previous evidence in vitro, we conclude that protein p6 globally organizes and compacts the viral genome, with local effects on replication and transcription.
Acknowledgments
ACKNOWLEDGEMENTS
We are indebted to Dr M.García-Mateu for support with the fluorescence experiments. We are grateful to Dr A. Bravo for providing B.subtilis strain 110NA pPR55 w6/ow6 and to L.Villar for purified Φ29 DNA. This work was supported by research grants 2R01 GM27242-24 from the National Institutes of Health, BMC2002-03818 from Ministerio de Ciencia y Tecnología and by an Institutional grant from the Fundación Ramón Areces to the Centro de Biología Molecular ‘Severo Ochoa’. V.G.-H. is the recipient of a postdoctoral fellowship of Comunidad Autónoma de Madrid.
REFERENCES
- 1.Jenuwein T. and Allis,C.D. (2001) Translating the histone code. Science, 293, 1074–1080. [DOI] [PubMed] [Google Scholar]
- 2.Thomas J.O. and Travers,A.A. (2001) HMG1 and 2 and related architectural DNA-binding proteins. Trends Biochem. Sci., 26, 167–174. [DOI] [PubMed] [Google Scholar]
- 3.Hirano T. (1999) SMC-mediated chromosome mechanics: a conserved scheme from bacteria to vertebrates? Genes Dev., 13, 11–19. [DOI] [PubMed] [Google Scholar]
- 4.Holmes V.F. and Cozzarelli,N.R. (2000) Closing the ring: links between SMC proteins and chromosome partitioning, condensation and supercoiling. Proc. Natl Acad. Sci. USA, 97, 1322–1324. [DOI] [PMC free article] [PubMed] [Google Scholar]
- 5.Drlica K. and Rouvière-Yaniv,J. (1987) Histonelike proteins of bacteria. Microbiol. Rev., 51, 301–319. [DOI] [PMC free article] [PubMed] [Google Scholar]
- 6.Hayat M.A. and Mancarella,D.A. (1995) Nucleoid proteins. Micron, 26, 461–480. [DOI] [PubMed] [Google Scholar]
- 7.Kohler P. and Marahiel,M.A. (1997) Association of the histone-like protein HBsu with the nucleoid of Bacillus subtilis. J. Bacteriol., 179, 2060–2064. [DOI] [PMC free article] [PubMed] [Google Scholar]
- 8.Azam T.A., Hiraga,S. and Ishihama,A. (2000) Two types of localization of the DNA-binding proteins within the Escherichia coli nucleoid. Genes Cells, 5, 613–626. [DOI] [PubMed] [Google Scholar]
- 9.Lindow J.C., Kuwano,M., Moriya,S. and Grossman,A.D. (2002) Subcellular localization of the Bacillus subtilis structural maintenance of chromosomes (SMC) protein. Mol. Microbiol., 46, 997–1009. [DOI] [PubMed] [Google Scholar]
- 10.Azam T.A., Iwata,A., Nishimura,A., Ueda,S. and Ishihama,A. (1999) Growth phase-dependent variation in protein composition of the Escherichia coli nucleoid. J. Bacteriol., 181, 6361–6370. [DOI] [PMC free article] [PubMed] [Google Scholar]
- 11.Exley R., Zouine,M., Pernelle,J.J., Beloin,C., Le Hegarat,F. and Deneubourg,A.M. (2001) A possible role for L24 of Bacillus subtilis in nucleoid organization and segregation. Biochimie, 83, 269–275. [DOI] [PubMed] [Google Scholar]
- 12.Beloin C., Exley,R., Mahe,A.L., Zouine,M., Cubasch,S. and Le Hegarat,F. (2000) Characterization of LrpC DNA-binding properties and regulation of Bacillus subtilis lrpC gene expression. J. Bacteriol., 182, 4414–4424. [DOI] [PMC free article] [PubMed] [Google Scholar]
- 13.Tapias A., López,G. and Ayora,S. (2000) Bacillus subtilis LrpC is a sequence-independent DNA-binding and DNA-bending protein which bridges DNA. Nucleic Acids Res., 28, 552–559. [DOI] [PMC free article] [PubMed] [Google Scholar]
- 14.Graumann P.L. (2001) SMC proteins in bacteria: condensation motors for chromosome segregation? Biochimie, 83, 53–59. [DOI] [PubMed] [Google Scholar]
- 15.Murray C.L. and Rabinowitz,J.C. (1982) Nucleotide sequence of transcription and translation initiation regions in Bacillus phage Φ29 early genes. J. Biol. Chem., 257, 1053–1062. [PubMed] [Google Scholar]
- 16.Abril A.M., Salas,M., Andreu,J.M., Hermoso,J.M. and Rivas,G. (1997) Phage Φ29 protein p6 is in a monomer–dimer equilibrium that shifts to higher association states at the millimolar concentrations found in vivo. Biochemistry, 36, 11901–11908. [DOI] [PubMed] [Google Scholar]
- 17.Ross M.A. and Setlow,P. (2000) The Bacillus subtilis HBsu protein modifies the effects of alpha/beta-type, small acid-soluble spore proteins on DNA. J. Bacteriol., 182, 1942–1948. [DOI] [PMC free article] [PubMed] [Google Scholar]
- 18.Serrano M., Gutiérrez,C., Salas,M. and Hermoso,J.M. (1993) Superhelical path of the DNA in the nucleoprotein complex that activates the initiation of phage Φ29 DNA replication. J. Mol. Biol., 230, 248–259. [DOI] [PubMed] [Google Scholar]
- 19.Gutiérrez C., Freire,R., Salas,M. and Hermoso,J.M. (1994) Assembly of phage Φ29 genome with viral protein p6 into a compact complex. EMBO J., 13, 269–276. [DOI] [PMC free article] [PubMed] [Google Scholar]
- 20.Kimura K., Rybenkov,V.V., Crisona,N.J., Hirano,T. and Cozzarelli,N.R. (1999) 13S condensin actively reconfigures DNA by introducing global positive writhe: implications for chromosome condensation. Cell, 98, 239–248. [DOI] [PubMed] [Google Scholar]
- 21.Serrano M., Salas,M. and Hermoso,J.M. (1990) A novel nucleoprotein complex at a replication origin. Science, 248, 1012–1016. [DOI] [PubMed] [Google Scholar]
- 22.Pastrana R., Lázaro,J.M., Blanco,L., García,J.A., Méndez,E. and Salas,M. (1985) Overproduction and purification of protein p6 of Bacillus subtilis phage Φ29: role in the initiation of DNA replication. Nucleic Acids Res., 13, 3083–3100. [DOI] [PMC free article] [PubMed] [Google Scholar]
- 23.Whiteley H.R., Ramey,W.D., Spiegelman,G.B. and Holder,R.D. (1986) Modulation of in vivo and in vitro transcription of bacteriophage Φ29 early genes. Virology, 155, 392–401. [DOI] [PubMed] [Google Scholar]
- 24.Barthelemy I., Mellado,R.P. and Salas,M. (1989) In vitro transcription of bacteriophage Φ29 DNA: inhibition of early promoters by the viral replication protein p6. J. Virol., 63, 460–462. [DOI] [PMC free article] [PubMed] [Google Scholar]
- 25.Camacho A. and Salas,M. (2001) Repression of bacteriophage Φ29 early promoter C2 by viral protein p6 is due to impairment of closed complex. J. Biol. Chem., 276, 28927–28932. [DOI] [PubMed] [Google Scholar]
- 26.Elias-Arnanz M. and Salas,M. (1999) Functional interactions between a phage histone-like protein and a transcriptional factor in regulation of Φ29 early-late transcriptional switch. Genes Dev., 13, 2502–2513. [DOI] [PMC free article] [PubMed] [Google Scholar]
- 27.Camacho A. and Salas,M. (2001) Mechanism for the switch of Φ29 DNA early to late transcription by regulatory protein p4 and histone-like protein p6. EMBO J., 20, 6060–6070. [DOI] [PMC free article] [PubMed] [Google Scholar]
- 28.Calles B., Salas,M. and Rojo,F. (2002) The Φ29 transcriptional regulator contacts the nucleoid protein p6 to organize a repression complex. EMBO J., 21, 6185–6194. [DOI] [PMC free article] [PubMed] [Google Scholar]
- 29.Orlando V., Strutt,H. and Paro,R. (1997) Analysis of chromatin structure by in vivo formaldehyde cross-linking. Methods, 11, 205–214. [DOI] [PubMed] [Google Scholar]
- 30.Hecht A. and Grunstein,M. (1999) Mapping DNA interaction sites of chromosomal proteins using immunoprecipitation and polymerase chain reaction. Methods Enzymol., 304, 399–414. [DOI] [PubMed] [Google Scholar]
- 31.Orlando V. (2000) Mapping chromosomal proteins in vivo by formaldehyde-crosslinked-chromatin immunoprecipitation. Trends Biochem. Sci., 25, 99–104. [DOI] [PubMed] [Google Scholar]
- 32.Moreno F., Camacho,A., Viñuela,E. and Salas,M. (1974) Supressor-sensitive mutants and genetic map of Bacillus subtilis bacteriophage Φ29. Virology, 62, 1–16. [DOI] [PubMed] [Google Scholar]
- 33.Bravo A., Hermoso,J.M. and Salas,M. (1994) A genetic approach to the identification of functional amino acids in protein p6 of Bacillus subtilis phage Φ29. Mol. Gen. Genet., 245, 529–536. [DOI] [PubMed] [Google Scholar]
- 34.Jiménez F., Camacho,A., De La Torre,J., Viñuela,E. and Salas,M. (1977) Assembly of Bacillus subtilis phage Φ29. 2. Mutants in the cistrons coding for the non-structural proteins. Eur. J. Biochem., 73, 57–72. [DOI] [PubMed] [Google Scholar]
- 35.González-Huici V., Salas,M. and Hermoso,J.M. (2000) Sequence requirements for protein-primed initiation and elongation of phage Φ29 DNA replication. J. Biol. Chem., 275, 40547–40553. [DOI] [PubMed] [Google Scholar]
- 36.Inciarte M.R., Lázaro,J.M., Salas,M. and Viñuela,E. (1976) Physical map of bacteriophage Φ29 DNA. Virology, 74, 314–323. [PubMed] [Google Scholar]
- 37.González-Huici V., Salas,M. and Hermoso,J.M. (2004) The push-pull mechanism of bacteriophage Φ29 DNA injection. Mol. Microbiol., 52, 529–540. [DOI] [PubMed] [Google Scholar]
- 38.Kolb A. and Buc,H. (1982) Is DNA unwound by the cyclic AMP receptor protein? Nucleic Acids Res., 10, 473–485. [DOI] [PMC free article] [PubMed] [Google Scholar]
- 39.Kowalczykowski S.C., Paul,L.S., Lonberg,N., Newport,J.W., McSwiggen,J.A. and von Hippel,P.H. (1986) Cooperative and noncooperative binding of protein ligands to nucleic acid lattices: experimental approaches to the determination of thermodynamic parameters. Biochemistry, 25, 1226–1240. [DOI] [PubMed] [Google Scholar]
- 40.Alma N.C., Harmsen,B.J., de Jong,E.A., Ven,J. and Hilbers,C.W. (1983) Fluorescence studies of the complex formation between the gene 5 protein of bacteriophage M13 and polynucleotides. J. Mol. Biol., 163, 47–62. [DOI] [PubMed] [Google Scholar]
- 41.Schwarz G. and Watanabe,F. (1983) Thermodynamics and kinetics of co-operative protein–nucleic acid binding. I. General aspects of analysis of data. J. Mol. Biol., 163, 467–484. [DOI] [PubMed] [Google Scholar]
- 42.McGhee J.D. and von Hippel,P.H. (1974) Theoretical aspects of DNA–protein interactions: co-operative and non-co-operative binding of large ligands to a one-dimensional homogeneous lattice. J. Mol. Biol., 86, 469–489. [DOI] [PubMed] [Google Scholar]
- 43.Soengas M.S., Esteban,J.A., Salas,M. and Gutiérrez,C. (1994) Complex formation between phage Φ29 single-stranded DNA binding protein and DNA. J. Mol. Biol., 239, 213–226. [DOI] [PubMed] [Google Scholar]
- 44.Crucitti P., Lázaro,J.M., Benes,V. and Salas,M. (1998) Bacteriophage Φ29 early protein p17 is conditionally required for the first rounds of viral DNA replication. Gene, 223, 135–142. [DOI] [PubMed] [Google Scholar]
- 45.Osburne M.S., Zavodny,S.M. and Peterson,G.A. (1988) Drug-induced relaxation of supercoiled plasmid DNA in Bacillus subtilis and induction of the SOS response. J. Bacteriol., 170, 442–445. [DOI] [PMC free article] [PubMed] [Google Scholar]
- 46.Serrano M., Gutiérrez,J., Prieto,I., Hermoso,J.M. and Salas,M. (1989) Signals at the bacteriophage Φ29 DNA replication origins required for protein p6 binding and activity. EMBO J., 8, 1879–1885. [DOI] [PMC free article] [PubMed] [Google Scholar]
- 47.Carrascosa J.L., Camacho,A., Moreno,F., Jiménez,F., Mellado,R.P., Viñuela,E. and Salas,M. (1976) Bacillus subtilis phage Φ29; characterization of gene products and functions. Eur. J. Biochem., 66, 229–241. [DOI] [PubMed] [Google Scholar]