Abstract
In 1997 health spending in the United States increased just 4.8 percent to $1.1 trillion. As a share of gross domestic product (GDP), national health expenditures (NHE) absorbed 13.5 percent of the country's output in 1997—a share that has remained relatively constant for 5 years. Despite the relative stability in recent years, signs of changing trends are emerging.
Introduction
Since 1964 the U.S. Department of Health and Human Services has published statistics presenting total health spending during each year. The basic aim of these statistics, termed NHE, is to “identify all goods and services that can be characterized as relating to health care in the nation, and determine the amount of money used for the purchase of these goods and services…” (Rice, Cooper, and Gibson, 1982).
In this article, we present NHE through an accounting structure to describe historical trends in the size, growth, and distribution of health care by type of service, such as hospital care and physician services, matched against the sources that pay the health care bill, such as private health insurance (PHI) and government programs like Medicare and Medicaid. This matrix provides policymakers, researchers, and the public with a system for understanding movement of the aggregate health economy and can serve as a data base from which hypotheses about the causal factors at work can be generated.
In the charts that follow, we present detailed information on our Nation's health spending, focusing on calendar year (CY) 1997. The charts are organized into three primary areas: an aggregate overview, the major sources of private and public funding, and the key service areas where our Nation's health dollars were spent. Included in the overview are estimates of total aggregate health spending, health expenditures as a share of GDP, the distribution of health spending by primary funding sources and services, and the basic economic factors accounting for the growth in health spending. The overview is followed by more detailed statistics on each of the primary funding sources including PHI, Medicare, Medicaid, and individual consumer health spending, as well as each of the primary service areas, including hospitals, physicians, prescription drugs, nursing homes, and home health services.
Tables 4-13 following the charts provide detailed NHE information for selected CYs by type of service and funding source. More complete time series estimates can be found online at http://www.hcfa.gov.
Table 4. National Health Expenditures Aggregate and per Capita Amounts, Percent Distribution, and Average Annual Percent Growth, by Source of Funds: Selected Calendar Years 1980-97.
| Item | 1980 | 1985 | 1990 | 1991 | 1992 | 1993 | 1994 | 1995 | 1996 | 1997 |
|---|---|---|---|---|---|---|---|---|---|---|
| Amount in Billions | ||||||||||
| National Health Expenditures | $247.3 | $428.7 | $699.4 | $766.8 | $836.5 | $898.5 | $947.7 | $993.7 | $1,042.5 | $1,092.4 |
| Private | 142.5 | 254.5 | 416.2 | 448.9 | 483.6 | 513.2 | 524.9 | 538.5 | 561.1 | 585.3 |
| Public | 104.8 | 174.2 | 283.2 | 317.9 | 353.0 | 385.3 | 422.8 | 455.2 | 481.4 | 507.1 |
| Federal | 72.0 | 123.2 | 195.2 | 222.5 | 251.8 | 275.4 | 301.2 | 326.0 | 348.0 | 367.0 |
| State and Local | 32.8 | 51.0 | 88.0 | 95.4 | 101.2 | 110.0 | 121.6 | 129.2 | 133.4 | 140.0 |
| Number in Millions | ||||||||||
| U.S. Population1 | 235 | 247 | 260 | 263 | 265 | 268 | 271 | 273 | 276 | 278 |
| Amount in Billions | ||||||||||
| Gross Domestic Product | $2,784 | $4,181 | $5,744 | $5,917 | $6,244 | $6,558 | $6,947 | $7,270 | $7,662 | $8,111 |
| Per Capita Amount | ||||||||||
| National Health Expenditures | $1,052 | $1,735 | $2,690 | $2,918 | $3,151 | $3,350 | $3,500 | $3,637 | $3,781 | $3,925 |
| Private | 606 | 1,030 | 1,601 | 1,708 | 1,821 | 1,913 | 1,938 | 19,701 | 2,035 | 2,103 |
| Public | 446 | 705 | 1,089 | 1,210 | 1,330 | 1,437 | 1,561 | 1,666 | 1,746 | 1,822 |
| Federal | 306 | 498 | 751 | 847 | 948 | 1,027 | 1,112 | 1,193 | 1,262 | 1,319 |
| State and Local | 140 | 206 | 338 | 363 | 381 | 410 | 449 | 473 | 484 | 503 |
| Percent Distribution | ||||||||||
| National Health Expenditures | 100.0 | 100.0 | 100.0 | 100.0 | 100.0 | 100.0 | 100.0 | 100.0 | 100.0 | 100.0 |
| Private | 57.6 | 59.4 | 59.5 | 58.5 | 57.8 | 57.1 | 55.4 | 54.2 | 53.8 | 53.6 |
| Public | 42.4 | 40.6 | 40.5 | 41.5 | 42.2 | 42.9 | 44.6 | 45.8 | 46.2 | 46.4 |
| Federal | 29.1 | 28.7 | 27.9 | 29.0 | 30.1 | 30.6 | 31.8 | 32.8 | 33.4 | 33.6 |
| State and Local | 13.3 | 11.9 | 12.6 | 12.4 | 12.1 | 12.2 | 12.8 | 13.0 | 12.8 | 12.8 |
| Percent of Gross Domestic Product | ||||||||||
| National Health Expenditures | 8.9 | 10.3 | 12.2 | 13.0 | 13.4 | 13.7 | 13.6 | 13.7 | 13.6 | 13.5 |
| Average Annual Percent Growth from Previous Year Shown | ||||||||||
| National Health Expenditures | 211.7 | 11.6 | 10.3 | 9.6 | 9.1 | 7.4 | 5.5 | 4.9 | 4.9 | 4.8 |
| Private | 210.3 | 12.3 | 10.3 | 7.9 | 7.7 | 6.1 | 2.3 | 2.6 | 4.2 | 4.3 |
| Public | 214.8 | 10.7 | 10.2 | 12.3 | 11.0 | 9.2 | 9.7 | 7.7 | 5.7 | 5.3 |
| Federal | 217.4 | 11.3 | 9.6 | 14.0 | 13.1 | 9.4 | 9.4 | 8.2 | 6.8 | 5.5 |
| State and Local | 211.5 | 9.2 | 11.5 | 8.4 | 6.1 | 8.6 | 10.6 | 6.2 | 3.2 | 5.0 |
| U.S. Population | 21.1 | 1.0 | 1.0 | 1.0 | 1.0 | 1.0 | 1.0 | 0.9 | 0.9 | 0.9 |
| Gross Domestic Product | 28.7 | 8.5 | 6.6 | 3.0 | 5.5 | 5.0 | 5.9 | 4.6 | 5.4 | 5.9 |
July 1 Social Security area population estimates for each year, 1980-97.
Average annual growth between 1960 and 1980.
NOTE: Numbers and percents may not add to totals because of rounding.
SOURCE: Health Care Financing Administration, Office of the Actuary, National Health Statistics Group.
Table 13. Expenditures for Health Services and Supplies Under Public Programs, by Type of Expenditure and Program: Calendar Year 1997.
| Program Area | All Expenditures | Personal Health Care | Administration | Public Health Activities | |||||||||
|---|---|---|---|---|---|---|---|---|---|---|---|---|---|
|
| |||||||||||||
| Total | Hospital Care | Physician Services | Dental Services | Other Professional Services | Home Health Care | Drugs and Other Medical Non-Durables | Vision Products and Other Medical Durables | Nursing Home Care | Other | ||||
|
| |||||||||||||
| Amount in Billions | |||||||||||||
| Public and Private Spending | $1,057.5 | $969.0 | $371.1 | $217.6 | $50.6 | $61.9 | $32.3 | $108.9 | $13.9 | $82.8 | $29.9 | $50.0 | $38.5 |
| All Public Programs | 485.5 | 432.4 | 228.4 | 70.1 | 2.3 | 13.6 | 17.7 | 16.0 | 6.6 | 51.4 | 26.3 | 14.7 | 38.5 |
| Federal Funds | 351.8 | 337.3 | 185.6 | 58.4 | 1.3 | 10.8 | 15.4 | 9.2 | 6.4 | 34.5 | 15.6 | 10.4 | 4.1 |
| State and Local Funds | 133.8 | 95.1 | 42.8 | 11.7 | 1.0 | 2.8 | 2.3 | 6.8 | 0.1 | 16.9 | 10.7 | 4.3 | 34.4 |
| Medicare | 214.6 | 208.9 | 123.7 | 46.4 | 0.1 | 8.8 | 12.8 | 1.0 | 6.0 | 10.1 | — | 5.7 | — |
| Medicaid1 | 159.9 | 152.3 | 57.6 | 15.7 | 2.0 | 1.7 | 4.8 | 13.2 | — | 39.4 | 17.9 | 7.6 | — |
| Federal | 95.4 | 91.1 | 36.2 | 9.3 | 1.1 | 1.0 | 2.6 | 7.8 | — | 22.6 | 10.4 | 4.3 | — |
| State and Local | 64.5 | 61.2 | 21.4 | 6.4 | 0.9 | 0.7 | 2.1 | 5.5 | — | 16.8 | 7.5 | 3.3 | — |
| Other State and Local Public Assistance Programs | 5.4 | 5.4 | 2.9 | 0.3 | 0.1 | 0.4 | 0.1 | 1.1 | 0.0 | 0.1 | 0.3 | — | — |
| Department of Veterans Affairs | 16.6 | 16.6 | 13.6 | 0.2 | 0.0 | — | — | 0.0 | 0.3 | 1.7 | 0.7 | 0.1 | — |
| Department of Defense2 | 13.4 | 13.3 | 10.0 | 1.7 | 0.0 | — | — | 0.4 | — | — | 1.2 | 0.2 | — |
| Workers' Compensation | 14.1 | 13.2 | 6.4 | 4.9 | — | 1.6 | — | 0.3 | 0.1 | — | — | 0.9 | — |
| Federal | 0.5 | 0.5 | 0.3 | 0.1 | — | 0.1 | — | 0.0 | 0.0 | — | — | 0.0 | — |
| State and Local | 13.6 | 12.7 | 6.1 | 4.8 | — | 1.5 | — | 0.3 | 0.1 | — | — | 0.9 | — |
| State and Local Hospitals3 | 12.0 | 12.0 | 12.0 | — | — | — | — | — | — | — | — | — | — |
| Other Public Programs for Personal Health Care4 | 11.1 | 10.8 | 2.2 | 0.9 | 0.1 | 1.2 | — | 0.0 | 0.1 | — | 6.2 | 0.3 | — |
| Federal | 7.0 | 6.9 | 1.8 | 0.7 | 0.1 | 1.0 | — | 0.0 | 0.1 | — | 3.2 | 0.1 | — |
| State and Local | 4.0 | 3.8 | 0.4 | 0.2 | 0.0 | 0.2 | — | 0.0 | 0.1 | — | 3.0 | 0.2 | — |
| Government Public Health Activities | 38.5 | — | — | — | — | — | — | — | — | — | — | — | 38.5 |
| Federal | 4.1 | — | — | — | — | — | — | — | — | — | — | — | 4.1 |
| State and Local | 34.4 | — | — | — | — | — | — | — | — | — | — | — | 34.4 |
| Medicare and Medicaid | 374.5 | 361.2 | 181.3 | 62.1 | 2.1 | 10.4 | 17.5 | 14.2 | 6.0 | 49.6 | 17.9 | 13.3 | — |
Excludes funds paid into the Medicare trust funds by States under buy-in agreements to cover premiums for Medicaid recipients.
Includes care for retirees and military dependents.
Expenditures not offset by revenues.
Includes program spending for maternal and child health; vocational rehabilitation medical payments; temporary disability insurance medical payments; Public Health Service and other Federal hospitals; Indian health services; alcoholism, drug abuse, and mental health; and school health.
NOTES: The figure 0.0 denotes amounts less than $50 million. Numbers may not add to total because of rounding.
SOURCE: Health Care Financing Administration, Office of the Actuary, National Health Statistics Group.
Conclusion
Over the past several years, health care expenditures have shown remarkable moderation in growth. Continued excess capacity in hospitals, efforts by employers to hold down cost increases, and the downward impact of BBA on Medicare costs over the next 5 years should moderate future health care expenditure growth.
However, beneath the recent calm waters are potential pressures for increased spending. Private insurers are seeing growth in benefit payments that exceed premiums earned and increasing demands by stockholders to improve eroding operating margins. Calls for increased quality and choice continue to be debated in State legislatures and in Congress, with the potential for accelerating the growth in benefit costs if enacted. At the same time, consolidation in the insurer and provider marketplaces could dampen the intense competitive pressures that have helped to keep the lid on premium price increases in recent years.
Additional pressures will likely come in the form of increased consumer demand (Smith et al., 1998). Recent strong economic growth has boosted employment and wages while prompting employers to offer health insurance to attract a qualified workforce. With rising incomes, the demand for new technologies and treatments will likely increase, including a continued upward trend in the fastest growing NHE category, prescription drugs. Although few expect a return to the double-digit growth of the past, significant forces for accelerated growth in future aggregate health spending are emerging.
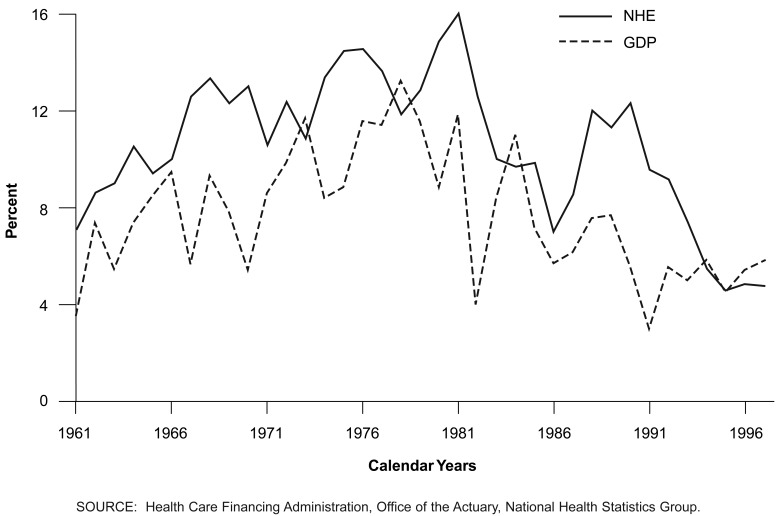
Figure 1. Growth in National Health Expenditures (NHE) and Gross Domestic Product (GDP): Calendar Years 1961-97.
1997 NHE show slowest growth ever recorded in the series.
- NHE reached $1.1 trillion in 1997. The 4.8-percent increase in 1997 marks the slowest growth in NHE history and continues a trend of deceleration that began in 1991. Over the past 3 years, growth has remained below 5 percent, in sharp contrast to the double-digit growth last seen in 1990. This decelerating growth trend has been fueled by changes in the health care industry, including the shift of employees in employer-sponsored health plans from indemnity plans to lower-average-cost managed care plans, price competition among health plans, and low general and medical inflation.
- On a per person basis, health spending rose $144, from $3,781 per person in 1996 to $3,925 in 1997.
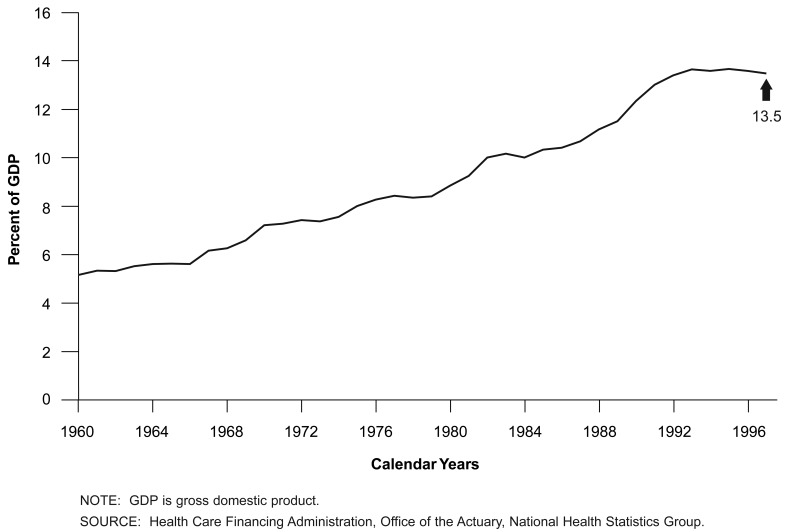
Figure 2. National Health Expenditures as a Share of GDP: Calendar Years 1960-97.
NHE as a share of GDP stabilized in the 1993-97 period.
- From 1993 to 1997, health spending and GDP grew at similar rates, leading to a trend of relative stability in the NHE share of GDP. Since 1993 NHE as a share of GDP has fluctuated between 13.6 and 13.7 percent, with 1997 showing a slight decrease in share at 13.5 percent. The slowdown in health spending coupled with a strong economy has led to this period of stability, marking a trend much different from the one seen between the 1960s and early 1990s, when NHE as a share of GDP increased almost every year.
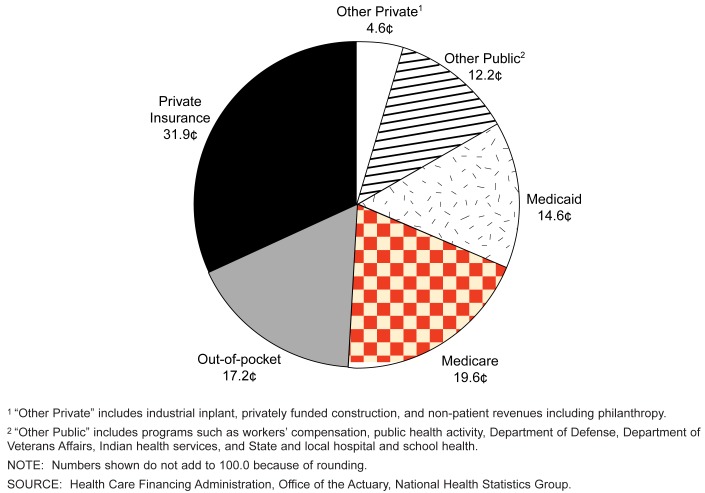
Figure 3. The Nation's Health Dollar, Calendar Year 1997: Where It Came From.
Private and public sources each funded about one-half of the health care bill in 1997.
- Private funding represented 53.6 percent of health care ($585.3 billion) in 1997, down from 59.5 percent in 1990, while public funding represented 46.4 percent ($507.1 billion), up from 40.5 percent in 1990.
- Although growth in spending by public sources of funds exceeded growth in private sources of funds in 1997 (5.3 versus 4.3 percent, respectively), the differential is less pronounced than in recent years. The slowdown in public spending growth may indicate that policy and administrative changes affecting Medicare and Medicaid have been successful in helping to control public spending. Private spending continued to show slow growth, partly as a result of price competition among health care plans trying to maintain or increase market share.
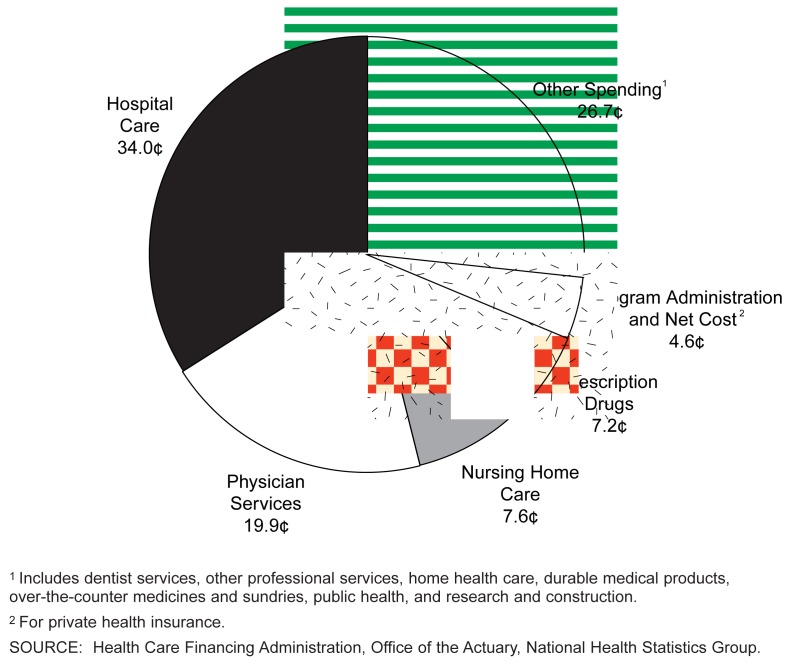
Figure 4. The Nation's Health Dollar, Calendar Year 1997: Where It Went.
Hospital and physician expenditures represented just over one-half of all health spending.
- Hospital and physician spending accounted for 54 percent of total U.S. health expenditures in 1997. Since 1991 the shares of spending for hospitals and physicians have slowly declined. Efforts by the public sector to reduce payments to providers, coupled with the PHI focus on cost control, helped to slow the growth of these two services. Shares for other professionals, home health, and non-durable medical products have increased.
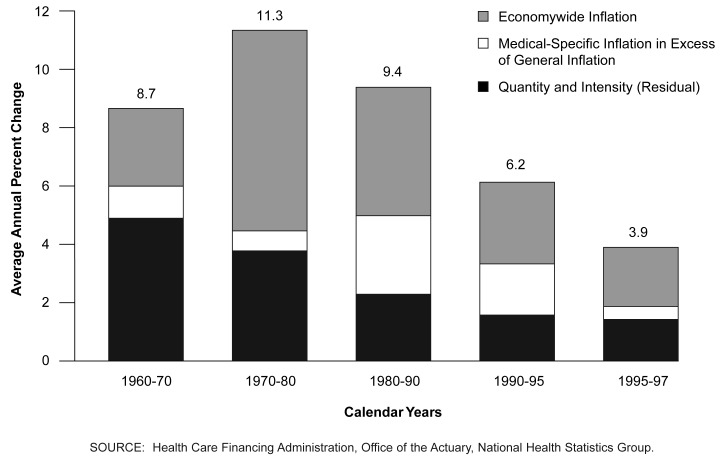
Figure 5. Factors Accounting for Growth in Per Capita Personal Health Care Expenditures: Selected Periods 1960-97.
Since 1990 medical-specific inflation has decreased dramatically.
- On a per capita basis, nominal spending for personal health care grew at a 3.9-percent average annual rate between 1995 and 1997. Of the 3.9 percent, economywide inflation accounted for 2.2 percent; net medical-specific price inflation (in excess of general price inflation) accounted for just 0.4 percent; and the quantity and intensity of personal health care per person represented 1.4 percent. Quantity and intensity of services is a residual amount reflecting changes in quantities of services delivered, age/sex composition of the population, technological improvements, and any measurement errors in expenditures, inflation, or population.
- Between 1970 and 1980, economywide inflation was the driving force behind high per capita health spending increases, which grew 11.3 percent on an average annual basis during the period. Between 1980 and 1990, per capita health spending grew at a 9.4-percent average annual rate. During this period, price inflation was again the major force, but net medical-specific inflation played a much larger role. However, since 1990 net medical-specific inflation has decreased significantly, partly as a result of successful efforts by many insurers to negotiate discounts with providers.
Figure 6. Annual Percent Change in Medicaid Total Spending: Calendar Years 1968-97.
SOURCES OF FUNDING
Medicaid registered record low spending growth in 1997.
- Total Medicaid spending was $159.9 billion in 1997, an increase of just 3.8 percent over the 1996 level. This rate of increase represented the slowest growth in Medicaid spending since the inception of the program. Medicaid average annual spending growth decelerated from the late 1980s to the current period: from 19.5 percent for 1988-91 and 12.7 percent for 1991-94 to 5.9 percent in 1994-97.
-
The rapid growth from 1988 to 1994 was attributable to three basic factors (U.S. General Accounting Office, 1997):
- An increase in the number of Medicaid enrollees.
- An increase in nominal spending per recipient.
- Explosive growth in the disproportionate-share hospital (DSH) payments.
-
The slowdown in total Medicaid spending from 1994 to 1997 is attributable to:
- Downward pressure on each of the factors previously mentioned (Holahan and Liska, 1997).
- The effects of the 1996 Welfare Reform legislation.
- Favorable general economic conditions, including both income growth (which reduces the number of low-income individuals and families) and low health cost inflation generally.
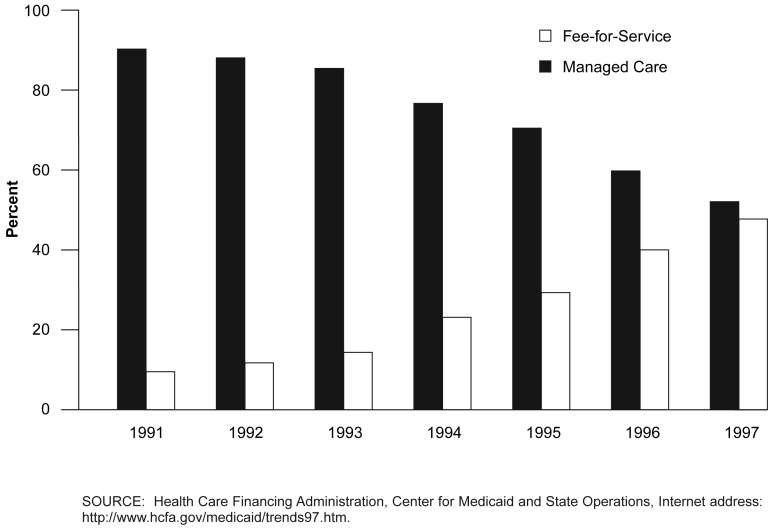
Figure 7. Distribution of Medicaid Enrollment: 1991-97.
Medicaid managed care enrollment has increased substantially since 1991.
- After experiencing large spikes in Medicaid spending in the 1988-91 period, States sought relief (as did employers) from skyrocketing costs by increasing enrollment in managed care. In Federal fiscal year (FY) 1991, managed care accounted for 9.5 percent of total Medicaid enrollment. By Federal FY 1997, nearly one-half (47.8 percent) of the Medicaid population was covered by some form of managed care.
- The Balanced Budget Act (BBA) of 1997 (Public Law 105-33) contained a number of provisions affecting Medicaid managed care plans. Under the BBA, States will be able to implement mandatory managed care programs without obtaining section 1915(b) or section 1115 waivers. States may also require most Medicaid recipients to enroll in managed care organizations (MCOs). Additionally, the MCOs are no longer required to enroll non-Medicaid members for 25 percent of total enrollment (Schneider, 1998). Most provisions of the BBA became effective in Federal FY 1998 and as such have had little effect on the 1997 figures.
- To date, however, most of the enrollment in Medicaid MCOs has been from comparatively low-cost groups (e.g., mothers and children) and relatively little from higher cost categories (the aged and disabled). Thus, the impact of increased MCO enrollment on Medicaid cost growth has been more modest than the nearly 50-50 enrollment distribution might suggest.
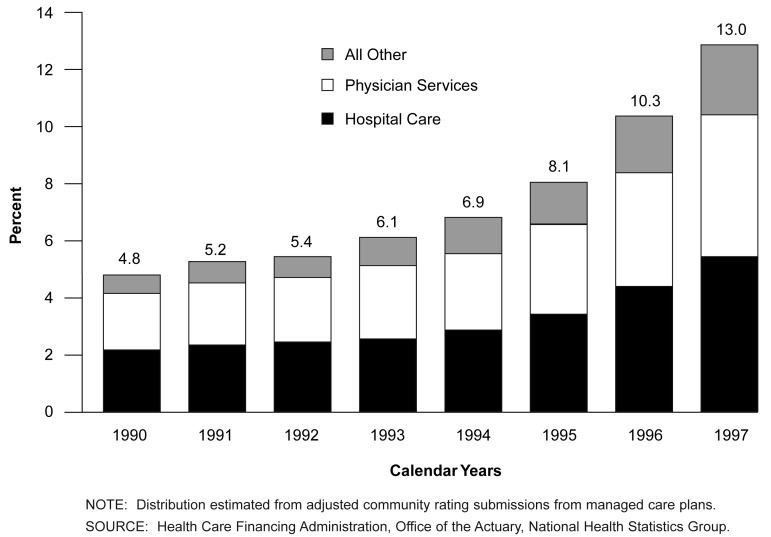
Figure 8. Capitated Payment Share of Total Medicare Expenditures and Service Distribution of Capitated Payments: Calendar Years 1990-97.
Managed care payments represented an ever-larger share of Medicare spending.
- In 1997 capitation payments continued to increase as a share of total Medicare payments, rising from 10.3 percent in 1996 to 13.0 percent in 1997. The shift from FFS to capitated payments has altered the service distribution of total Medicare spending. Under FFS payments, hospital care (combined inpatient and outpatient) and physician services account for 60- and 20-percent shares, respectively. Under capitated payments, hospital care and physician services each account for approximately 40-percent shares.
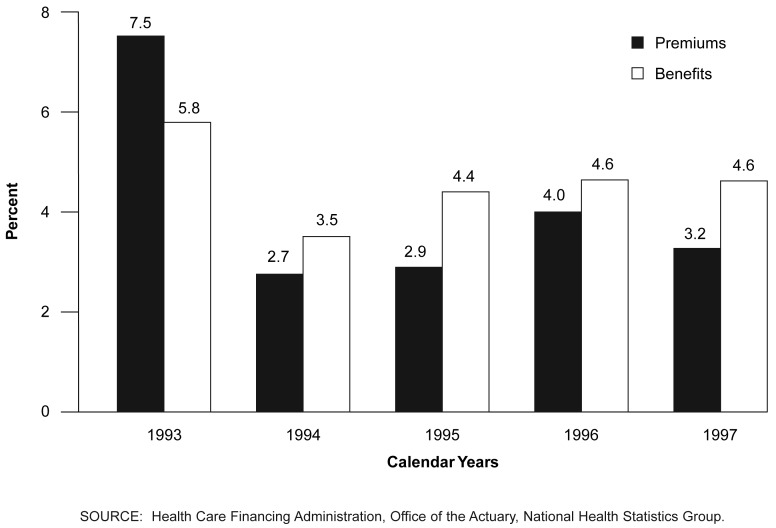
Figure 9. Private Health Insurance Premium and Benefit Growth: Calendar Years 1993-97.
PHI benefit payouts grew faster than premiums from 1994-97, a likely precursor of future increases in premium growth.
- In 1997 PHI expenditures ($348.0 billion) accounted for just under one-third of total health care spending ($1,092 billion). In 1997 PHI premiums grew just 3.2 percent, continuing a trend of extremely low growth that began in 1994.
- Although premium growth remains very low, the proportion of PHI premiums paid out for benefit claims has been rising since 1994, squeezing the operating margins of many insurance companies. Tough bargaining by employers and the desire by insurance companies to protect or gain market share have forced insurers to keep premium price increases down for the last 4 years. However, many analysts expect that managed care enrollment saturation, the introduction of costly new drugs and technologies, and the rising demand for health care services will drive a re-acceleration of health insurance premium growth over the coming decade (Smith et al., 1998).
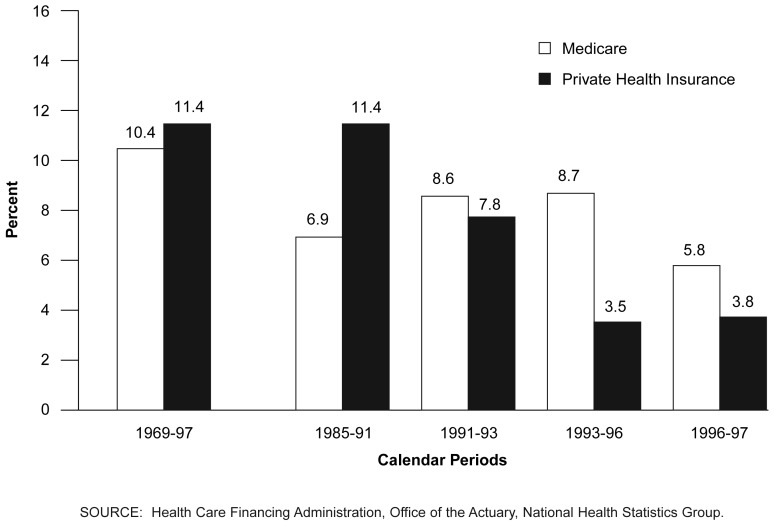
Figure 10. Comparison of Average Growth in Per Enrollee Medicare and Private Health Insurance Benefits: Selected Periods, 1969-97.
The gap between Medicare and PHI per enrollee growth rates narrowed in 1997.
- When compared over the entire 1969-97 period, Medicare and PHI per enrollee benefits grew at comparable average annual rates (10.4 and 11.4 percent, respectively).
- Two recent periods, 1985-91 and 1993-96, marked significant growth differences in expenditures funded by these two sources. Between 1985 and 1991, average annual PHI per enrollee growth exceeded Medicare growth by 4.5 percentage points. However, the relationship between Medicare and PHI per enrollee growth rates reversed over the 1993-96 period, as PHI growth slowed dramatically and Medicare growth maintained historical trend rates. The marked deceleration in PHI growth stemmed, in part, from the migration of enrollees with employer-sponsored health coverage into lower-average-cost managed care plans and the intense competition among all types of plans for market share.
- In the last 2 years, Medicare per enrollee growth has been decelerating, while PHI per enrollee growth has slightly accelerated, narrowing the growth gap between the two major payers. In 1997 Medicare and PHI benefits per enrollee grew 5.8 percent and 3.8 percent, respectively.
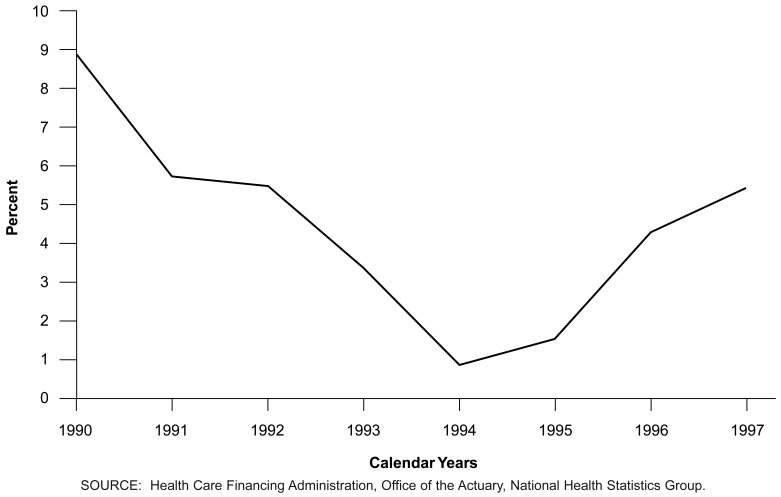
Figure 11. Annual Growth in Out-of-Pocket Payments: Calendar Years 1990-97.
Since 1994 the growth in out-of-pocket spending has accelerated.
- Out-of-pocket payments, which account for almost one-fifth of personal health care expenditures (19.4 percent), consist of direct spending by individuals for health care goods and services. This spending includes payments by insured individuals for services not covered by insurance, as well as required co-payments and deductibles.1 Out-of-pocket payments also include any payments for health services by uninsured individuals. From 1990 to 1994, growth in out-of-pocket spending fell substantially, reaching a low of only 0.9 percent. The low growth was driven, in part, by the continuous migration during this period of PHI enrollees out of traditional indemnity insurance into managed care plans, which usually require lower out-of-pocket payments (KPMG Peat Marwick, 1997).
- However, since 1994 out-of-pocket spending has begun to re-accelerate. Private survey data suggest that some of the accelerated growth during the last several years may be coming from these same managed care plans, which are now requiring enrollees to pay more, in the form of increased co-payments, to use plan benefits.
- Although deductibles and coinsurance rates have declined slightly since 1993, co-payments, particularly for health maintenance organization (HMO) and point of service (POS) plans, have been rising for many enrollees (KPMG Peat Marwick, 1997). For example, in 1993 only 34 percent of HMO enrollees had co-payments of $10 or more for a physician visit. In 1997, 70 percent of enrollees were required to pay at least $10. Similar trends are occurring in POS plans. In 1997 these two plan types covered about 50 percent of the enrolled workforce.
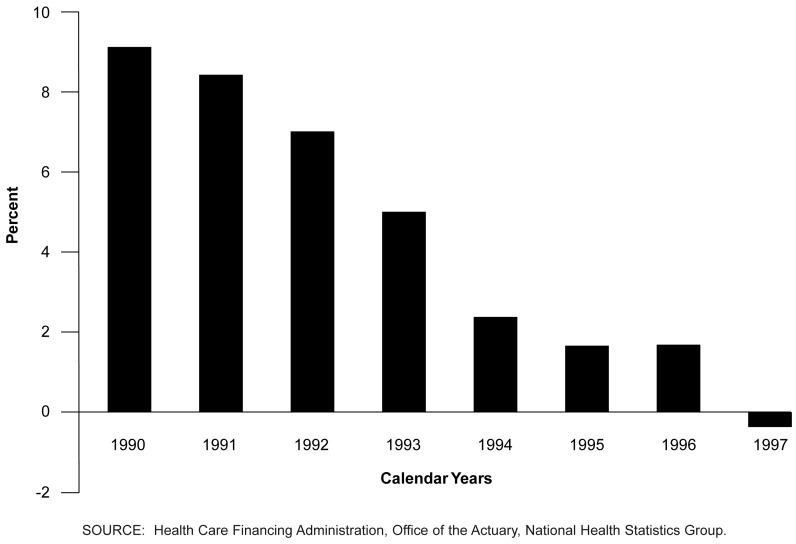
Figure 12. Growth in Community Hospital Inpatient Expenditures: Calendar Years 1990-97.
SPENDING BY SERVICE
The rapid deceleration of inpatient spending was key to slow hospital growth.
- Expenditures for hospital care totaled $371 billion in 1997. Hospital care expenditures have been growing at less than 4 percent each year for the past 4 years and reached an all-time low of just 2.9 percent in 1997.
- This low growth has been driven by a marked deceleration of spending for inpatient services in community hospitals, which actually fell 0.3 percent in 1997. The continued migration of persons insured under employer-sponsored insurance, Medicare, and Medicaid into managed care plans, along with rapid development of treatments deliverable in ambulatory settings, have caused slow spending growth in the inpatient hospital setting. Managed care has offered providers incentives to treat patients in less expensive ambulatory settings and, for patients who are admitted, to reduce lengths of inpatient stays.
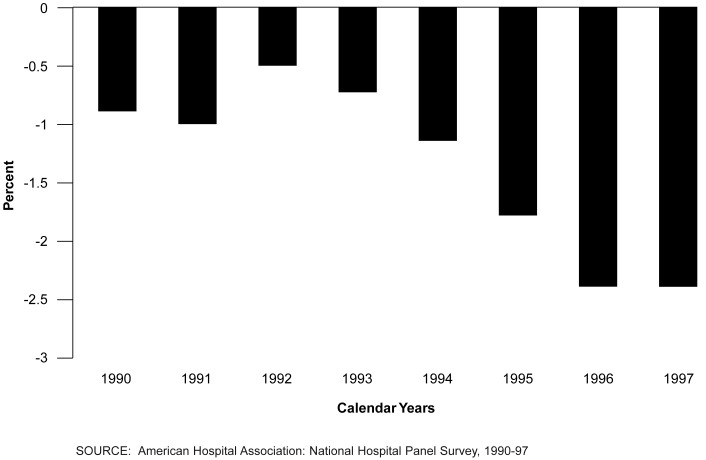
Figure 13. Annual Percent Change in Number of Hospital Beds: Calendar Years 1984-97.
Although hospitals closed thousands of beds, occupancy rates still fell from 1990 to 1997.
- As the demand for inpatient services has fallen, hospitals have closed staffed beds at a steady rate in an attempt to curtail overhead costs. Since 1990, 88,000 staffed community hospital beds have closed, a 10-percent reduction in inpatient capacity. Despite these closures and because of an even faster drop in inpatient days (down 16 percent), occupancy rates have fallen from 64.5 percent in 1990 to 59.6 percent in 1997.
Figure 14. Expenditures for Physician Services, by Source of Funds: Calendar Year 1997.
PHI paid for one-half of physician services in 1997.
- Expenditures for services provided in offices and clinics of physicians amounted to $218 billion in 1997, an increase of 4.4 percent from the previous year. This continues the trend of single-digit growth that started in 1992. Physician services are primarily funded by third-party payers: PHI accounts for 50 percent and public funds account for 32 percent, with the remaining 18 percent paid by individuals and other private funds (such as non-patient revenues and philanthropy).
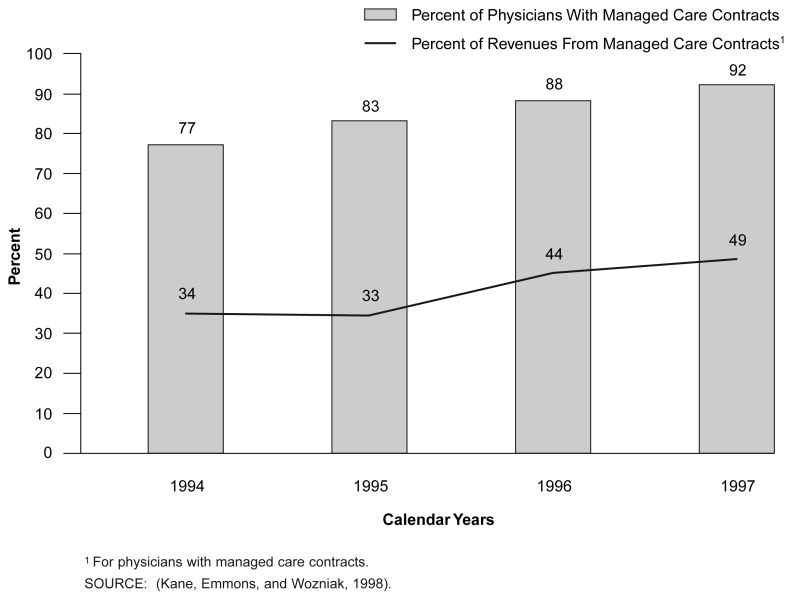
Figure 15. Physicians' Involvement With Managed Care: Calendar Years 1994-97.
The impact of managed care on physicians continued to grow.
- The shift from a traditional FFS payment system to a managed care environment is directly reflected in the source of physician revenues. In 1997 more than 90 percent of all physicians had at least one managed care contract, while revenues generated from these contracts had risen to almost one-half of these physicians' revenues. As managed care penetration has increased, there has been a deceleration in the growth of physician net income, an increase in the number of employed physicians, and increases in physician practice sizes (Kane, Emmons, and Wozniak, 1998).
- Because managed care plans rely more heavily on gatekeepers and preventive care, the number of primary care physicians was expected to increase as enrollment in these plans expanded. However, the recruitment for primary care physicians has actually decreased (Tanner, 1998), and some residents finishing primary care training have had difficulty obtaining employment or found only part-time work (Miller et al., 1998).
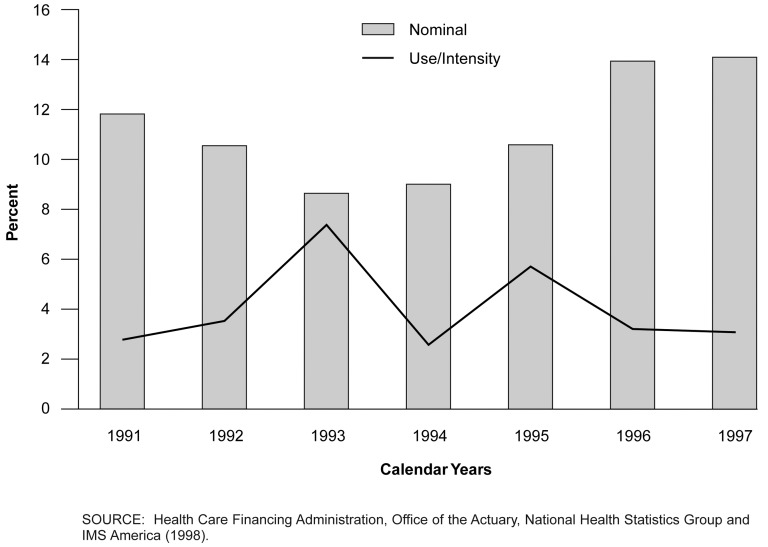
Figure 16. Growth in Nominal Expenditures and Use/Intensity for Prescription Drugs: Calendar Years 1991-97.
Despite slow spending growth for other services, spending for prescription drugs has been growing at double-digit rates.
- Retail spending for prescription drugs amounted to $78.9 billion in 1997. Over the past several years, spending for prescription drugs has grown at double-digit rates: 10.6 percent for 1995, 13.2 percent for 1996, and 14.1 percent for 1997.
- Growth in the number of prescriptions dispensed, up 6.0 percent in 1995 and 4.2 percent in both 1996 and 1997, are well above historical rates of 2.0 percent (IMS America, 1998). This suggests that part of the recent rapid increase in pharmacy expenditures was attributable to growth in utilization.
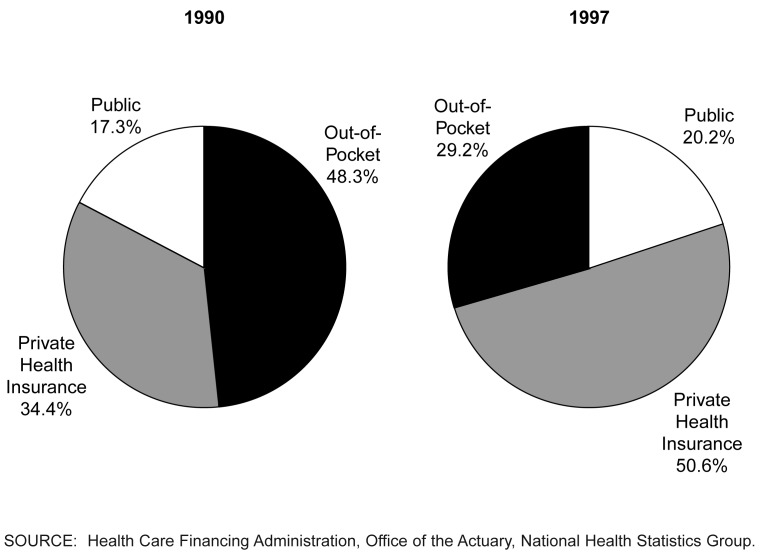
Figure 17. Expenditures for Prescription Drugs, by Source of Funds: Calendar Years 1990 and 1997.
Expanded third-party prescription drug coverage contributed to historically high utilization rates.
- One factor contributing to fast prescription drug growth was the increase in coverage by third-party payers. In 1990 out-of-pocket payments accounted for 48 percent of total prescription drug expenditures. By 1997 out-of-pocket payments had declined to 29 percent, while payments by third parties, primarily PHI and Medicaid, soared to 71 percent. Drug benefits among private insurers grew from 5.4 percent of premiums in 1990 to 11.4 percent in 1997; for Medicaid, spending grew from 6.7 percent to 8.3 percent of all payments.
- The existence of third-party coverage increases the likelihood that individuals will fill prescriptions, and the switch to managed care further compounds this trend. Although most medical plans have covered outpatient drugs for many years, the shift of plan subscribers from traditional FFS plans to managed care plans lowers out-of-pocket requirements (Baker and Kramer, 1995). In traditional FFS plans, outpatient prescription drugs are typically part of general plan coverages that require a yearly deductible. By contrast, HMOs require only a nominal dollar copayment per prescription, typically $5 to $10 (Novartis, 1997). The relatively low out-of-pocket costs of first-dollar coverage of prescription drugs in HMOs and other managed care plans may help to explain the recent growth in the utilization of prescription drug benefits.
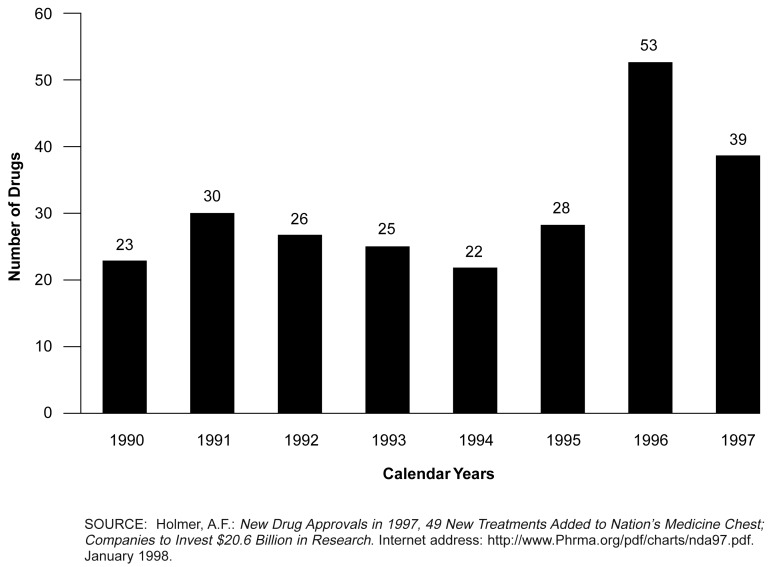
Figure 18. New Drugs Brought to Market: Calendar Years 1990-97.
Costly new drugs continue to flood the market.
- The Food and Drug Administration (FDA) is speeding new drugs into the marketplace at a record pace. The FDA approved 39 new drugs in 1997, second only to the 53 new drugs introduced in 1996. FDA approval times were also down, falling from 20.5 months in 1996 to 17 months in 1997 (Gebhart, 1998).
- New drugs are typically introduced at higher prices than existing drugs. Although utilization of new drugs released after 1992 represented only 16.8 percent of total 1997 utilization, they accounted for 30.6 percent of total 1997 costs (Express Scripts Online, 1998), reflecting the higher prices that tend to be charged for new drug products.
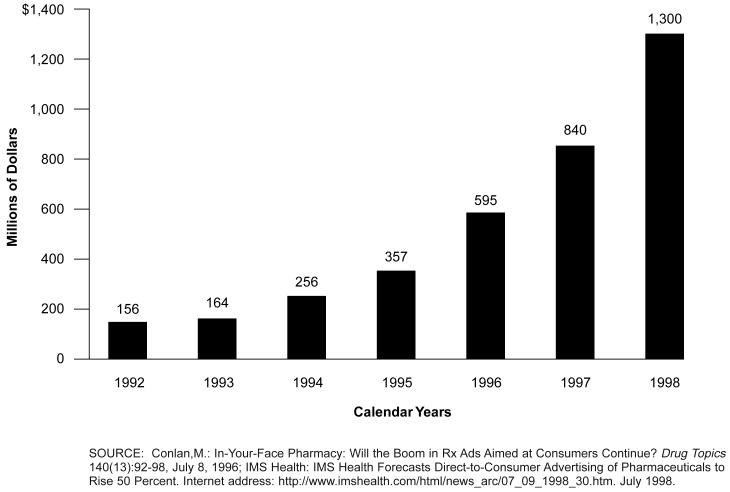
Figure 19. Spending for Direct-to-Consumer Prescription Drug Advertisements: Calendar Years 1992-97.
Spending for direct-to-consumer ads has risen 400 percent since 1994.
- Manufacturers induce utilization of new, higher priced prescription drugs through direct-to-consumer advertisements, thereby contributing to the accelerating spending growth trend. Estimates of spending for direct-to-consumer advertisements are projected to exceed $1.3 billion in 1998, a 400-percent increase over 1994 spending of $0.3 billion.
- Physicians report large increases in the number of patients requesting specific brand name drugs, one indication of the success of advertisements (Tanouye, 1996).
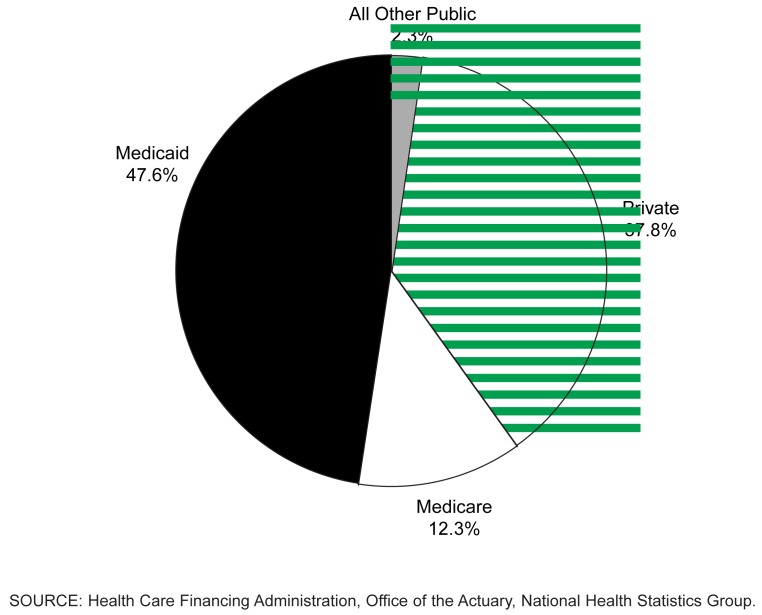
Figure 20. Expenditures for Freestanding Nursing Homes, by Source of Funds: Calendar Year 1997.
Public sources financed three-fifths of nursing home care.
- Expenditures for nursing home care provided by freestanding nursing facilities reached $82.8 billion in 1997, an increase of 4.3 percent over the previous year. Growth in nursing home spending slowed from 13.3 percent in 1990 to 4.3 percent in 1997. Contributing to this deceleration is slowing growth in nursing home personnel work-hours and in nursing home input prices.
- Public programs, primarily Medicaid, funded more than 60 percent of annual expenditures for nursing home care. Medicare's share of spending increased from 3.4 percent in 1990 and 1991 to 12.3 percent in 1997. Offsetting the increase in Medicare's share, the private share has declined from 49.0 percent in 1990 to 37.8 percent in 1997. Private funding is predominately direct out-of-pocket payments by patients or their families.
- Because Medicaid is the major payer for nursing home care, covering nearly one-half of such costs, changes in State Medicaid payment and coverage policies affect spending for all nursing home care. Part of the reason for the deceleration in total spending for nursing home care may be efforts by the States to use lower cost home and community-based care instead of more costly institutional care. The share of total Medicaid spending allocated to nursing home care declined from 30.7 percent in 1990 to 24.7 percent in 1997.
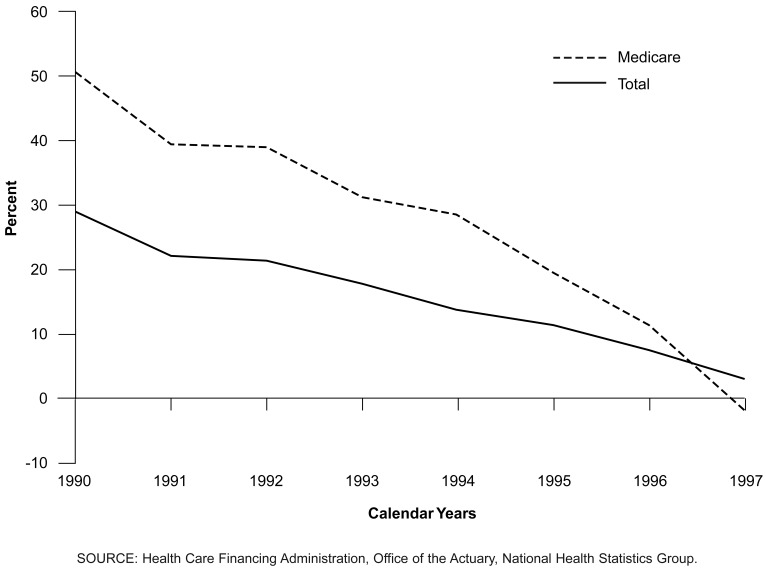
Figure 21. Expenditure Growth for Total and Medicare Home Health: Calendar Years 1990-97.
The 1997 record slow growth in spending for home health care was heavily influenced by Medicare spending.
- Expenditures for home health care delivered by freestanding facilities reached $32.3 billion in 1997. This was one of the smallest, and until recently, one of the fastest growing components of NHE. Since 1990 growth in spending for home health care has decelerated from 28.2 percent to 3.7 percent.
- Because Medicare finances 40 percent of home health care, steps to control Medicare spending contributed heavily to the overall spending slowdown for home health care. The 1993 Omnibus Budget Reconciliation Act placed a temporary moratorium on updates to the home health per visit cost limits. More recently Medicare instituted payment policy changes. Effective October 1997, the BBA changed Medicare payment rates for home health care by reducing Medicare per visit cost limits and by mandating payment of the lowest of three possible payment amounts: actual cost, per visit limit, or an aggregate agency-specific per beneficiary annual limit. Also, as part of Medicare's fraud and abuse detection activities, a moratorium was placed on the entry of all new home health agencies, which was in effect from September 1997 to January 1998.
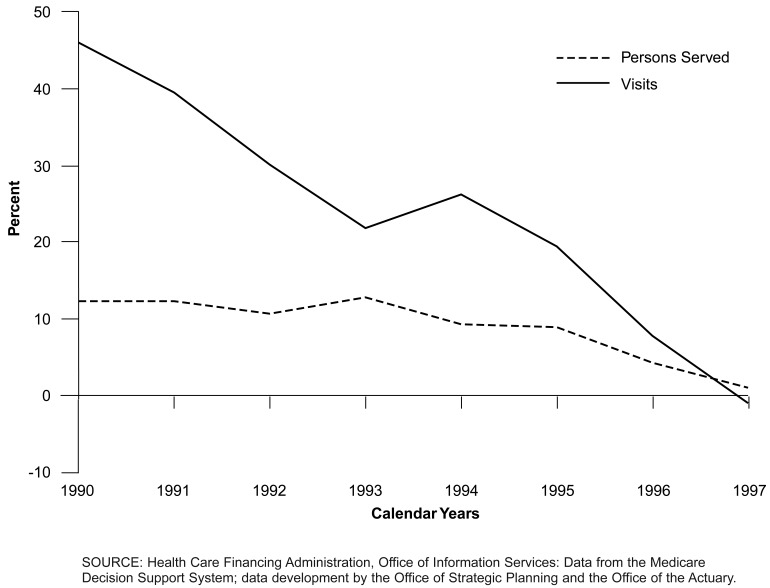
Figure 22. Growth in Number of Persons Served and Visits Per 1,000 Fee-For-Service Enrollees for Medicare Home Health Services: Calendar Years 1990-97.
Medicare home health utilization rates have dropped substantially since 1990.
- Growth in Medicare home health utilization peaked in 1990 after changes in Medicare regulations relaxed coverage and payment criteria. By 1990 the annual growth in all home health visits per 1,000 FFS enrollees reached 46.3 percent. Accelerated growth in the visit and persons-served rates, as well as changes in the mix of visits by type and the ensuing effect on expenditure growth, brought increased scrutiny by HCFA of the home health industry and prompted changes in Medicare home health regulations as well as reforms to the Medicare home health benefit under the BBA.
- HCFA's fraud and abuse detection activities resulted in a number of criminal proceedings and civil actions against certain home health agencies (HHAs). Intensified medical review efforts to curb fraud, waste, and abuse of Medicare home health claims led to increased claims denials and subsequent appeals by providers that were either upheld or, at the least, may have resulted in payment delays.
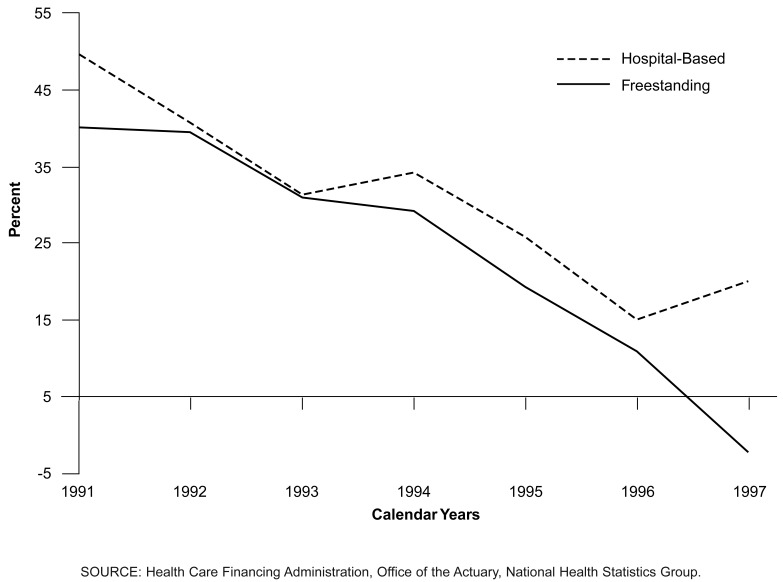
Figure 23. Growth in Medicare Expenditures for Freestanding and Hospital-Based Home Health Care: Calendar Years 1991-97.
In 1997 Medicare spending for freestanding home health care declined.
- The most dramatic deceleration in Medicare spending growth was for home health care furnished by freestanding HHAs, which fell 3.0 percent in 1997, continuing the decelerating trend that began in 1991. The 1997 decline compares with a 10.3-percent growth in 1996.
- Medicare spending for hospital-based home health care ($6.2 billion in 1997) is included with hospital care in the NHE. Growth in spending for home health care furnished by hospital-based HHAs followed the same general trend as freestanding HHAs through 1996. In 1997 these growth rates diverged and growth in hospital-based home health spending accelerated from 14.9 percent in 1996 to 20.0 percent in 1997.
Table 1. Distribution of Total Medicaid Payments, by Service: Selected Calendar Years 1967-97.
- The use of home and community-based waivers by States has been growing. For Medicaid recipients at risk of needing long-term institutional care, States use these waivers in an attempt to treat this group in less expensive community-based settings. Medicaid spending under home and community-based waivers is included with other personal health care (OPHC) in the NHE. The growth in waivers may explain some of the shift in the distribution of Medicaid program payments from the nursing home category in the NHE to OPHC. OPHC increased from 3.5 percent of Medicaid payments for personal health care in 1987 to 11.8 percent in 1997, offsetting much of the decline in the nursing home share.
| Service Category | 1967 | 1977 | 1987 | 1997 |
|---|---|---|---|---|
|
| ||||
| Percent | ||||
| Personal Health Care | 100.0 | 100.0 | 100.0 | 100.0 |
| Hospital Care | 54.0 | 43.3 | 39.5 | 37.8 |
| Physician Services | 11.5 | 11.4 | 9.4 | 10.3 |
| Dental Services | 4.5 | 2.6 | 1.2 | 1.3 |
| Other Professional Services | 0.9 | 1.0 | 0.7 | 1.1 |
| Home Health Care | 0.1 | 1.0 | 2.5 | 3.1 |
| Non-Durables | 6.7 | 6.2 | 7.1 | 8.7 |
| Nursing Home Care | 20.7 | 32.6 | 36.1 | 25.9 |
| Other Personal Health Care | 1.4 | 2.0 | 3.5 | 11.8 |
SOURCE: Health Care Financing Administration, Office of the Actuary, National Health Statistics Group.
Table 2. Medicare Population, Expenditures by Type of Coverage, and Service Distribution and Growth of Total Expenditures: Calendar Years 1990-97.
- In 1997 Medicare spent $214.6 billion for health care, accounting for 19.6 percent of NHE. Annual growth in aggregate Medicare spending slowed from 12.2 percent in 1994 to 7.2 percent in 1997. This recent deceleration reflects, in part, slowing medical price increases, legislated limits that restrain growth in Medicare payments to providers, penalties in 1996 and 1997 in the form of stricter limits on the growth in physician fees imposed on physicians for exceeding the Medicare volume performance standards in 1994 and 1995, provider reaction to fraud and abuse activities, and decelerating growth in the Medicare population.
- Growth in Medicare spending decelerated in 1997 for most types of benefits. The most notable exception is spending for physician services, which accelerated from 7.3 percent in 1996 to 8.5 percent in 1997. This acceleration is primarily attributable to the growth in enrollment in Medicare managed care plans. Medicare managed care plans tend to spend a larger percent of capitated payments on physician services than are purchased under Medicare fee-for-service (FFS)arrangements.
| Type of Expenditure | 1990 | 1991 | 1992 | 1993 | 1994 | 1995 | 1996 | 1997 |
|---|---|---|---|---|---|---|---|---|
| Number in Millions | ||||||||
| Enrollees1 | 34.2 | 34.9 | 35.6 | 36.3 | 36.9 | 37.5 | 38.1 | 38.4 |
| Percent | ||||||||
| Annual Percent Growth | 1.9 | 1.9 | 2.0 | 2.0 | 1.7 | 1.6 | 1.4 | 1.0 |
| Amount in Billions | ||||||||
| Health Services and Supplies | $111.5 | $121.1 | $136.2 | $148.7 | $166.9 | $185.2 | $200.1 | $214.6 |
| Fee-for-Service | 106.1 | 114.9 | 128.8 | 139.6 | 155.4 | 170.2 | 179.5 | 186.8 |
| Capitated Payments | 5.3 | 6.2 | 7.4 | 9.1 | 11.5 | 15.0 | 20.5 | 27.8 |
| Percent Distribution of Total | ||||||||
| Health Services and Supplies | 100.0 | 100.0 | 100.0 | 100.0 | 100.0 | 100.0 | 100.0 | 100.0 |
| Personal Health Care | 97.4 | 97.3 | 97.4 | 97.3 | 97.4 | 97.6 | 97.4 | 97.3 |
| Hospital Care | 61.6 | 61.0 | 61.7 | 60.6 | 59.8 | 58.8 | 58.1 | 57.7 |
| Physician Services | 26.2 | 25.1 | 23.0 | 22.3 | 21.7 | 21.5 | 21.4 | 21.6 |
| Dental Services | (2) | (2) | (2) | (2) | (2) | (2) | (2) | (2) |
| Other Professional Services | 2.9 | 3.4 | 3.7 | 3.8 | 4.0 | 4.2 | 4.2 | 4.1 |
| Home Health Care | 2.7 | 3.5 | 4.3 | 5.2 | 6.0 | 6.4 | 6.6 | 5.9 |
| Drugs and Other Medical Non-Durables | 0.1 | 0.1 | 0.1 | 0.1 | 0.2 | 0.2 | 0.4 | 0.4 |
| Vision Products and Other Medical Durables | 2.3 | 2.6 | 2.6 | 2.6 | 2.5 | 2.7 | 2.7 | 2.8 |
| Nursing Home Care | 1.6 | 1.6 | 2.1 | 2.7 | 3.3 | 3.6 | 4.0 | 4.7 |
| Program Administration and Net Cost of Insurance3 | 2.6 | 2.7 | 2.6 | 2.7 | 2.6 | 2.4 | 2.6 | 2.7 |
| Annual Percent Change | ||||||||
| Health Services and Supplies | 8.9 | 8.6 | 12.4 | 9.2 | 12.2 | 11.0 | 8.0 | 7.2 |
| Personal Health Care | 9.1 | 8.5 | 12.6 | 9.1 | 12.4 | 11.1 | 7.8 | 7.2 |
| Hospital Care | 8.2 | 7.5 | 13.7 | 7.2 | 10.7 | 9.3 | 6.7 | 6.4 |
| Physician Services | 9.2 | 4.2 | 2.7 | 6.2 | 9.0 | 10.2 | 7.3 | 8.5 |
| Dental Services | — | — | — | — | — | — | — | — |
| Other Professional Services | 28.0 | 26.3 | 21.5 | 12.9 | 18.6 | 15.7 | 8.0 | 4.2 |
| Home Health Care | 50.1 | 39.9 | 39.0 | 31.8 | 28.9 | 19.5 | 10.3 | -3.0 |
| Drugs and Other Medical Non-Durables | 18.1 | 16.6 | 18.9 | 38.8 | 69.3 | 76.4 | 60.4 | 33.2 |
| Vision Products and Other Medical Durables | 17.5 | 22.3 | 13.0 | 10.8 | 7.2 | 18.7 | 9.4 | 11.4 |
| Nursing Home Care | -30.5 | 11.7 | 48.5 | 37.4 | 39.7 | 22.2 | 19.3 | 26.3 |
| Program Administration and Net Cost of Insurance3 | 1.7 | 13.6 | 5.6 | 15.0 | 7.4 | 5.0 | 16.0 | 9.4 |
Hospital Insurance and/or Supplementary Medical Insurance enrollees as of July 1.
Less than 0.05 percent.
Includes administrative costs for the fee-for-service programs and administrative and net cost of insurance for Medicare managed care plans.
SOURCE: Health Care Financing Administration, Office of the Actuary, National Health Statistics Group.
Table 3. Hospital Revenues, Percent Distribution, and Annual Percent Growth: Calendar Years 1991-97.
- One area of robust growth was outpatient revenues, which grew 10.3 percent in 1997, compared with a decline of 0.3 percent for inpatient revenues.
| Type of Hospital | 1991 | 1992 | 1993 | 1994 | 1995 | 1996 | 1997 |
|---|---|---|---|---|---|---|---|
| Revenues in Millions | |||||||
| Total | $282,272 | $305,313 | $322,995 | $335,717 | $347,227 | $360,777 | $371,061 |
| Non-Federal | 262,532 | 284,619 | 300,979 | 313,039 | 323,973 | 336,912 | 347,404 |
| Community | 245,463 | 267,841 | 284,702 | 297,247 | 308,490 | 321,242 | 331,251 |
| Inpatient | 183,506 | 196,422 | 206,273 | 211,075 | 214,649 | 218,321 | 217,736 |
| Outpatient | 61,957 | 71,419 | 78,429 | 86,172 | 93,841 | 102,921 | 113,515 |
| Non-Community | 17,069 | 16,778 | 16,277 | 15,792 | 15,483 | 15,670 | 16,153 |
| Federal | 19,740 | 20,694 | 22,016 | 22,678 | 23,254 | 23,865 | 23,658 |
| Percent Distribution | |||||||
| Total | 100 | 100 | 100 | 100 | 100 | 100 | 100 |
| Non-Federal | 93 | 93 | 93 | 93 | 93 | 93 | 94 |
| Community | 87 | 88 | 88 | 89 | 89 | 89 | 89 |
| Inpatient | 65 | 64 | 64 | 63 | 62 | 61 | 59 |
| Outpatient | 22 | 23 | 24 | 26 | 27 | 29 | 31 |
| Non-Community | 6 | 5 | 5 | 5 | 4 | 4 | 4 |
| Federal | 7 | 7 | 7 | 7 | 7 | 7 | 6 |
| Annual Percent Growth | |||||||
| Total | 10.1 | 8.2 | 5.8 | 3.9 | 3.4 | 3.9 | 2.9 |
| Non-Federal | 10.0 | 8.4 | 5.7 | 4.0 | 3.5 | 4.0 | 3.1 |
| Community | 10.8 | 9.1 | 6.3 | 4.4 | 3.8 | 4.1 | 3.1 |
| Inpatient | 8.4 | 7.0 | 5.0 | 2.3 | 1.7 | 1.7 | -0.3 |
| Outpatient | 18.3 | 15.3 | 9.8 | 9.9 | 8.9 | 9.7 | 10.3 |
| Non-Community | 0.6 | -1.7 | -3.0 | -3.0 | -2.0 | 1.2 | 3.1 |
| Federal | 10.4 | 4.8 | 6.4 | 3.0 | 2.5 | 2.6 | -0.9 |
NOTE: Non-community non-Federal hospitals include long-term care hospitals (where the average length of stay is 30 days or longer), psychiatric hospitals, alcohol and chemical dependency hospitals, units of institutions such as prison hospitals or college infirmaries, chronic disease hospitals, and some institutions for the mentally retarded.
SOURCE: Health Care Financing Administration, Office of the Actuary, National Health Statistics Group.
Table 5. National Health Expenditures Aggregate Amounts and Average Annual Percent Change, by Type of Expenditure: Selected Calendar Years 1980-97.
| Type of Expenditure | 1980 | 1985 | 1990 | 1991 | 1992 | 1993 | 1994 | 1995 | 1996 | 1997 |
|---|---|---|---|---|---|---|---|---|---|---|
| Amount in Billions | ||||||||||
| National Health Expenditures | $247.3 | $428.7 | $699.4 | $766.8 | $836.5 | $898.5 | $947.7 | $993.7 | $1,042.5 | $1,092.4 |
| Health Services and Supplies | 235.6 | 412.3 | 674.8 | 741.9 | 809.0 | 869.5 | 917.2 | 963.1 | 1,010.6 | 1,057.5 |
| Personal Health Care | 217.0 | 376.4 | 614.7 | 679.6 | 740.7 | 790.5 | 834.0 | 879.3 | 924.0 | 969.0 |
| Hospital Care | 102.7 | 168.3 | 256.4 | 282.3 | 305.3 | 323.0 | 335.7 | 347.2 | 360.8 | 371.1 |
| Physician Services | 45.2 | 83.6 | 146.3 | 162.2 | 175.9 | 185.9 | 193.0 | 201.9 | 208.5 | 217.6 |
| Dental Services | 13.3 | 21.7 | 31.6 | 33.3 | 37.0 | 39.5 | 42.4 | 45.0 | 47.5 | 50.6 |
| Other Professional Services | 6.4 | 16.6 | 34.7 | 38.3 | 42.1 | 46.1 | 49.6 | 53.6 | 57.5 | 61.9 |
| Home Health Care | 2.4 | 5.6 | 13.1 | 16.1 | 19.6 | 23.0 | 26.2 | 29.1 | 31.2 | 32.3 |
| Drugs and Other Medical Non-Durables | 21.6 | 37.1 | 59.9 | 65.6 | 71.2 | 76.2 | 81.6 | 88.9 | 98.3 | 108.9 |
| Prescription Drugs | 12.0 | 21.2 | 37.7 | 42.1 | 46.6 | 50.6 | 55.2 | 61.1 | 69.1 | 78.9 |
| Vision Products and Other Medical Durables | 3.8 | 6.7 | 10.5 | 11.2 | 11.9 | 12.3 | 12.5 | 13.1 | 13.4 | 13.9 |
| Nursing Home Care | 17.6 | 30.7 | 50.9 | 57.2 | 62.3 | 66.4 | 71.1 | 75.5 | 79.4 | 82.8 |
| Other Personal Health Care | 4.0 | 6.1 | 11.2 | 13.6 | 15.4 | 18.0 | 21.9 | 25.1 | 27.4 | 29.9 |
| Program Administration and Net Cost of Private Health Insurance | 11.9 | 24.3 | 40.5 | 40.9 | 44.9 | 53.7 | 55.1 | 53.3 | 52.5 | 50.0 |
| Government Public Health Activities | 6.7 | 11.6 | 19.6 | 21.4 | 23.4 | 25.3 | 28.2 | 30.4 | 34.0 | 38.5 |
| Research and Construction | 11.6 | 16.4 | 24.5 | 24.9 | 27.5 | 29.0 | 30.5 | 30.6 | 32.0 | 34.9 |
| Research1 | 5.5 | 7.8 | 12.2 | 12.9 | 14.2 | 14.5 | 15.9 | 16.7 | 17.2 | 18.0 |
| Construction | 6.2 | 8.5 | 12.3 | 12.0 | 13.4 | 14.5 | 14.6 | 13.9 | 14.8 | 16.9 |
| Average Annual Percent Change from Previous Year Shown | ||||||||||
| National Health Expenditures | 211.7 | 11.6 | 10.3 | 9.6 | 9.1 | 7.4 | 5.5 | 4.9 | 4.9 | 4.8 |
| Health Services and Supplies | 211.8 | 11.8 | 10.4 | 9.9 | 9.1 | 7.5 | 5.5 | 5.0 | 4.9 | 4.6 |
| Personal Health Care | 211.7 | 11.6 | 10.3 | 10.6 | 9.0 | 6.7 | 5.5 | 5.4 | 5.1 | 4.9 |
| Hospital Care | 212.8 | 10.4 | 8.8 | 10.1 | 8.2 | 5.8 | 3.9 | 3.4 | 3.9 | 2.9 |
| Physician Services | 211.3 | 13.1 | 11.8 | 10.8 | 8.5 | 5.7 | 3.8 | 4.6 | 3.3 | 4.4 |
| Dental Services | 210.0 | 10.2 | 7.8 | 5.6 | 11.0 | 6.8 | 7.3 | 6.1 | 5.6 | 6.5 |
| Other Professional Services | 212.5 | 21.2 | 15.8 | 10.4 | 10.0 | 9.6 | 7.5 | 8.1 | 7.2 | 7.7 |
| Home Health Care | 220.6 | 18.9 | 18.4 | 22.4 | 22.3 | 17.0 | 14.1 | 11.0 | 7.1 | 3.7 |
| Drugs and Other Medical Non-Durables | 28.5 | 11.4 | 10.1 | 9.4 | 8.6 | 7.1 | 7.0 | 9.0 | 10.6 | 10.7 |
| Prescription Drugs | 27.8 | 11.9 | 12.2 | 11.9 | 10.6 | 8.7 | 9.0 | 10.6 | 13.2 | 14.1 |
| Vision Products and Other Medical Durables | 29.2 | 12.4 | 9.2 | 7.0 | 6.3 | 3.4 | 1.5 | 4.9 | 2.3 | 3.6 |
| Nursing Home Care | 216.4 | 11.7 | 10.7 | 12.2 | 9.0 | 6.7 | 7.0 | 6.2 | 5.2 | 4.3 |
| Other Personal Health Care | 29.2 | 8.8 | 12.9 | 20.7 | 13.3 | 17.0 | 21.8 | 14.5 | 9.5 | 9.0 |
| Program Administration and Net Cost of Private Health Insurance | 212.3 | 15.4 | 10.8 | 0.8 | 9.9 | 19.5 | 2.7 | -3.2 | -1.5 | -4.8 |
| Government Public Health Activities | 215.6 | 11.5 | 11.0 | 9.2 | 9.3 | 8.1 | 11.3 | 8.0 | 11.9 | 13.1 |
| Research and Construction | 210.1 | 7.1 | 8.4 | 1.7 | 10.5 | 5.3 | 5.1 | 0.5 | 4.3 | 9.2 |
| Research1 | 210.9 | 7.5 | 9.3 | 5.8 | 9.8 | 2.2 | 9.6 | 5.2 | 2.6 | 4.7 |
| Construction | 29.5 | 6.7 | 7.6 | -2.4 | 11.2 | 8.7 | 0.5 | -4.6 | 6.3 | 14.3 |
Research and development expenditures of drug companies and other manufacturers and providers of medical equipment and supplies are excluded from research expenditures but are included in the expenditure class in which the product falls.
Average annual growth between 1960 and 1980.
NOTE: Numbers may not add to totals because of rounding.
SOURCE: Health Care Financing Administration, Office of the Actuary, National Health Statistics Group.
Table 6. National Health Expenditures, by Source of Funds and Type of Expenditure: Calendar Years 1992-97.
| Year and Type of Expenditure | Total | Private | Government | ||||||
|---|---|---|---|---|---|---|---|---|---|
|
| |||||||||
| All Private Funds | Consumer | Other | |||||||
|
|
|
||||||||
| Total | Out-of-Pocket Payments | Private Health Insurance | Total | Federal | State and Local | ||||
|
| |||||||||
| Amount in Billions | |||||||||
| 1992 | |||||||||
| National Health Expenditures | $836.5 | $483.6 | $447.2 | $161.8 | $285.5 | $36.3 | $353.0 | $251.8 | $101.2 |
| Health Services and Supplies | 809.0 | 472.5 | 447.2 | 161.8 | 285.5 | 25.3 | 336.4 | 240.0 | 96.5 |
| Personal Health Care | 740.7 | 437.1 | 412.4 | 161.8 | 250.6 | 24.7 | 303.6 | 230.5 | 73.0 |
| Hospital Care | 305.3 | 132.5 | 120.9 | 13.7 | 107.2 | 11.6 | 172.8 | 138.7 | 34.1 |
| Physician Services | 175.9 | 123.6 | 120.5 | 33.7 | 86.8 | 3.2 | 52.3 | 40.4 | 11.8 |
| Dental Services | 37.0 | 35.6 | 35.5 | 17.8 | 17.7 | 0.1 | 1.4 | 0.8 | 0.6 |
| Other Professional Services | 42.1 | 33.1 | 30.1 | 15.2 | 14.8 | 3.0 | 9.0 | 6.3 | 2.7 |
| Home Health Care | 19.6 | 10.8 | 7.9 | 5.0 | 2.9 | 2.9 | 8.8 | 7.4 | 1.4 |
| Drugs and Other Medical Non-Durables | 71.2 | 62.9 | 62.9 | 45.0 | 17.9 | — | 8.3 | 4.2 | 4.1 |
| Vision Products and Other Medical Durables | 11.9 | 8.0 | 8.0 | 7.3 | 0.7 | — | 3.9 | 3.8 | 0.1 |
| Nursing Home Care | 62.3 | 27.9 | 26.7 | 24.1 | 2.6 | 1.2 | 34.4 | 21.2 | 13.2 |
| Other Personal Health Care | 15.4 | 2.6 | — | — | — | 2.6 | 12.7 | 7.8 | 5.0 |
| Program Administration and Net Cost of Private Health Insurance | 44.9 | 35.4 | 34.8 | — | 34.8 | 0.6 | 9.5 | 6.4 | 3.1 |
| Government Public Health Activities | 23.4 | — | — | — | — | — | 23.4 | 3.0 | 20.4 |
| Research and Construction | 27.5 | 11.0 | — | — | — | 11.0 | 16.5 | 11.8 | 4.7 |
| Research | 14.2 | 1.2 | — | — | — | 1.2 | 13.0 | 11.0 | 2.0 |
| Construction | 13.4 | 9.8 | — | — | — | 9.8 | 3.5 | 0.8 | 2.8 |
| 1993 | |||||||||
| National Health Expenditures | 898.5 | 513.2 | 473.9 | 167.1 | 306.8 | 39.3 | 385.3 | 275.4 | 110.0 |
| Health Services and Supplies | 869.5 | 501.3 | 473.9 | 167.1 | 306.8 | 27.4 | 368.2 | 263.3 | 104.9 |
| Personal Health Care | 790.5 | 459.1 | 432.3 | 167.1 | 265.2 | 26.8 | 331.4 | 252.3 | 79.1 |
| Hospital Care | 323.0 | 136.7 | 124.0 | 14.1 | 109.9 | 12.7 | 186.3 | 148.8 | 37.5 |
| Physician Services | 185.9 | 130.4 | 127.1 | 33.0 | 94.1 | 3.3 | 55.5 | 43.4 | 12.1 |
| Dental Services | 39.5 | 37.6 | 37.5 | 18.8 | 18.7 | 0.2 | 1.9 | 1.1 | 0.8 |
| Other Professional Services | 46.1 | 36.2 | 32.8 | 17.0 | 15.8 | 3.4 | 9.9 | 7.1 | 2.8 |
| Home Health Care | 23.0 | 11.9 | 8.7 | 5.6 | 3.1 | 3.2 | 11.1 | 9.5 | 1.5 |
| Drugs and Other Medical Non-Durables | 76.2 | 66.9 | 66.9 | 46.8 | 20.1 | — | 9.3 | 4.9 | 4.4 |
| Vision Products and Other Medical Durables | 12.3 | 8.0 | 8.0 | 7.3 | 0.7 | — | 4.3 | 4.2 | 0.1 |
| Nursing Home Care | 66.4 | 28.6 | 27.3 | 24.5 | 2.8 | 1.2 | 37.9 | 24.0 | 13.9 |
| Other Personal Health Care | 18.0 | 2.8 | — | — | — | 2.8 | 15.1 | 9.2 | 5.9 |
| Program Administration and Net Cost of Private Health Insurance | 53.7 | 42.1 | 41.6 | — | 41.6 | 0.6 | 11.5 | 7.7 | 3.8 |
| Government Public Health Activities | 25.3 | — | — | — | — | — | 25.3 | 3.3 | 22.0 |
| Research and Construction | 29.0 | 11.9 | — | — | — | 11.9 | 17.1 | 12.1 | 5.0 |
| Research | 14.5 | 1.2 | — | — | — | 1.2 | 13.3 | 11.1 | 2.1 |
| Construction | 14.5 | 10.7 | — | — | — | 10.7 | 3.8 | 0.9 | 2.9 |
| 1994 | |||||||||
| National Health Expenditures | $947.7 | $524.9 | $483.6 | $168.5 | $315.1 | $41.3 | $422.8 | $301.2 | $121.6 |
| Health Services and Supplies | 917.2 | 513.1 | 483.6 | 168.5 | 315.1 | 29.5 | 404.1 | 288.0 | 116.1 |
| Personal Health Care | 834.0 | 472.0 | 443.0 | 168.5 | 274.5 | 28.9 | 362.0 | 275.7 | 86.3 |
| Hospital Care | 335.7 | 134.9 | 121.2 | 12.7 | 108.6 | 13.7 | 200.8 | 159.9 | 40.9 |
| Physician Services | 193.0 | 133.9 | 130.3 | 31.4 | 98.9 | 3.6 | 59.1 | 46.8 | 12.4 |
| Dental Services | 42.4 | 40.4 | 40.2 | 20.0 | 20.2 | 0.2 | 2.0 | 1.1 | 0.9 |
| Other Professional Services | 49.6 | 38.5 | 34.7 | 18.3 | 16.4 | 3.7 | 11.1 | 8.3 | 2.8 |
| Home Health Care | 26.2 | 12.5 | 9.2 | 5.9 | 3.3 | 3.4 | 13.7 | 11.9 | 1.8 |
| Drugs and Other Medical Non-Durables | 81.6 | 71.2 | 71.2 | 47.8 | 23.5 | — | 10.4 | 5.4 | 4.9 |
| Vision Products and Other Medical Durables | 12.5 | 7.8 | 7.8 | 7.2 | 0.6 | — | 4.6 | 4.5 | 0.1 |
| Nursing Home Care | 71.1 | 29.6 | 28.3 | 25.3 | 3.0 | 1.3 | 41.4 | 26.5 | 14.9 |
| Other Personal Health Care | 21.9 | 3.1 | — | — | — | 3.1 | 18.8 | 11.3 | 7.5 |
| Program Administration and Net Cost of Private Health Insurance | 55.1 | 41.2 | 40.6 | — | 40.6 | 0.6 | 13.9 | 8.5 | 5.5 |
| Government Public Health Activities | 28.2 | — | — | — | — | — | 28.2 | 3.8 | 24.4 |
| Research and Construction | 30.5 | 11.8 | — | — | — | 11.8 | 18.7 | 13.2 | 5.5 |
| Research | 15.9 | 1.3 | — | — | — | 1.3 | 14.6 | 12.3 | 2.3 |
| Construction | 14.6 | 10.5 | — | — | — | 10.5 | 4.1 | 0.9 | 3.2 |
| 1995 | |||||||||
| National Health Expenditures | 993.7 | 538.5 | 495.3 | 171.0 | 324.3 | 43.2 | 455.2 | 326.0 | 129.2 |
| Health Services and Supplies | 963.1 | 527.6 | 495.3 | 171.0 | 324.3 | 32.3 | 435.5 | 312.0 | 123.5 |
| Personal Health Care | 879.3 | 489.2 | 457.6 | 171.0 | 286.6 | 31.6 | 390.1 | 299.0 | 91.2 |
| Hospital Care | 347.2 | 133.7 | 118.8 | 11.5 | 107.3 | 14.9 | 213.5 | 170.6 | 42.9 |
| Physician Services | 201.9 | 138.6 | 134.4 | 30.0 | 104.4 | 4.2 | 63.2 | 50.9 | 12.4 |
| Dental Services | 45.0 | 43.0 | 42.8 | 21.1 | 21.7 | 0.2 | 2.0 | 1.1 | 0.9 |
| Other Professional Services | 53.6 | 41.2 | 37.1 | 19.9 | 17.2 | 4.1 | 12.4 | 9.5 | 2.9 |
| Home Health Care | 29.1 | 13.1 | 9.6 | 6.2 | 3.4 | 3.5 | 16.0 | 14.0 | 1.9 |
| Drugs and Other Medical Non-Durables | 88.9 | 77.2 | 77.2 | 48.6 | 28.6 | — | 11.7 | 6.3 | 5.4 |
| Vision Products and Other Medical Durables | 13.1 | 7.7 | 7.7 | 7.1 | 0.6 | — | 5.4 | 5.3 | 0.1 |
| Nursing Home Care | 75.5 | 31.4 | 30.0 | 26.6 | 3.4 | 1.4 | 44.0 | 28.4 | 15.6 |
| Other Personal Health Care | 25.1 | 3.3 | — | — | — | 3.3 | 21.8 | 12.8 | 9.0 |
| Program Administration and Net Cost of Private Health Insurance | 53.3 | 38.4 | 37.7 | — | 37.7 | 0.7 | 15.0 | 9.2 | 5.7 |
| Government Public Health Activities | 30.4 | — | — | — | — | — | 30.4 | 3.8 | 26.6 |
| Research and Construction | 30.6 | 11.0 | — | — | — | 11.0 | 19.7 | 14.0 | 5.7 |
| Research | 16.7 | 1.3 | — | — | — | 1.3 | 15.4 | 12.9 | 2.5 |
| Construction | 13.9 | 9.6 | — | — | — | 9.6 | 4.3 | 1.1 | 3.2 |
| 1996 | |||||||||
| National Health Expenditures | $1,042.5 | $561.1 | $515.2 | $178.1 | $337.1 | $45.9 | $481.4 | $348.0 | $133.4 |
| Health Services and Supplies | 1,010.6 | 549.5 | 515.2 | 178.1 | 337.1 | 34.2 | 461.1 | 333.6 | 127.5 |
| Personal Health Care | 924.0 | 511.4 | 477.9 | 178.1 | 299.8 | 33.5 | 412.6 | 319.8 | 92.8 |
| Hospital Care | 360.8 | 138.0 | 121.9 | 11.8 | 110.0 | 16.1 | 222.8 | 179.6 | 43.2 |
| Physician Services | 208.5 | 142.3 | 138.0 | 31.1 | 106.9 | 4.3 | 66.2 | 54.4 | 11.8 |
| Dental Services | 47.5 | 45.4 | 45.2 | 22.1 | 23.2 | 0.2 | 2.1 | 1.2 | 0.9 |
| Other Professional Services | 57.5 | 44.3 | 40.0 | 21.9 | 18.0 | 4.3 | 13.2 | 10.4 | 2.8 |
| Home Health Care | 31.2 | 13.7 | 10.0 | 6.5 | 3.5 | 3.7 | 17.5 | 15.5 | 2.0 |
| Drugs and Other Medical Non-Durables | 98.3 | 84.9 | 84.9 | 51.0 | 33.9 | — | 13.4 | 7.5 | 5.9 |
| Vision Products and Other Medical Durables | 13.4 | 7.5 | 7.5 | 6.9 | 0.6 | — | 5.9 | 5.8 | 0.1 |
| Nursing Home Care | 79.4 | 31.9 | 30.4 | 26.7 | 3.7 | 1.5 | 47.4 | 31.3 | 16.2 |
| Other Personal Health Care | 27.4 | 3.4 | — | — | — | 3.4 | 24.0 | 14.1 | 9.9 |
| Program Administration and Net Cost of Private Health Insurance | 52.5 | 38.0 | 37.3 | — | 37.3 | 0.7 | 14.5 | 9.9 | 4.5 |
| Government Public Health Activities | 34.0 | — | — | — | — | — | 34.0 | 3.9 | 30.1 |
| Research and Construction | 32.0 | 11.7 | — | — | — | 11.7 | 20.3 | 14.4 | 5.9 |
| Research | 17.2 | 1.4 | — | — | — | 1.4 | 15.7 | 13.2 | 2.5 |
| Construction | 14.8 | 10.3 | — | — | — | 10.3 | 4.6 | 1.2 | 3.3 |
| 1997 | |||||||||
| National Health Expenditures | 1,092.4 | 585.3 | 535.6 | 187.6 | 348.0 | 49.7 | 507.1 | 367.0 | 140.0 |
| Health Services and Supplies | 1,057.5 | 571.9 | 535.6 | 187.6 | 348.0 | 36.4 | 485.5 | 351.8 | 133.8 |
| Personal Health Care | 969.0 | 536.7 | 501.0 | 187.6 | 313.5 | 35.6 | 432.4 | 337.3 | 95.1 |
| Hospital Care | 371.1 | 142.6 | 125.4 | 12.4 | 113.0 | 17.2 | 228.4 | 185.6 | 42.8 |
| Physician Services | 217.6 | 147.5 | 143.2 | 34.1 | 109.1 | 4.3 | 70.1 | 58.4 | 11.7 |
| Dental Services | 50.6 | 48.4 | 48.1 | 23.9 | 24.3 | 0.2 | 2.3 | 1.3 | 1.0 |
| Other Professional Services | 61.9 | 48.3 | 43.5 | 24.6 | 18.9 | 4.8 | 13.6 | 10.8 | 2.8 |
| Home Health Care | 32.3 | 14.7 | 10.7 | 7.0 | 3.7 | 3.9 | 17.7 | 15.4 | 2.3 |
| Drugs and Other Medical Non-Durables | 108.9 | 92.9 | 92.9 | 53.0 | 39.9 | — | 16.0 | 9.2 | 6.8 |
| Vision Products and Other Medical Durables | 13.9 | 7.3 | 7.3 | 6.8 | 0.5 | — | 6.6 | 6.4 | 0.1 |
| Nursing Home Care | 82.8 | 31.3 | 29.8 | 25.7 | 4.0 | 1.6 | 51.4 | 34.5 | 16.9 |
| Other Personal Health Care | 29.9 | 3.6 | — | — | — | 3.6 | 26.3 | 15.6 | 10.7 |
| Program Administration and Net Cost of Private Health Insurance | 50.0 | 35.3 | 34.6 | — | 34.6 | 0.7 | 14.7 | 10.4 | 4.3 |
| Government Public Health Activities | 38.5 | — | — | — | — | — | 38.5 | 4.1 | 34.4 |
| Research and Construction | 34.9 | 13.4 | — | — | — | 13.4 | 21.5 | 15.3 | 6.3 |
| Research | 18.0 | 1.5 | — | — | — | 1.5 | 16.5 | 13.8 | 2.6 |
| Construction | 16.9 | 11.9 | — | — | — | 11.9 | 5.1 | 1.4 | 3.6 |
NOTES: Research and development expenditures of drug companies and other manufacturers and providers of medical equipment and supplies are excluded from research expenditures, but are included in the expenditure class in which the product falls. Numbers may not add to totals because of rounding.
SOURCE: Health Care Financing Administration, Office of the Actuary, National Health Statistics Group.
Table 7. Personal Health Care Expenditures Aggregate and Per Capita Amounts and Percent Distribution, by Source of Funds: Selected Calendar Years 1980-97.
| Year | Total | Out-of-Pocket Payments | Third-Party Payments | Medicare1 | Medicaid2 | |||||
|---|---|---|---|---|---|---|---|---|---|---|
|
| ||||||||||
| Total | Private Health Insurance | Other Private Funds | Government | |||||||
|
| ||||||||||
| Total | Federal | State and Local | ||||||||
| Amount in Billions | ||||||||||
| 1980 | $217.0 | $60.3 | $156.8 | $62.0 | $7.8 | $87.0 | $63.4 | $23.6 | $36.4 | $24.8 |
| 1985 | 376.4 | 100.7 | 275.8 | 114.1 | 14.0 | 147.7 | 111.1 | 36.6 | 70.0 | 39.1 |
| 1990 | 614.7 | 145.0 | 469.6 | 207.7 | 20.8 | 241.1 | 177.0 | 64.2 | 108.6 | 71.4 |
| 1991 | 679.6 | 153.3 | 526.2 | 229.8 | 23.1 | 273.4 | 203.2 | 70.2 | 117.8 | 89.6 |
| 1992 | 740.7 | 161.8 | 578.9 | 250.6 | 24.7 | 303.6 | 230.5 | 73.0 | 132.7 | 101.5 |
| 1993 | 790.5 | 167.1 | 623.5 | 265.2 | 26.8 | 331.4 | 252.3 | 79.1 | 144.7 | 115.8 |
| 1994 | 834.0 | 168.5 | 665.5 | 274.5 | 28.9 | 362.0 | 275.7 | 86.3 | 162.6 | 126.9 |
| 1995 | 879.3 | 171.0 | 708.3 | 286.6 | 31.6 | 390.1 | 299.0 | 91.2 | 180.7 | 137.2 |
| 1996 | 924.0 | 178.1 | 745.9 | 299.8 | 33.5 | 412.6 | 319.8 | 92.8 | 194.9 | 146.3 |
| 1997 | 969.0 | 187.6 | 781.5 | 313.5 | 35.6 | 432.4 | 337.3 | 95.1 | 208.9 | 152.3 |
| Per Capita Amount | ||||||||||
| 1980 | $923 | $256 | $667 | $264 | $33 | $370 | $270 | $100 | (3) | (3) |
| 1985 | 1,523 | 407 | 1,116 | 462 | 57 | 598 | 449 | 148 | (3) | (3) |
| 1990 | 2,364 | 558 | 1,806 | 799 | 80 | 927 | 681 | 247 | (3) | (3) |
| 1991 | 2,586 | 584 | 2,003 | 875 | 88 | 1,040 | 773 | 267 | (3) | (3) |
| 1992 | 2,790 | 609 | 2,181 | 944 | 93 | 1,143 | 868 | 275 | (3) | (3) |
| 1993 | 2,947 | 623 | 2,325 | 989 | 100 | 1,236 | 941 | 295 | (3) | (3) |
| 1994 | 3,080 | 622 | 2,458 | 1,014 | 107 | 1,337 | 1,018 | 319 | (3) | (3) |
| 1995 | 3,218 | 626 | 2,592 | 1,049 | 116 | 1,428 | 1,094 | 334 | (3) | (3) |
| 1996 | 3,351 | 646 | 2,705 | 1,087 | 121 | 1,496 | 1,160 | 337 | (3) | (3) |
| 1997 | 3,482 | 674 | 2,808 | 1,126 | 128 | 1,554 | 1,212 | 342 | (3) | (3) |
| Percent Distribution | ||||||||||
| 1980 | 100.0 | 27.8 | 72.2 | 28.6 | 3.6 | 40.1 | 29.2 | 10.9 | 16.8 | 11.4 |
| 1985 | 100.0 | 26.7 | 73.3 | 30.3 | 3.7 | 39.2 | 29.5 | 9.7 | 18.6 | 10.4 |
| 1990 | 100.0 | 23.6 | 76.4 | 33.8 | 3.4 | 39.2 | 28.8 | 10.4 | 17.7 | 11.6 |
| 1991 | 100.0 | 22.6 | 77.4 | 33.8 | 3.4 | 40.2 | 29.9 | 10.3 | 17.3 | 13.2 |
| 1992 | 100.0 | 21.8 | 78.2 | 33.8 | 3.3 | 41.0 | 31.1 | 9.9 | 17.9 | 13.7 |
| 1993 | 100.0 | 21.1 | 78.9 | 33.6 | 3.4 | 41.9 | 31.9 | 10.0 | 18.3 | 14.6 |
| 1994 | 100.0 | 20.2 | 79.8 | 32.9 | 3.5 | 43.4 | 33.1 | 10.3 | 19.5 | 15.2 |
| 1995 | 100.0 | 19.4 | 80.6 | 32.6 | 3.6 | 44.4 | 34.0 | 10.4 | 20.6 | 15.6 |
| 1996 | 100.0 | 19.3 | 80.7 | 32.4 | 3.6 | 44.7 | 34.6 | 10.0 | 21.1 | 15.8 |
| 1997 | 100.0 | 19.4 | 80.6 | 32.3 | 3.7 | 44.6 | 34.8 | 9.8 | 21.6 | 15.7 |
Subset of Federal funds.
Subset of Federal and State and local funds.
Calculation of per capita estimates is inappropriate.
NOTES: Per capita amounts based on July 1 Social Security area population estimates for each year, 1980-97. Numbers and percents may not add to totals because of rounding.
SOURCE: Health Care Financing Administration, Office of the Actuary, National Health Statistics Group.
Table 8. Hospital Care Expenditures Aggregate and Per Capita Amounts and Percent Distribution, by Source of Funds: Selected Calendar Years 1980-97.
| Year | Total | Out-of-Pocket Payments | Third-Party Payments | Medicare1 | Medicaid2 | |||||
|---|---|---|---|---|---|---|---|---|---|---|
|
| ||||||||||
| Total | Private Health Insurance | Other Private Funds | Government | |||||||
|
| ||||||||||
| Total | Federal | State and Local | ||||||||
| Amount in Billions | ||||||||||
| 1980 | $102.7 | $5.3 | $97.4 | $36.5 | $5.0 | $55.9 | $42.1 | $13.7 | $26.4 | $10.6 |
| 1985 | 168.3 | 8.8 | 159.5 | 59.0 | 8.3 | 92.3 | 72.3 | 19.9 | 49.0 | 15.7 |
| 1990 | 256.4 | 11.1 | 245.4 | 95.6 | 10.2 | 139.6 | 105.4 | 34.2 | 68.7 | 29.4 |
| 1991 | 282.3 | 13.0 | 269.3 | 101.9 | 11.3 | 156.1 | 121.4 | 34.7 | 73.9 | 37.8 |
| 1992 | 305.3 | 13.7 | 291.6 | 107.2 | 11.6 | 172.8 | 138.7 | 34.1 | 84.0 | 42.4 |
| 1993 | 323.0 | 14.1 | 308.9 | 109.9 | 12.7 | 186.3 | 148.8 | 37.5 | 90.1 | 48.4 |
| 1994 | 335.7 | 12.7 | 323.1 | 108.6 | 13.7 | 200.8 | 159.9 | 40.9 | 99.7 | 52.8 |
| 1995 | 347.2 | 11.5 | 335.7 | 107.3 | 14.9 | 213.5 | 170.6 | 42.9 | 108.9 | 56.7 |
| 1996 | 360.8 | 11.8 | 348.9 | 110.0 | 16.1 | 222.8 | 179.6 | 43.2 | 116.3 | 59.0 |
| 1997 | 371.1 | 12.4 | 358.6 | 113.0 | 17.2 | 228.4 | 185.6 | 42.8 | 123.7 | 57.6 |
| Per Capita Amount | ||||||||||
| 1980 | $437 | $23 | $414 | $155 | $21 | $238 | $179 | $58 | (3) | (3) |
| 1985 | 681 | 36 | 645 | 239 | 33 | 373 | 293 | 81 | (3) | (3) |
| 1990 | 986 | 43 | 944 | 368 | 39 | 537 | 405 | 132 | (3) | (3) |
| 1991 | 1,074 | 49 | 1,025 | 388 | 43 | 594 | 462 | 132 | (3) | (3) |
| 1992 | 1,150 | 52 | 1,098 | 404 | 44 | 651 | 522 | 128 | (3) | (3) |
| 1993 | 1,204 | 52 | 1,152 | 410 | 47 | 695 | 554 | 140 | (3) | (3) |
| 1994 | 1,240 | 47 | 1,193 | 401 | 50 | 742 | 590 | 151 | (3) | (3) |
| 1995 | 1,271 | 43 | 1,229 | 393 | 54 | 781 | 624 | 157 | (3) | (3) |
| 1996 | 1,308 | 43 | 1,265 | 399 | 58 | 808 | 651 | 157 | (3) | (3) |
| 1997 | 1,333 | 45 | 1,289 | 406 | 61 | 821 | 667 | 154 | (3) | (3) |
| Percent Distribution | ||||||||||
| 1980 | 100.0 | 5.2 | 94.8 | 35.5 | 4.9 | 54.4 | 41.0 | 13.4 | 25.7 | 10.3 |
| 1985 | 100.0 | 5.2 | 94.8 | 35.0 | 4.9 | 54.8 | 43.0 | 11.9 | 29.1 | 9.3 |
| 1990 | 100.0 | 4.3 | 95.7 | 37.3 | 4.0 | 54.5 | 41.1 | 13.3 | 26.8 | 11.5 |
| 1991 | 100.0 | 4.6 | 95.4 | 36.1 | 4.0 | 55.3 | 43.0 | 12.3 | 26.2 | 13.4 |
| 1992 | 100.0 | 4.5 | 95.5 | 35.1 | 3.8 | 56.6 | 45.4 | 11.2 | 27.5 | 13.9 |
| 1993 | 100.0 | 4.4 | 95.6 | 34.0 | 3.9 | 57.7 | 46.1 | 11.6 | 27.9 | 15.0 |
| 1994 | 100.0 | 3.8 | 96.2 | 32.3 | 4.1 | 59.8 | 47.6 | 12.2 | 29.7 | 15.7 |
| 1995 | 100.0 | 3.3 | 96.7 | 30.9 | 4.3 | 61.5 | 49.1 | 12.4 | 31.4 | 16.3 |
| 1996 | 100.0 | 3.3 | 96.7 | 30.5 | 4.5 | 61.8 | 49.8 | 12.0 | 32.2 | 16.4 |
| 1997 | 100.0 | 3.3 | 96.7 | 30.5 | 4.6 | 61.6 | 50.0 | 11.5 | 33.3 | 15.5 |
Subset of Federal funds.
Subset of Federal and State and local funds.
Calculation of per capita estimates is inappropriate.
NOTES: Per capita amounts based on July 1 Social Security area population estimates for each year, 1980-97. Numbers and percents may not add to totals because of rounding.
SOURCE: Health Care Financing Administration, Office of the Actuary, National Health Statistics Group.
Table 9. Physician Service Expenditures Aggregate and Per Capita Amounts and Percent Distribution, by Source of Funds: Selected Calendar Years 1980-97.
| Year | Total | Out-of-Pocket Payments | Third-Party Payments | Medicare1 | Medicaid2 | |||||
|---|---|---|---|---|---|---|---|---|---|---|
|
| ||||||||||
| Total | Private Health Insurance | Other Private Funds | Government | |||||||
|
| ||||||||||
| Total | Federal | State and Local | ||||||||
| Amount in Billions | ||||||||||
| 1980 | $45.2 | $14.7 | $30.6 | $17.1 | $0.4 | $13.1 | $10.0 | $3.1 | $8.0 | $2.5 |
| 1985 | 83.6 | 24.4 | 59.2 | 33.5 | 1.4 | 24.3 | 19.4 | 4.9 | 16.3 | 3.5 |
| 1990 | 146.3 | 32.2 | 114.2 | 66.8 | 2.7 | 44.7 | 35.6 | 9.1 | 29.2 | 7.0 |
| 1991 | 162.2 | 33.3 | 128.9 | 77.2 | 2.9 | 48.8 | 38.2 | 10.6 | 30.5 | 9.1 |
| 1992 | 175.9 | 33.7 | 142.2 | 86.8 | 3.2 | 52.3 | 40.4 | 11.8 | 31.3 | 11.1 |
| 1993 | 185.9 | 33.0 | 153.0 | 94.1 | 3.3 | 55.5 | 43.4 | 12.1 | 33.2 | 12.7 |
| 1994 | 193.0 | 31.4 | 161.6 | 98.9 | 3.6 | 59.1 | 46.8 | 12.4 | 36.2 | 13.6 |
| 1995 | 201.9 | 30.0 | 171.8 | 104.4 | 4.2 | 63.2 | 50.9 | 12.4 | 39.9 | 14.4 |
| 1996 | 208.5 | 31.1 | 177.4 | 106.9 | 4.3 | 66.2 | 54.4 | 11.8 | 42.8 | 15.2 |
| 1997 | 217.6 | 34.1 | 183.6 | 109.1 | 4.3 | 70.1 | 58.4 | 11.7 | 46.4 | 15.7 |
| Per Capita Amount | ||||||||||
| 1980 | $192 | $62 | $130 | $73 | $2 | $56 | $43 | $13 | (3) | (3) |
| 1985 | 338 | 99 | 239 | 136 | 6 | 98 | 79 | 20 | (3) | (3) |
| 1990 | 563 | 124 | 439 | 257 | 10 | 172 | 137 | 35 | (3) | (3) |
| 1991 | 617 | 127 | 490 | 294 | 11 | 186 | 146 | 40 | (3) | (3) |
| 1992 | 663 | 127 | 536 | 327 | 12 | 197 | 152 | 45 | (3) | (3) |
| 1993 | 693 | 123 | 570 | 351 | 12 | 207 | 162 | 45 | (3) | (3) |
| 1994 | 713 | 116 | 597 | 365 | 13 | 218 | 173 | 46 | (3) | (3) |
| 1995 | 739 | 110 | 629 | 382 | 15 | 231 | 186 | 45 | (3) | (3) |
| 1996 | 756 | 113 | 643 | 388 | 15 | 240 | 197 | 43 | (3) | (3) |
| 1997 | 782 | 122 | 660 | 392 | 15 | 252 | 210 | 42 | (3) | (3) |
| Percent Distribution | ||||||||||
| 1980 | 100.0 | 32.4 | 67.6 | 37.9 | 0.8 | 28.9 | 22.1 | 6.8 | 17.6 | 5.5 |
| 1985 | 100.0 | 29.2 | 70.8 | 40.1 | 1.6 | 29.1 | 23.2 | 5.9 | 19.5 | 4.2 |
| 1990 | 100.0 | 22.0 | 78.0 | 45.7 | 1.8 | 30.5 | 24.3 | 6.2 | 20.0 | 4.8 |
| 1991 | 100.0 | 20.5 | 79.5 | 47.6 | 1.8 | 30.1 | 23.6 | 6.5 | 18.8 | 5.6 |
| 1992 | 100.0 | 19.2 | 80.8 | 49.3 | 1.8 | 29.7 | 23.0 | 6.7 | 17.8 | 6.3 |
| 1993 | 100.0 | 17.7 | 82.3 | 50.6 | 1.8 | 29.9 | 23.4 | 6.5 | 17.9 | 6.8 |
| 1994 | 100.0 | 16.3 | 83.7 | 51.3 | 1.9 | 30.6 | 24.2 | 6.4 | 18.8 | 7.0 |
| 1995 | 100.0 | 14.9 | 85.1 | 51.7 | 2.1 | 31.3 | 25.2 | 6.1 | 19.8 | 7.2 |
| 1996 | 100.0 | 14.9 | 85.1 | 51.3 | 2.0 | 31.8 | 26.1 | 5.7 | 20.5 | 7.3 |
| 1997 | 100.0 | 15.7 | 84.3 | 50.2 | 2.0 | 32.2 | 26.8 | 5.4 | 21.3 | 7.2 |
Subset of Federal funds.
Subset of Federal and State and local funds.
Calculation of per capita estimates is inappropriate.
NOTES: Per capita amounts based on July 1 Social Security area population estimates for each year, 1980-97. Numbers and percents may not add to totals because of rounding.
SOURCE: Health Care Financing Administration, Office of the Actuary, National Health Statistics Group.
Table 10. Nursing Home Care Expenditures Aggregate and Per Capita Amounts and Percent Distribution, by Source of Funds: Selected Calendar Years 1980-97.
| Year | Total | Out-of-Pocket Payments | Third-Party Payments | Medicare1 | Medicaid2 | |||||
|---|---|---|---|---|---|---|---|---|---|---|
|
| ||||||||||
| Total | Private Health Insurance | Other Private Funds | Government | |||||||
|
| ||||||||||
| Total | Federal | State and Local | ||||||||
| Amount in Billions | ||||||||||
| 1980 | $17.6 | $7.4 | $10.3 | $0.2 | $0.5 | $9.5 | $5.6 | $3.9 | $0.3 | $8.8 |
| 1985 | 30.7 | 13.6 | 17.1 | 0.8 | 0.6 | 15.7 | 9.2 | 6.5 | 0.5 | 14.5 |
| 1990 | 50.9 | 21.9 | 29.0 | 2.1 | 0.9 | 25.9 | 15.8 | 10.2 | 1.7 | 23.1 |
| 1991 | 57.2 | 23.1 | 34.1 | 2.4 | 1.1 | 30.6 | 18.4 | 12.3 | 1.9 | 27.5 |
| 1992 | 62.3 | 24.1 | 38.2 | 2.6 | 1.2 | 34.4 | 21.2 | 13.2 | 2.9 | 30.2 |
| 1993 | 66.4 | 24.5 | 41.9 | 2.8 | 1.2 | 37.9 | 24.0 | 13.9 | 3.9 | 32.4 |
| 1994 | 71.1 | 25.3 | 45.8 | 3.0 | 1.3 | 41.4 | 26.5 | 14.9 | 5.5 | 34.3 |
| 1995 | 75.5 | 26.6 | 48.8 | 3.4 | 1.4 | 44.0 | 28.4 | 15.6 | 6.7 | 35.6 |
| 1996 | 79.4 | 26.7 | 52.7 | 3.7 | 1.5 | 47.4 | 31.3 | 16.2 | 8.0 | 37.6 |
| 1997 | 82.8 | 25.7 | 57.0 | 4.0 | 1.6 | 51.4 | 34.5 | 16.9 | 10.1 | 39.4 |
| Per Capita Amount | ||||||||||
| 1980 | $75 | $31 | $44 | $1 | $2 | $41 | $24 | $17 | (3) | (3) |
| 1985 | 124 | 55 | 69 | 3 | 2 | 64 | 37 | 26 | (3) | (3) |
| 1990 | 196 | 84 | 111 | 8 | 4 | 100 | 61 | 39 | (3) | (3) |
| 1991 | 218 | 88 | 130 | 9 | 4 | 117 | 70 | 47 | (3) | (3) |
| 1992 | 235 | 91 | 144 | 10 | 4 | 130 | 80 | 50 | (3) | (3) |
| 1993 | 248 | 91 | 156 | 10 | 5 | 141 | 90 | 52 | (3) | (3) |
| 1994 | 263 | 93 | 169 | 11 | 5 | 153 | 98 | 55 | (3) | (3) |
| 1995 | 276 | 97 | 179 | 12 | 5 | 161 | 104 | 57 | (3) | (3) |
| 1996 | 288 | 97 | 191 | 14 | 5 | 172 | 113 | 59 | (3) | (3) |
| 1997 | 297 | 92 | 205 | 14 | 6 | 185 | 124 | 61 | (3) | (3) |
| Percent Distribution | ||||||||||
| 1980 | 100.0 | 41.8 | 58.2 | 1.2 | 3.0 | 54.0 | 31.8 | 22.2 | 1.7 | 50.0 |
| 1985 | 100.0 | 44.3 | 55.7 | 2.7 | 1.8 | 51.2 | 29.9 | 21.2 | 1.5 | 47.2 |
| 1990 | 100.0 | 43.1 | 56.9 | 4.1 | 1.8 | 51.0 | 31.0 | 20.0 | 3.4 | 45.4 |
| 1991 | 100.0 | 40.4 | 59.6 | 4.2 | 1.8 | 53.6 | 32.1 | 21.5 | 3.4 | 48.1 |
| 1992 | 100.0 | 38.7 | 61.3 | 4.2 | 1.9 | 55.2 | 34.1 | 21.2 | 4.6 | 48.5 |
| 1993 | 100.0 | 36.9 | 63.1 | 4.2 | 1.8 | 57.0 | 36.2 | 20.9 | 5.9 | 48.8 |
| 1994 | 100.0 | 35.6 | 64.4 | 4.3 | 1.9 | 58.3 | 37.3 | 21.0 | 7.8 | 48.2 |
| 1995 | 100.0 | 35.3 | 64.7 | 4.5 | 1.9 | 58.3 | 37.6 | 20.7 | 8.9 | 47.1 |
| 1996 | 100.0 | 33.6 | 66.4 | 4.7 | 1.9 | 59.8 | 39.4 | 20.4 | 10.1 | 47.4 |
| 1997 | 100.0 | 31.1 | 68.9 | 4.9 | 1.9 | 62.2 | 41.7 | 20.4 | 12.3 | 47.6 |
Subset of Federal funds.
Subset of Federal and State and local funds.
Calculation of per capita estimates is inappropriate.
NOTES: Per capita amounts based on July 1 Social Security area population estimates for each year, 1980-97. Numbers and percents may not add to totals because of rounding.
SOURCE: Health Care Financing Administration, Office of the Actuary, National Health Statistics Group.
Table 11. Other Personal Health Care Expenditures1 Aggregate and Per Capita Amounts and Percent Distribution, by Source of Funds: Selected Calendar Years 1980-97.
| Year | Total | Out-of-Pocket Payments | Third-Party Payments | Medicare2 | Medicaid3 | |||||
|---|---|---|---|---|---|---|---|---|---|---|
|
| ||||||||||
| Total | Private Health Insurance | Other Private Funds | Government | |||||||
|
| ||||||||||
| Total | Federal | State and Local | ||||||||
| Amount in Billions | ||||||||||
| 1980 | $51.5 | $32.9 | $18.6 | $8.2 | $1.9 | $8.5 | $5.6 | $2.8 | $1.7 | $2.8 |
| 1985 | 93.9 | 53.8 | 40.0 | 20.8 | 3.8 | 15.4 | 10.2 | 5.3 | 4.3 | 5.3 |
| 1990 | 161.0 | 79.9 | 81.1 | 43.2 | 7.0 | 30.9 | 20.2 | 10.7 | 8.9 | 11.8 |
| 1991 | 178.0 | 84.0 | 94.0 | 48.4 | 7.8 | 37.8 | 25.2 | 12.6 | 11.6 | 15.2 |
| 1992 | 197.2 | 90.3 | 106.9 | 54.1 | 8.7 | 44.1 | 30.1 | 13.9 | 14.5 | 17.8 |
| 1993 | 215.1 | 95.5 | 119.7 | 58.4 | 9.6 | 51.7 | 36.0 | 15.7 | 17.5 | 22.2 |
| 1994 | 234.2 | 99.2 | 135.0 | 64.0 | 10.3 | 60.6 | 42.6 | 18.0 | 21.2 | 26.2 |
| 1995 | 254.8 | 102.8 | 152.0 | 71.5 | 11.1 | 69.3 | 49.1 | 20.2 | 25.2 | 30.5 |
| 1996 | 275.3 | 108.4 | 166.9 | 79.1 | 11.6 | 76.1 | 54.5 | 21.6 | 27.8 | 34.5 |
| 1997 | 297.5 | 115.3 | 182.2 | 87.3 | 12.6 | 82.4 | 58.7 | 23.7 | 28.6 | 39.6 |
| Per Capita Amount | ||||||||||
| 1980 | $219 | $140 | $79 | $35 | $8 | $36 | $24 | $12 | (4) | (4) |
| 1985 | 380 | 218 | 162 | 84 | 15 | 62 | 41 | 21 | (4) | (4) |
| 1990 | 619 | 307 | 312 | 166 | 27 | 119 | 78 | 41 | (4) | (4) |
| 1991 | 677 | 320 | 358 | 184 | 30 | 144 | 96 | 48 | (4) | (4) |
| 1992 | 743 | 340 | 403 | 204 | 33 | 166 | 114 | 53 | (4) | (4) |
| 1993 | 802 | 356 | 446 | 218 | 36 | 193 | 134 | 58 | (4) | (4) |
| 1994 | 865 | 366 | 498 | 236 | 38 | 224 | 157 | 67 | (4) | (4) |
| 1995 | 932 | 376 | 556 | 262 | 41 | 254 | 180 | 74 | (4) | (4) |
| 1996 | 998 | 393 | 605 | 287 | 42 | 276 | 198 | 78 | (4) | (4) |
| 1997 | 1,069 | 414 | 655 | 314 | 45 | 296 | 211 | 85 | (4) | (4) |
| Percent Distribution | ||||||||||
| 1980 | 100.0 | 63.9 | 36.1 | 15.9 | 3.6 | 16.5 | 11.0 | 5.5 | 3.2 | 5.5 |
| 1985 | 100.0 | 57.3 | 42.7 | 22.2 | 4.1 | 16.4 | 10.8 | 5.6 | 4.6 | 5.7 |
| 1990 | 100.0 | 49.6 | 50.4 | 26.9 | 4.3 | 19.2 | 12.5 | 6.6 | 5.5 | 7.3 |
| 1991 | 100.0 | 47.2 | 52.8 | 27.2 | 4.4 | 21.3 | 14.2 | 7.1 | 6.5 | 8.6 |
| 1992 | 100.0 | 45.8 | 54.2 | 27.4 | 4.4 | 22.4 | 15.3 | 7.1 | 7.4 | 9.0 |
| 1993 | 100.0 | 44.4 | 55.6 | 27.1 | 4.5 | 24.0 | 16.7 | 7.3 | 8.1 | 10.3 |
| 1994 | 100.0 | 42.4 | 57.6 | 27.3 | 4.4 | 25.9 | 18.2 | 7.7 | 9.0 | 11.2 |
| 1995 | 100.0 | 40.4 | 59.6 | 28.1 | 4.4 | 27.2 | 19.3 | 7.9 | 9.9 | 12.0 |
| 1996 | 100.0 | 39.4 | 60.6 | 28.7 | 4.2 | 27.6 | 19.8 | 7.9 | 10.1 | 12.5 |
| 1997 | 100.0 | 38.8 | 61.2 | 29.3 | 4.2 | 27.7 | 19.7 | 8.0 | 9.6 | 13.3 |
Personal health care expenditures other than those for hospital care, physician services, and nursing home care.
Subset of Federal funds.
Subset of Federal and State and local funds.
Calculation of per capita estimates is inappropriate.
NOTES: Per capita amounts based on July 1 Social Security area population estimates for each year, 1980-97. Numbers and percents may not add to totals because of rounding.
SOURCE: Health Care Financing Administration, Office of the Actuary, National Health Statistics Group.
Table 12. Personal Health Care Expenditures, by Type of Expenditure and Source of Funds: Calendar Years 1990-97.
| Source of Funds | Total | Hospital Care | Physician Services | Dental Services | Other Professional Services | Home Health Care | Drugs and Other Medical Non-Durables | Vision Products and Other Medical Durables | Nursing Home Care | Other Personal Health Care | |
|---|---|---|---|---|---|---|---|---|---|---|---|
|
| |||||||||||
| Amount in Billions | |||||||||||
| 1990 | |||||||||||
| Personal Health Care Expenditures | $614.7 | $256.4 | $146.3 | $31.6 | $34.7 | $13.1 | $59.9 | $10.5 | $50.9 | $11.2 | |
| Out-of-Pocket Payments | 145.0 | 11.1 | 32.2 | 15.4 | 13.7 | 3.6 | 40.4 | 6.7 | 21.9 | — | |
| Third-Party Payments | 469.6 | 245.4 | 114.2 | 16.2 | 21.0 | 9.5 | 19.5 | 3.7 | 29.0 | 11.2 | |
| Private Health Insurance | 207.7 | 95.6 | 66.8 | 15.1 | 12.0 | 2.2 | 13.0 | 0.8 | 2.1 | — | |
| Other Private | 20.8 | 10.2 | 2.7 | 0.1 | 2.5 | 2.2 | — | — | 0.9 | 2.2 | |
| Government | 241.1 | 139.6 | 44.7 | 0.9 | 6.5 | 5.1 | 6.5 | 2.9 | 25.9 | 9.0 | |
| Federal | 177.0 | 105.4 | 35.6 | 0.5 | 4.3 | 4.1 | 3.1 | 2.7 | 15.8 | 5.4 | |
| Medicare | 108.6 | 68.7 | 29.2 | 0.0 | 3.3 | 3.0 | 0.1 | 2.5 | 1.7 | — | |
| Medicaid | 40.4 | 16.6 | 4.1 | 0.4 | 0.3 | 1.1 | 2.9 | — | 13.0 | 2.0 | |
| Other | 28.0 | 20.1 | 2.2 | 0.1 | 0.7 | — | 0.1 | 0.2 | 1.0 | 3.5 | |
| State and Local | 64.2 | 34.2 | 9.1 | 0.4 | 2.2 | 1.0 | 3.4 | 0.1 | 10.2 | 3.6 | |
| Medicaid | 31.0 | 12.9 | 2.9 | 0.3 | 0.2 | 1.0 | 2.1 | — | 10.1 | 1.5 | |
| Other | 33.1 | 21.4 | 6.2 | 0.1 | 2.0 | 0.0 | 1.2 | 0.1 | 0.1 | 2.1 | |
| 1991 | |||||||||||
| Personal Health Care Expenditures | 679.6 | 282.3 | 162.2 | 33.3 | 38.3 | 16.1 | 65.6 | 11.2 | 57.2 | 13.6 | |
| Out-of-Pocket Payments | 153.3 | 13.0 | 33.3 | 16.1 | 14.0 | 4.3 | 42.7 | 6.9 | 23.1 | — | |
| Third-Party Payments | 526.2 | 269.3 | 128.9 | 17.2 | 24.3 | 11.7 | 22.9 | 4.3 | 34.1 | 13.6 | |
| Private Health Insurance | 229.8 | 101.9 | 77.2 | 16.0 | 13.9 | 2.5 | 15.2 | 0.8 | 2.4 | — | |
| Other Private | 23.1 | 11.3 | 2.9 | 0.1 | 2.7 | 2.5 | — | — | 1.1 | 2.4 | |
| Government | 273.4 | 156.1 | 48.8 | 1.1 | 7.7 | 6.7 | 7.7 | 3.5 | 30.6 | 11.1 | |
| Federal | 203.2 | 121.4 | 38.2 | 0.6 | 5.2 | 5.5 | 3.8 | 3.3 | 18.4 | 6.7 | |
| Medicare | 117.8 | 73.9 | 30.5 | 0.0 | 4.1 | 4.2 | 0.1 | 3.1 | 1.9 | — | |
| Medicaid | 54.3 | 25.2 | 5.3 | 0.5 | 0.3 | 1.3 | 3.5 | — | 15.3 | 2.9 | |
| Other | 31.0 | 22.2 | 2.5 | 0.1 | 0.8 | — | 0.1 | 0.2 | 1.2 | 3.9 | |
| State and Local | 70.2 | 34.7 | 10.6 | 0.5 | 2.5 | 1.2 | 3.9 | 0.1 | 12.3 | 4.4 | |
| Medicaid | 35.3 | 12.5 | 3.8 | 0.4 | 0.3 | 1.2 | 2.7 | — | 12.2 | 2.2 | |
| Other | 34.9 | 22.2 | 6.7 | 0.1 | 2.2 | 0.0 | 1.3 | 0.1 | 0.1 | 2.2 | |
| 1992 | |||||||||||
| Personal Health Care Expenditures | 740.7 | 305.3 | 175.9 | 37.0 | 42.1 | 19.6 | 71.2 | 11.9 | 62.3 | 15.4 | |
| Out-of-Pocket Payments | 161.8 | 13.7 | 33.7 | 17.8 | 15.2 | 5.0 | 45.0 | 7.3 | 24.1 | — | |
| Third-Party Payments | 578.9 | 291.6 | 142.2 | 19.3 | 26.9 | 14.6 | 26.2 | 4.6 | 38.2 | 15.4 | |
| Private Health Insurance | 250.6 | 107.2 | 86.8 | 17.7 | 14.8 | 2.9 | 17.9 | 0.7 | 2.6 | — | |
| Other Private | 24.7 | 11.6 | 3.2 | 0.1 | 3.0 | 2.9 | — | — | 1.2 | 2.6 | |
| Government | 303.6 | 172.8 | 52.3 | 1.4 | 9.0 | 8.8 | 8.3 | 3.9 | 34.4 | 12.7 | |
| Federal | 230.5 | 138.7 | 40.4 | 0.8 | 6.3 | 7.4 | 4.2 | 3.8 | 21.2 | 7.8 | |
| Medicare | 132.7 | 84.0 | 31.3 | 0.0 | 5.0 | 5.9 | 0.1 | 3.5 | 2.9 | — | |
| Medicaid | 65.4 | 31.5 | 6.6 | 0.7 | 0.4 | 1.5 | 3.9 | — | 17.1 | 3.7 | |
| Other | 32.4 | 23.2 | 2.5 | 0.1 | 0.9 | — | 0.2 | 0.2 | 1.3 | 4.1 | |
| State and Local | 73.0 | 34.1 | 11.8 | 0.6 | 2.7 | 1.4 | 4.1 | 0.1 | 13.2 | 5.0 | |
| Medicaid | 36.2 | 10.9 | 4.5 | 0.5 | 0.3 | 1.3 | 2.8 | — | 13.1 | 2.7 | |
| Other | 36.9 | 23.2 | 7.3 | 0.1 | 2.4 | 0.1 | 1.3 | 0.1 | 0.1 | 2.3 | |
| 1993 | |||||||||||
| Personal Health Care Expenditures | $790.5 | $323.0 | $185.9 | $39.5 | $46.1 | $23.0 | $76.2 | $12.3 | $66.4 | $18.0 | |
| Out-of-Pocket Payments | 167.1 | 14.1 | 33.0 | 18.8 | 17.0 | 5.6 | 46.8 | 7.3 | 24.5 | — | |
| Third-Party Payments | 623.5 | 308.9 | 153.0 | 20.7 | 29.1 | 17.4 | 29.5 | 5.0 | 41.9 | 18.0 | |
| Private Health Insurance | 265.2 | 109.9 | 94.1 | 18.7 | 15.8 | 3.1 | 20.1 | 0.7 | 2.8 | — | |
| Other Private | 26.8 | 12.7 | 3.3 | 0.2 | 3.4 | 3.2 | — | — | 1.2 | 2.8 | |
| Government | 331.4 | 186.3 | 55.5 | 1.9 | 9.9 | 11.1 | 9.3 | 4.3 | 37.9 | 15.1 | |
| Federal | 252.3 | 148.8 | 43.4 | 1.1 | 7.1 | 9.5 | 4.9 | 4.2 | 24.0 | 9.2 | |
| Medicare | 144.7 | 90.1 | 33.2 | 0.0 | 5.7 | 7.7 | 0.2 | 3.9 | 3.9 | — | |
| Medicaid | 73.5 | 34.3 | 7.7 | 1.0 | 0.6 | 1.8 | 4.6 | — | 18.7 | 5.0 | |
| Other | 34.1 | 24.4 | 2.6 | 0.1 | 0.9 | — | 0.2 | 0.3 | 1.4 | 4.2 | |
| State and Local | 79.1 | 37.5 | 12.1 | 0.8 | 2.8 | 1.5 | 4.4 | 0.1 | 13.9 | 5.9 | |
| Medicaid | 42.2 | 14.1 | 5.0 | 0.7 | 0.5 | 1.5 | 3.2 | — | 13.8 | 3.5 | |
| Other | 36.7 | 23.4 | 7.0 | 0.1 | 2.4 | 0.1 | 1.3 | 0.1 | 0.1 | 2.4 | |
| 1994 | |||||||||||
| Personal Health Care Expenditures | 834.0 | 335.7 | 193.0 | 42.4 | 49.6 | 26.2 | 81.6 | 12.5 | 71.1 | 21.9 | |
| Out-of-Pocket Payments | 168.5 | 12.7 | 31.4 | 20.0 | 18.3 | 5.9 | 47.8 | 7.2 | 25.3 | — | |
| Third-Party Payments | 665.5 | 323.1 | 161.6 | 22.4 | 31.3 | 20.3 | 33.8 | 5.3 | 45.8 | 21.9 | |
| Private Health Insurance | 274.5 | 108.6 | 98.9 | 20.2 | 16.4 | 3.3 | 23.5 | 0.6 | 3.0 | — | |
| Other Private | 28.9 | 13.7 | 3.6 | 0.2 | 3.7 | 3.4 | — | — | 1.3 | 3.1 | |
| Government | 362.0 | 200.8 | 59.1 | 2.0 | 11.1 | 13.7 | 10.4 | 4.6 | 41.4 | 18.8 | |
| Federal | 275.7 | 159.9 | 46.8 | 1.1 | 8.3 | 11.9 | 5.4 | 4.5 | 26.5 | 11.3 | |
| Medicare | 162.6 | 99.7 | 36.2 | 0.0 | 6.7 | 10.0 | 0.3 | 4.2 | 5.5 | — | |
| Medicaid | 77.7 | 35.3 | 8.1 | 1.0 | 0.6 | 1.9 | 5.0 | — | 19.4 | 6.5 | |
| Other | 35.4 | 24.9 | 2.5 | 0.1 | 0.9 | — | 0.2 | 0.3 | 1.5 | 4.9 | |
| State and Local | 86.3 | 40.9 | 12.4 | 0.9 | 2.8 | 1.8 | 4.9 | 0.1 | 14.9 | 7.5 | |
| Medicaid | 49.2 | 17.6 | 5.5 | 0.8 | 0.5 | 1.7 | 3.6 | — | 14.8 | 4.8 | |
| Other | 37.0 | 23.4 | 6.8 | 0.1 | 2.4 | 0.1 | 1.3 | 0.1 | 0.1 | 2.7 | |
| 1995 | |||||||||||
| Personal Health Care Expenditures | 879.3 | 347.2 | 201.9 | 45.0 | 53.6 | 29.1 | 88.9 | 13.1 | 75.5 | 25.1 | |
| Out-of-Pocket Payments | 171.0 | 11.5 | 30.0 | 21.1 | 19.9 | 6.2 | 48.6 | 7.1 | 26.6 | — | |
| Third-Party Payments | 708.3 | 335.7 | 171.8 | 23.9 | 33.7 | 22.9 | 40.4 | 6.0 | 48.8 | 25.1 | |
| Private Health Insurance | 286.6 | 107.3 | 104.4 | 21.7 | 17.2 | 3.4 | 28.6 | 0.6 | 3.4 | — | |
| Other Private | 31.6 | 14.9 | 4.2 | 0.2 | 4.1 | 3.5 | — | — | 1.4 | 3.3 | |
| Government | 390.1 | 213.5 | 63.2 | 2.0 | 12.4 | 16.0 | 11.7 | 5.4 | 44.0 | 21.8 | |
| Federal | 299.0 | 170.6 | 50.9 | 1.1 | 9.5 | 14.0 | 6.3 | 5.3 | 28.4 | 12.8 | |
| Medicare | 180.7 | 108.9 | 39.9 | 0.0 | 7.8 | 11.9 | 0.4 | 5.0 | 6.7 | — | |
| Medicaid | 82.0 | 36.2 | 8.5 | 1.0 | 0.8 | 2.1 | 5.6 | — | 20.1 | 7.9 | |
| Other | 36.2 | 25.4 | 2.5 | 0.1 | 1.0 | — | 0.3 | 0.3 | 1.6 | 5.0 | |
| State and Local | 91.2 | 42.9 | 12.4 | 0.9 | 2.9 | 1.9 | 5.4 | 0.1 | 15.6 | 9.0 | |
| Medicaid | 55.2 | 20.5 | 6.0 | 0.8 | 0.6 | 1.8 | 4.1 | — | 15.5 | 6.0 | |
| Other | 36.0 | 22.4 | 6.4 | 0.1 | 2.3 | 0.1 | 1.4 | 0.1 | 0.1 | 3.0 | |
| 1996 | |||||||||||
| Personal Health Care Expenditures | $924.0 | $360.8 | $208.5 | $47.5 | $57.5 | $31.2 | $98.3 | $13.4 | $79.4 | $27.4 | |
| Out-of-Pocket Payments | 178.1 | 11.8 | 31.1 | 22.1 | 21.9 | 6.5 | 51.0 | 6.9 | 26.7 | — | |
| Third-Party Payments | 745.9 | 348.9 | 177.4 | 25.5 | 35.5 | 24.7 | 47.3 | 6.5 | 52.7 | 27.4 | |
| Private Health Insurance | 299.8 | 110.0 | 106.9 | 23.2 | 18.0 | 3.5 | 33.9 | 0.6 | 3.7 | — | |
| Other Private | 33.5 | 16.1 | 4.3 | 0.2 | 4.3 | 3.7 | — | — | 1.5 | 3.4 | |
| Government | 412.6 | 222.8 | 66.2 | 2.1 | 13.2 | 17.5 | 13.4 | 5.9 | 47.4 | 24.0 | |
| Federal | 319.8 | 179.6 | 54.4 | 1.2 | 10.4 | 15.5 | 7.5 | 5.8 | 31.3 | 14.1 | |
| Medicare | 194.9 | 116.3 | 42.8 | 0.1 | 8.4 | 13.2 | 0.7 | 5.4 | 8.0 | — | |
| Medicaid | 88.0 | 37.4 | 9.1 | 1.0 | 0.9 | 2.3 | 6.5 | — | 21.6 | 9.2 | |
| Other | 37.0 | 25.9 | 2.6 | 0.2 | 1.0 | — | 0.3 | 0.3 | 1.7 | 5.0 | |
| State and Local | 92.8 | 43.2 | 11.8 | 0.9 | 2.8 | 2.0 | 5.9 | 0.1 | 16.2 | 9.9 | |
| Medicaid | 58.4 | 21.6 | 6.1 | 0.8 | 0.7 | 1.9 | 4.6 | — | 16.0 | 6.7 | |
| Other | 34.5 | 21.6 | 5.7 | 0.1 | 2.2 | 0.1 | 1.3 | 0.1 | 0.1 | 3.2 | |
| 1997 | |||||||||||
| Personal Health Care Expenditures | 969.0 | 371.1 | 217.6 | 50.6 | 61.9 | 32.3 | 108.9 | 13.9 | 82.8 | 29.9 | |
| Out-of-Pocket Payments | 187.6 | 12.4 | 34.1 | 23.9 | 24.6 | 7.0 | 53.0 | 6.8 | 25.7 | — | |
| Third-Party Payments | 781.5 | 358.6 | 183.6 | 26.8 | 37.3 | 25.3 | 55.9 | 7.1 | 57.0 | 29.9 | |
| Private Health Insurance | 313.5 | 113.0 | 109.1 | 24.3 | 18.9 | 3.7 | 39.9 | 0.5 | 4.0 | — | |
| Other Private | 35.6 | 17.2 | 4.3 | 0.2 | 4.8 | 3.9 | — | — | 1.6 | 3.6 | |
| Government | 432.4 | 228.4 | 70.1 | 2.3 | 13.6 | 17.7 | 16.0 | 6.6 | 51.4 | 26.3 | |
| Federal | 337.3 | 185.6 | 58.4 | 1.3 | 10.8 | 15.4 | 9.2 | 6.4 | 34.5 | 15.6 | |
| Medicare | 208.9 | 123.7 | 46.4 | 0.1 | 8.8 | 12.8 | 1.0 | 6.0 | 10.1 | — | |
| Medicaid | 91.1 | 36.2 | 9.3 | 1.1 | 1.0 | 2.6 | 7.8 | — | 22.6 | 10.4 | |
| Other | 37.3 | 25.7 | 2.7 | 0.1 | 1.1 | — | 0.4 | 0.4 | 1.7 | 5.1 | |
| State and Local | 95.1 | 42.8 | 11.7 | 1.0 | 2.8 | 2.3 | 6.8 | 0.1 | 16.9 | 10.7 | |
| Medicaid | 61.2 | 21.4 | 6.4 | 0.9 | 0.7 | 2.1 | 5.5 | — | 16.8 | 7.5 | |
| Other | 33.9 | 21.4 | 5.3 | 0.1 | 2.1 | 0.1 | 1.4 | 0.1 | 0.1 | 3.3 | |
NOTES: The figure 0.0 denotes amounts less than $50 million. Medicaid expenditures exclude Part B premium payments to Medicare by States under buy-in agreements to cover premiums for eligible Medicaid recipients. Numbers may not add to totals because of rounding.
SOURCE: Health Care Financing Administration, Office of the Actuary, National Health Statistics Group.
Acknowledgments
This article was prepared under the direction of Katharine R. Levit, Director, National Health Statistics Group, Office of the Actuary. We wish to thank our collegues Richard Foster, Mark Freeland, Sharman Stephens, Patricia Unurh, and Carter Warfield for their review and comments on this article during preparation.
Footnotes
This article is dedicated to the memory of our friend and colleague, Bradley R. Braden (May 12, 1961 December 17, 1998). Brad's dedication to quality and continuous improvement has substantially enhanced our ability to estimate, analyze, and report national health spending.
The authors are with the Health Care Financing Administration, Office of the Actuary. The opinions expressed herein are those of the authors and do not necessarily reflect the views of the Health Care Financing Administration (HCFA).
Insurance premiums paid by consumers are not included as out-of-pocket expenditures but rather as PHI expenditures.
Reprint Requests: Office of the Actuary, National Health Statistics Group, Health Care Financing Administration, 7500 Security Boulevard, N3-02-02, Baltimore, Maryland 21244-1850.
References
- American Hospital Association. National Hospital Panel Survey. Chicago: 1997. Unpublished. [Google Scholar]
- Baker C, Kramer N. Employer Benefits Survey: A BLS Reader. Washington, DC.: U.S. Government Printing Office; Feb, 1995. Employer-Sponsored Prescription Drug Benefits. U.S. Department of Labor, Bureau of Labor Statistics. Bulletin 2459. [Google Scholar]
- Express Scripts Online. Express Scripts/ValueRx Report Identifies Reasons for the Rapid Increase in Pharmacy Expenses-1997 Drug Trend Report Analyzes Prescription Drug Costs and Trends. 1998 Sep; Internet address: http://www.expressscripts.com/esi/news/trends97asp.
- Gebhart F. Annual Rx Survey: The New Golden Age. Drug Topics. 1998 Mar 16;:71. [Google Scholar]
- Holahan J, Liska D. The Slowdown in Medicaid Spending Growth: Will it Continue? Health Affairs. 1997 Mar-Apr;16(2):157–163. doi: 10.1377/hlthaff.16.2.157. [DOI] [PubMed] [Google Scholar]
- IMS America. Data from the National Prescription Audit. Plymouth Meeting, PA.: 1998. [Google Scholar]
- Kane C, Emmons DW, Wozniak GD. Socioeconomic Characteristics of Medical Practice 1997/98. Chicago: American Medical Association; Jun, 1998. Physicians Managed Care Contracting. [Google Scholar]
- KPMG Peat Marwick. Health Benefits in 1997. Newark, NJ.: 1997. [Google Scholar]
- Miller RS, Dunn MR, Richter TH, Whitcomb ME. Employment-Seeking Experiences of Resident Physicians Completing Training During 1996. Journal of the American Medical Association. 1998 Sep 2;280(9):777–783. doi: 10.1001/jama.280.9.777. [DOI] [PubMed] [Google Scholar]
- Novartis. Pharmacy Benefit Report: Facts & Figures. New Jersey: 1997. [Google Scholar]
- Rice D, Cooper B, Gibson R. U.S. national health accounts: Historical perspectives, current issues, and future projections. In: Levy E, editor. La Santé Fait Ses Cômptes (Accounting for Health) Paris: Economica; 1982. [Google Scholar]
- Schneider A. Overview of Medicaid Provisions in the Balance Budget Act of 1997, P.L. 105-33. The Center on Budget and Policy Priorities. The Center on Budget and Policy Priorities World Wide Web site. 1998 Internet address: http://www.cbpp.org.
- Smith S, Freeland M, Heffler S, et al. The Next Ten Years Of Health Spending: What Does the Future Hold? Health Affairs. 1998 Sep-Oct;17(5):125–140. doi: 10.1377/hlthaff.17.5.128. [DOI] [PubMed] [Google Scholar]
- U.S. General Accounting Office. Medicaid: Sustainability of Low 1996 Spending Growth Is Uncertain. Washington, DC.: Jun, 1997. Report to the Chairman, Committee on the Budget U.S. Senate, and to the Chairman, Committee on the Budget, House of Representatives. Publication Number GAO/THEHE-97-128. [Google Scholar]
- Tanner L. Recruiters target more specialists, survey says. Dallas Business Journal Web site. 1998 Aug 27; Internet address: http://www.amcity.com/dallas/stories/082498/newscolumn6.html.
- Tanouye E. Managed Care Is Boosting Drug Sales. The Wall Street Journal. 1996 Oct 17;:B10. [Google Scholar]


