

Abstract
AIM: To evaluate the correlation between liver stiffness measurement (LSM) by real-time shear wave elastography (SWE) and liver fibrosis stage and the accuracy of LSM for predicting significant and advanced fibrosis, in comparison with serum markers.
METHODS: We consecutively analyzed 70 patients with various chronic liver diseases. Liver fibrosis was staged from F0 to F4 according to the Batts and Ludwig scoring system. Significant and advanced fibrosis was defined as stage F ≥ 2 and F ≥ 3, respectively. The accuracy of prediction for fibrosis was analyzed using receiver operating characteristic curves.
RESULTS: Seventy patients, 15 were belonged to F0-F1 stage, 20 F2, 13 F3 and 22 F4. LSM was increased with progression of fibrosis stage (F0-F1: 6.77 ± 1.72, F2: 9.98 ± 3.99, F3: 15.80 ± 7.73, and F4: 22.09 ± 10.09, P < 0.001). Diagnostic accuracies of LSM for prediction of F ≥ 2 and F ≥ 3 were 0.915 (95%CI: 0.824-0.968, P < 0.001) and 0.913 (95%CI: 0.821-0.967, P < 0.001), respectively. The cut-off values of LSM for prediction of F ≥ 2 and F ≥ 3 were 8.6 kPa with 78.2% sensitivity and 93.3% specificity and 10.46 kPa with 88.6% sensitivity and 80.0% specificity, respectively. However, there were no significant differences between LSM and serum hyaluronic acid and type IV collagen in diagnostic accuracy.
CONCLUSION: SWE showed a significant correlation with the severity of liver fibrosis and was useful and accurate to predict significant and advanced fibrosis, comparable with serum markers.
Keywords: Elastography, Liver fibrosis, Liver stiffness, Liver biopsy, Serum markers
Core tip: This study showed that liver stiffness measurement by real time shear wave elastography was highly accurate to predict the biopsy-proven significant and advanced liver fibrosis and its accuracy was comparable with that of serum markers of hyaluronic acid and type IV collagen.
INTRODUCTION
In patients with chronic hepatitis, the progression of inflammatory reactions and necrosis of hepatocytes causes hepatic fibrosis and leads to cirrhosis, which presents various clinical complications, including ascites, jaundice, or hepatocellular carcinoma[1]. The staging of liver fibrosis, therefore, is of major clinical concern because it informs the patient’s prognosis and is a key factor when determining a treatment strategy. Particularly in cases of chronic viral hepatitis B and C, it is important to detect significant and advanced fibrosis, because these stages are the critical points for anti-viral treatment[2,3]. Traditionally, liver biopsy has been the gold standard for liver fibrosis staging[2]. However, this invasive procedure has potential complications, such as pain or hemorrhage, and the possibility of repeat examination is limited[3]. In addition, hepatic fibrosis affects the liver inhomogeneously, and biopsy specimens may be inadequate samples that do not represent the histology of the whole hepatic parenchyma; this can lead to inter-observer variation of 10%-20% in histologic measurements[4,5]. Non-invasive complementary tools, including traditional imaging using ultrasonography (US) or computerized tomography and blood tests using several serum markers, have been developed, but there is limited clinical evidence that these techniques are effective, particularly for predicting and diagnosing earlier stages of hepatic fibrosis[6-9].
Recently, non-invasive methods for measuring liver stiffness (LS), including transient elastography (TE), acoustic radiation force impulse imaging (ARFI), and magnetic resonance elastography have been developed, and several studies report good results in their ability to predict the degree of hepatic fibrosis[10-12]. More recently, real-time shear wave elastography (SWE), another method for measuring LS, has been developed[13]. Unlike TE, SWE measures tissue elasticity simultaneously during B-mode ultrasound examination, and elasticity values can be measured on the basis of anatomical information. In addition, SWE provides elastography color maps according to the degree of stiffness, allowing an assessment of homogeneity. As a result, SWE provides more accurate information about hepatic fibrosis staging than TE[14]. However, there are few studies comparing SWE results with histologic diagnosis using liver biopsy, and to our knowledge, there are no reports comparing SWE results with indirect serologic markers of hepatic fibrosis such as aspartate aminotransferase (AST) to platelet (PLT) ratio index (APRI), hyaluronic acid (HA), and type IV collagen[15].
Therefore, the aim of this study was to evaluate the correlation between LS measurement (LSM) using SWE and liver fibrosis stage determined histopathologically in patients with various chronic liver diseases, as well as to determine the diagnostic accuracy and clinical usefulness of SWE in predicting significant fibrosis and advanced liver fibrosis. We also compared LS values measured using SWE with serum markers that are also used to detect hepatic fibrosis.
MATERIALS AND METHODS
Study population
This was a single-center retrospective study, with data collected from 83 patients who consecutively underwent SWE, serum sampling for HA and type IV collagen and consequent liver biopsy between September 2010 and February 2013 at Hanyang University Guri Hospital. Thirteen of the 83 patients were excluded, 10 because of body mass indexes (BMI) greater than 30 kg/m2, and 3 due to total bilirubin levels greater than 5 mg/dL. These two factors have been reported to cause unreliable results when performing TE measurements[16,17]. In total, 70 patients were included in the study. The diagnostic criteria of chronic viral hepatitis were as follows: (1) elevated serum alanine aminotransferase (ALT); (2) elevation of serum HBV DNA levels for longer than six months; and (3) positive serum antibody for HCV. Non-viral chronic liver diseases such as alcoholic liver disease and non-alcoholic fatty liver disease were diagnosed through patient history, physical examination, blood testing, abdominal ultrasonography, and liver biopsy. The study was approved by the institution’s ethics committee (IRB 2012-06). All participants gave informed written consent for liver biopsy.
Patient examination
Body weight and height were measured for each patients on the day liver biopsy was performed, and BMI was calculated. Blood samples were taken the morning of the same day, after patients had fasted more than eight hours. Blood tests, which included hemoglobin, PLT, serum albumin, total bilirubin, AST, ALT, prothrombin time (PT; INR: international normalized ratio), gamma-glutamyltranspeptidase (GGT), type IV collagen, and HA were conducted. In addition, APRI [AST/upper limit of normal/PLT count (× 109/L) ×100], which is reportedly a non-invasive method for diagnosing hepatic fibrosis, was calculated using the same blood. HA (normal range: below 75 ng/mL) was measured by enzyme-linked binding protein assay using a hyaluronic acid plate kit (Corgenix, Inc., Westminster, CO, United States), and the serum concentration of type IV collagen (normal range: below 140 ng/mL) was calibrated by the Latex method (Fuji Chem, Ind. Ltd., Tokyo, Japan) using monoclonal antibody that recognizes different parts of type IV collagen. HA and type IV collagen were not measured in 9 patients.
SWE was conducted using an Aixplorer US system (Supersonic Imagine S.A, Aix-en-Provence, France), and a convex probe. All SWE measurements were made by experienced abdominal radiologists (Y. Kim and W. K. Jeong). Shear wave was generated by a continuously repeated focused ultrasound beam to the target tissue along the direction the longitudinal wave propagated. The velocity of the generated shear wave was measured by performing an ultra-fast ultrasound scan at a very high frame rate (more than 4000 frames per second), and the liver stiffness of corresponding tissue was calculated by measuring the shear wave velocity generated. After gray-scale US, SWE was performed using the same probe. The curved transducer was placed intercostally at the level of the right lobe of the liver, with the target area was located in the right anterior hepatic segment at a depth of more than 2 cm from the hepatic capsule to avoid major vessels. LS was measured within a 5 s breath hold. The measurement was performed 10 times for each patient, and results were expressed in kilopascals (kPa). Median value was considered representative of the LS.
Liver biopsy was conducted percutaneously under US-guidance. Biopsy specimens were fixed in formalin and embedded in paraffin; 5-mm-thick sections were then cut and stained with hematoxylin-eosin. Masson-trichrome staining was also performed to more accurately analyze hepatic fibrosis. All histologic analyses were performed independently by one pathologist (Y. Oh). The hepatic fibrosis was staged on a 0-4 scale according to the classification suggested by Batts and Ludwig: F0 = no fibrosis; F1 = portal fibrosis; F2 = periportal fibrosis; F3 = septal fibrosis; and F4 = cirrhosis[18]. Hepatic fibrosis staged higher than F2 was considered significant fibrosis, and higher than stage F3 as advanced fibrosis[18].
Statistical analysis
Statistical analysis was performed using the SPSS software package version 18.0 for Windows (SPSS, Chicago, IL, United States), and Medcalc, version 9.1 (Medcalc software, Ostend, Belgium). Statistical significance was defined as P < 0.05.
The results of each examination were described either as mean ± SD or median value inter-quartile range (IQR). Kruskal-Wallis’ one-way analysis of variance by ranks was used the test differences between measured LS values, and the Tukey test was used for post-hoc comparison. The diagnostic performance of SWE was accessed using receiver operating characteristic (ROC) curves and area under the ROC (AUROC) curve analysis. Diagnostic cut-off value for the diagnosis of significant fibrosis, advanced fibrosis and cirrhosis was determined as the maximum combined values of sensitivity and specificity. Spearman’s coefficient was used to test the correlation between stage of hepatic fibrosis and each variable. Additionally, AUROC analysis was also performed to access the efficacy of LS values measured by SWE and serum markers for the prediction of hepatic fibrosis in chronic liver disease.
RESULTS
Clinical characteristics of patients
The clinical characteristics of the patients are summarized in Table 1. The mean age of 70 total patients was 45.9 ± 15.7 years, and the majority (64.3%) was male. The causes of chronic liver disease were HBV (n = 23, 32.9%), HCV (18, 25.7%), alcohol (12, 17.1%), non-alcoholic liver disease (4, 5.7%), and other diseases including autoimmune hepatitis and unknown causes (13, 18.6%). The mean length of liver biopsy specimens was 16.2 ± 2.3 mm.
Table 1.
Baseline characteristics of patients
| Characteristics | n = 70 | |
| Age, yr (SD, range) | 45.9 | (15.7, 12.0-82.0) |
| Sex, male (%) | 45 | (64.3) |
| HBV/HCV/Alcohol/NAFLD/Other (%) | 23 (32.9)/18 (25.7)/12 (17.1)/4 (5.7)/13 (18.6) | |
| Body mass index, kg/m2(SD, range) | 23.8 | (2.9, 16.9-29.7) |
| Hemoglobin, g/dL (SD, range) | 12.9 | (2.2, 6.7-17.8) |
| Platelet count, 103/mm3 (SD, range) | 174.7 | (55.3, 76.0-285.0) |
| Albumin, g/dL (SD, range) | 3.9 | (0.7, 1.6-5.3) |
| AST, U/L (IQR, range) | 55 | (31-111, 13-369) |
| ALT, U/L (IQR, range) | 47 | (24-99, 6-473) |
| Total bilirubin, mg/dL (IQR, range) | 0.7 | (0.5-1.1, 0.2-4.9) |
| GGT, U/L (IQR, range) | 57 | (31-157, 13-1569) |
| Prothrombin time, INR (IQR, range) | 0.93 | (0.87-1.00, 0.76-1.48) |
| APRI (IQR, range) | 0.91 | (0.51-1.35, 0.55-5.88) |
| Hyaluronic acid1, ng/mL (IQR, range) | 62 | (23-176, 10-2796) |
| Type IV collagen1, ng/mL (IQR, range) | 182 | (117-310, 66-2790) |
| Liver stiffness by SWE, kPa (IQR, range) | 11.1 | (7.3-18.4, 4.73-48.61) |
| Fibrosis stage (%) | ||
| F0-1 | 15 | (21.4) |
| F2 | 20 | (28.6) |
| F3 | 13 | (18.6) |
| F4 | 22 | (31.4) |
n = 61. HBV: Hepatitis B virus; HCV: Hepatitis C virus; NAFLD: Nonalcoholic fatty liver disease; AST: Aspartate aminotransferase; ALT: Alanine aminotransferase; GGT: Gamma glutamyltranspeptidase; INR: International normalized ratio; SWE: Shear wave elastography; kPa: Kilopascals; SD:Standard deviation; IQR: Interquartile range.
The stage of hepatic fibrosis in the patients showed a relatively even distribution, as follows: F0-1, n =15 (21.4%); F2, 20 (28.6%); F3, 13 (18.6%); and F4, 22 (31.4%). Median measured value of LS was 11.1 (IQR: 7.3-18.4) kPa.
Correlation between LSM and hepatic fibrosis
Figure 1 show the correlation between LS measured using SWE and hepatic fibrosis diagnosed by biopsy. The mean LSM values according to hepatic fibrosis stage were as follows: F0-1, 6.77 ± 1.72 kPa; F2, 9.98 ± 3.99 kPa; F3, 15.80 ± 7.73 kPa; and F4, 22.09 ± 10.09 kPa. The correlation between LSM and hepatic fibrosis stage was significant (r = 0.774, P < 0.001). When comparing LS values at different hepatic fibrosis stages, significant differences were found between F0-1 and F3 (P = 0.006), between F0-1 and F4 (P < 0.001), and between F2 and F4 (P < 0.001). However, there were no significant differences between the other hepatic fibrosis stages.
Figure 1.
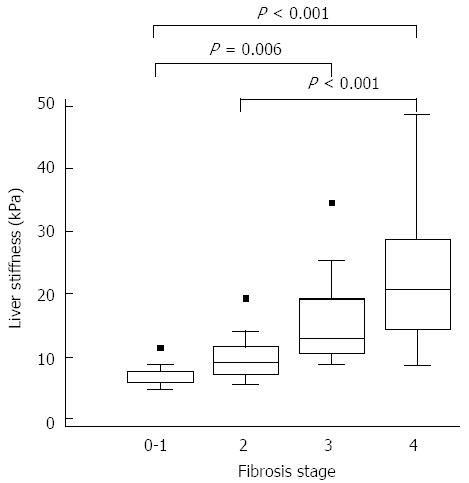
Score values of liver stiffness by according to fibrosis stage (n = 70). Boxplots summarize the liver stiffness by shear wave elastography (SWE) for each fibrosis classification. For each box, the box gives the interquartile range, that is, the 25th to 75th percentiles of liver stiffness by SWE, with line inside the box denoting the median, the 50th percentile of data. Statistical significant test was done by Tukey test using ranks.
Diagnostic performance of LSM using SWE for the prediction of hepatic fibrosis
The AUROCs for LSM using SWE were 0.915 (95%CI: 0.824-0.968, P < 0.001), 0.913 (95%CI: 0.821-0.967, P < 0.001), and 0.878 (95%CI, 0.778-0.944, P < 0.001) for the diagnosis of significant fibrosis (≥ F2), advanced fibrosis (≥ F3) and cirrhosis (F4), respectively. Optimal cut-off values for the different levels of hepatic fibrosis by ROC curve analysis for SWE measurement were as follows: significant fibrosis, 8.6 kPa (sensitivity 78.2%, specificity 93.3%); advanced fibrosis, 10.46 kPa (sensitivity 88.6%, specificity 80.0%); and cirrhosis, 14.0 kPa (sensitivity 77.3%, specificity 85.4%) (Figure 2, Table 2).
Figure 2.
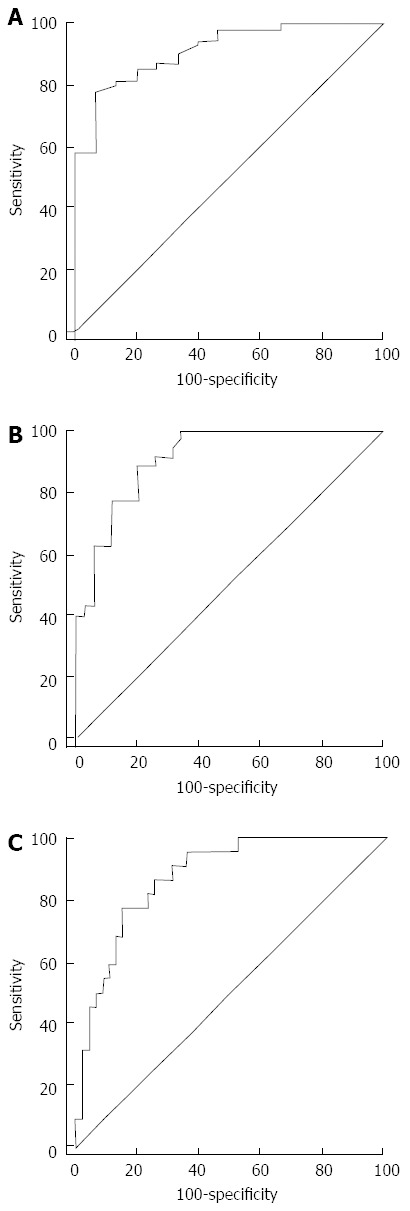
Receiver-operating characteristic curves of liver stiffness determined by shear wave elastography for diagnosis of significant fibrosis (F0-1 vs F2-4, A), advanced fibrosis (F0-2 vs F3-4, B) and cirrhosis (F0-3 vs F4, C) (n = 70).
Table 2.
Liver stiffness cut-off values for the diagnosis of significant (≥ F2) and advanced (≥ F3) fibrosis and cirrhosis (F4) (n = 70)
| Value | ≥ F2 | ≥ F3 | = F4 |
| Number of patients, n (%) | 55 (78.6) | 35 (50.0) | 22 (31.4) |
| Optimal cut-off1 (kPa) | 8.60 | 10.46 | 14.00 |
| Sensitivity (%) | 78.20 | 88.60 | 77.30 |
| Specificity (%) | 93.30 | 80.00 | 85.40 |
| Negative likelihood ratio | 11.73 | 4.43 | 5.30 |
| Positive likelihood ratio | 0.23 | 0.14 | 0.27 |
Cut-off value was calculated to maximize the sum of sensitivity and specificity. kPa: Kilopascals.
Correlation between serum markers and hepatic fibrosis
When analyzing paired combinations, hepatic fibrosis showed a significant negative correlation with platelet (r = -0.514, P < 0.001) and albumin (r = -0.505, P < 0.001) levels, and a significant positive correlation with PT (INR) (r = 0.479, P < 0.001), HA (r = 0.708, P < 0.001), and type IV collagen (r = 0.691, P < 0.001). There were only weak correlations between hepatic fibrosis and hemoglobin (r = -0.281, P = 0.018), serum total bilirubin (r = 0.302, P = 0.011), GGT (r = 0.236, P = 0.049), and APRI (r = 0.390, P = 0.001). AST and ALT showed no significant correlation with hepatic fibrosis stage (Table 3). When analyzing paired combinations of hepatic fibrosis with serum markers and LSM, LSM showed the highest correlation (r = 0.774, P < 0.001).
Table 3.
Correlation between noninvasive serum markersand histologic fibrosis in chronic liver disease (n =70)
| Fibrosis stage | r | P value |
| Age | 0.344 | 0.004 |
| Hemoglobin | -0.281 | 0.018 |
| Platelet | -0.514 | < 0.001 |
| Albumin | -0.505 | < 0.001 |
| AST | 0.215 | 0.074 |
| ALT | -0.087 | 0.475 |
| Total bilirubin | 0.302 | 0.011 |
| GGT | 0.236 | 0.049 |
| Prothrombin time (INR) | 0.479 | < 0.001 |
| APRI | 0.390 | 0.001 |
| Hyaluronic acid1 | 0.708 | < 0.001 |
| Type IV collagen1 | 0.691 | < 0.001 |
| Liver stiffness by SWE | 0.774 | < 0.001 |
n = 61. AST: Aspartate aminotransferase; ALT: Alanine aminotransferase; GGT: Gamma glutamyltranspeptidase; INR: International normalized ratio; APRI: Aspartate aminotransferase to platelet ratio index; SWE: Shear wave elastography.
Comparison of LSM with serum markers for the prediction of hepatic fibrosis in the whole patients
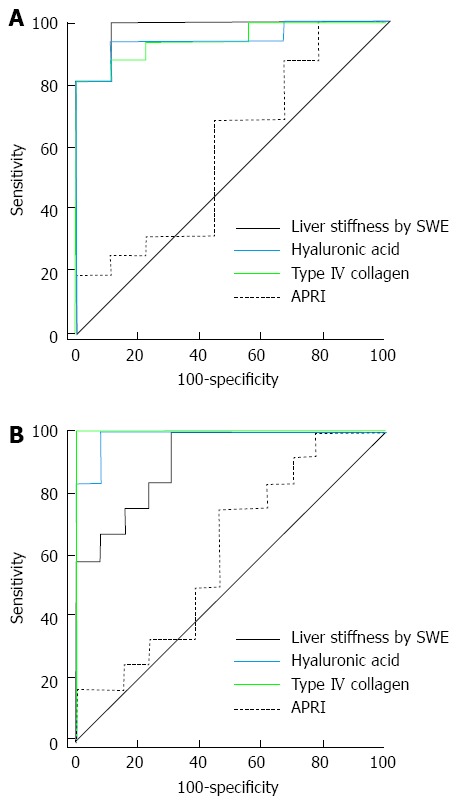
Figure 3 shows the ROC curves for APRI, HA, type IV collagen and LSM by SWE for the diagnosis of significant fibrosis, advanced fibrosis and liver cirrhosis. The AUROC value for the diagnosis of significant fibrosis was higher in SWE (0.908) than serum markers (APRI = 0.691, HA = 0.812, type IV collagen = 0.841), but the results were not statistically significant (HA, P = 0.081; and type IV collagen, P = 0.189), except in the case of APRI (P = 0.003). The AUROC value for the diagnosis of advanced fibrosis was also significantly higher in SWE (0.893) than APRI (0.743) (P = 0.032). However, LSM showed no significant differences between the other 2 markers (HA = 0.897 and type IV collagen = 0.876; P = 0.974 and 0.631, respectively). Finally, the AUROC value for the diagnosis of liver cirrhosis was also significantly higher in LSM (0.877) than APRI (0.683) (P = 0.032), but there were no significant differences between LSM and the other serum markers (HA = 0.879 and type IV collagen = 0.850; P = 0.974 and 0.631, respectively) (Table 4).
Figure 3.
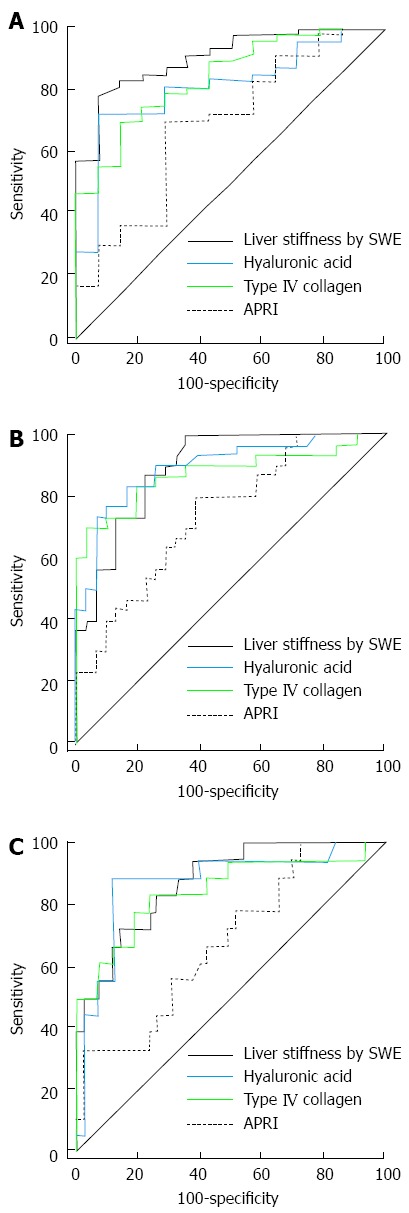
Receiver operating characteristic curves of noninvasive serum markers for discriminating F0-1 vs F2-4 (significant fibrosis, A), F0-2 vs F3-4 (advanced fibrosis, B) and F0-3 vs F4 (cirrhosis, C) (n = 61). SWE: Shear wave elastography; APRI: Aspartate aminotransferase to platelet ratio index.
Table 4.
Comparison of diagnostic performance between noninvasive serum marker for discriminating F0-1 vs F2-4 (significant fibrosis), F0-2 vs F3-4 (advanced fibrosis) and F0-3 vs F4 (cirrhosis) (n =61)
| AUROC | 95%CI |
Pairwise comparison of ROC curves |
|||
| Factor | Difference between areas (95%CI) | P value | |||
| Significant fibrosis | |||||
| SWE | 0.908 | 0.806-0.967 | HA | 0.097 (-0.012-0.205) | 0.081 |
| Type IV | 0.067 (-0.003-0.167) | 0.189 | |||
| APRI | 0.217 (0.074-0.359) | 0.003 | |||
| HA | 0.812 | 0.691-0.900 | Type IV | 0.030 (-0.092-0.152) | 0.634 |
| APRI | 0.120 (-0.041-0.281) | 0.145 | |||
| Type IV | 0.841 | 0.725-0.922 | APRI | 0.150 (-0.006-0.305) | 0.059 |
| APRI | 0.691 | 0.560-0.803 | |||
| Advanced fibrosis | |||||
| SWE | 0.893 | 0.787-0.957 | HA | 0.004 (-0.093-0.101) | 0.939 |
| Type IV | 0.017 (-0.080-0.113) | 0.735 | |||
| APRI | 0.150 (0.013-0.287) | 0.032 | |||
| HA | 0.897 | 0.792-0.960 | Type IV | 0.020 (-0.074-0.115) | 0.671 |
| APRI | 0.154 (0.014-0.293) | 0.031 | |||
| Type IV | 0.876 | 0.767-0.947 | APRI | 0.133 (-0.010-0.277) | 0.069 |
| APRI | 0.743 | 0.615-0.846 | |||
| Cirrhosis | |||||
| SWE | 0.877 | 0.768-0.947 | HA | 0.002 (-0.114-0.118) | 0.974 |
| Type IV | 0.027 (-0.084-0.138) | 0.631 | |||
| APRI | 0.194 (0.031-0.358) | 0.002 | |||
| HA | 0.879 | 0.770-0.948 | Type IV | 0.029 (-0.072-0.130) | 0.571 |
| APRI | 0.196 (0.022-0.371) | 0.027 | |||
| Type IV | 0.850 | 0.736-0.928 | APRI | 0.167 (-0.003-0.338) | 0.055 |
| APRI | 0.683 | 0.551-0.796 | |||
ROC: Receiver-operating characteristic curves; AUROC: Area under the ROC curve; SWE: Shear wave elastography; HA: Hyaluronic acid; Type IV: Type IV collagen; APRI: Aspartate aminotransferase to platelet ratio index.
Comparison of LSM with serum markers in a subgroup of patients with chronic viral hepatitis
Figure 4 shows the ROC curves for APRI, HA, type IV collagen and LSM for the diagnosis of significant hepatic fibrosis, advanced fibrosis and liver cirrhosis in 36 patients with chronic viral hepatitis. The AUROC value for the diagnosis of significant hepatic fibrosis was higher in SWE (0.935) than the serum markers (APRI = 0.858, HA = 0.658, type IV collagen = 0.777), but the difference was only significant between SWE and HA (P = 0.009; APRI and type IV collagen P values were 0.289 and 0.063, respectively). The AUROC value for the diagnosis of advanced fibrosis (≥ F3) was also higher in SWE (0.914) than the serum markers (APRI = 0.827, HA = 0.819, type IV collagen = 0.793), but the result was not statistically significant (Table 5).
Figure 4.
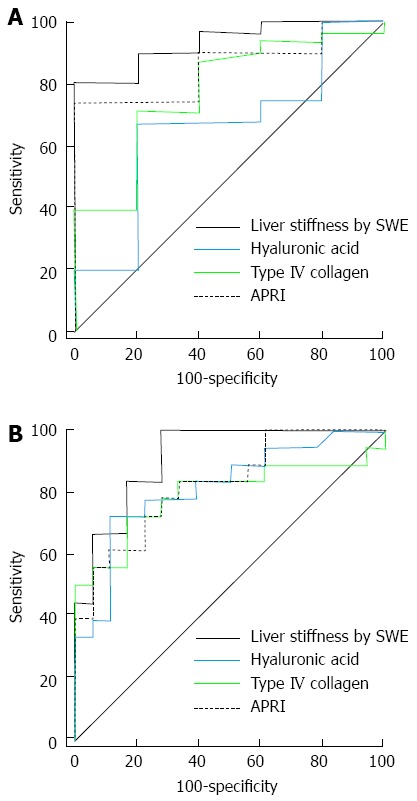
Comparison of receiver-operating characteristiccurves of noninvasive serum markers for discriminating F0F1 vs F2-4 (significant fibrosis, A) and F0-2 vs F3F4 (advanced fibrosis, B) in 36 patients with chronic viral hepatitis. ROC: Receiver-operating characteristic curves; SWE: Shear wave elastography; APRI: Aspartate aminotransferase to platelet ratio index.
Table 5.
Comparison of diagnostic performance between shear wave elastography and noninvasive serum markers for discriminating F0-1 vs F2-4 (significant fibrosis) and F0-2 vs F3-4 (advanced fibrosis) in patients with chronic viral hepatitis (n =36)
| AUROC | 95%CI |
Pairwise comparison of ROC curves |
|||
| Factor | Difference between areas (95%CI) | P value | |||
| Significant fibrosis | |||||
| SWE | 0.935 | 0.800-0.989 | HA | 0.277 (0.070-0.485) | 0.009 |
| Type IV | 0.158 (-0.009-0.325) | 0.063 | |||
| APRI | 0.077 (-0.066-0.220) | 0.289 | |||
| HA | 0.658 | 0.482-0.807 | Type IV | 0.119 (-0.084-0.326) | 0.257 |
| APRI | 0.200 (-0.029-0.429) | 0.086 | |||
| Type IV | 0.777 | 0.608-0.898 | APRI | 0.081 (-0.126-0.288) | 0.445 |
| APRI | 0.858 | 0.701-0.951 | |||
| Advanced fibrosis | |||||
| SWE | 0.914 | 0.771-0.980 | HA | 0.094 (-0.054-0.243) | 0.214 |
| Type IV | 0.120 (-0.030-0.271) | 0.118 | |||
| APRI | 0.086 (-0.061-0.234) | 0.250 | |||
| HA | 0.819 | 0.656-0.927 | Type IV | 0.026 (-0.120-0.172) | 0.725 |
| APRI | 0.008 (-0.168-0.183) | 0.931 | |||
| Type IV | 0.793 | 0.626-0.909 | APRI | 0.034 (-0.153-0.221) | 0.722 |
| APRI | 0.827 | 0.665-0.932 | |||
ROC: Receiver-operating characteristic curves; AUROC: Area under the ROC curve; SWE: Shear wave elastography; HA: Hyaluronic acid; Type IV: Type IV collagen; APRI: Aspartate aminotransferase to platelet ratio index.
Comparison of LSM with serum markers in a subgroup of patients with non-viral chronic liver disease
Figure 5 shows the ROC curves for APRI, HA, type IV collagen and LSM for the diagnosis of significant fibrosis, advanced fibrosis and cirrhosis in 25 patients with non-viral chronic liver disease. AUROC values for the diagnosis of significant fibrosis were higher in LSM (0.979) than the serum markers (APRI = 0.590, HA = 0.944, type IV collagen = 0.944), but there was no statistical significance (HA, P = 0.465; and type IV collagen, P = 0.429, respectively), except in the case of APRI (P = 0.001) (Table 6). AUROC value for the diagnosis of advanced fibrosis (≥ F3) was also significantly higher for LSM (0.910) than APRI (0.615) (P = 0.014). The AUROC value of LSM was lower than HA (0.987) and type IV collagen (1.000), but the results were not statistically significant (P = 0.206 and 0.156, respectively) (Table 6).
Figure 5.
Comparison of receiver-operating characteristic curves of noninvasive marker for discriminating F0F1 vs F2-4 (significant fibrosis, A) and F0-2 vs F3F4 (advanced fibrosis, B) in 25 patients with non-viral chronic liver diseases. ROC: Receiver-operating characteristic curves; SWE: Shear wave elastography; APRI: Aspartate aminotransferase to platelet ratio index.
Table 6.
Comparison of diagnostic performance between shear wave elastography and noninvasive serum markers for discriminating F0-1 vs F2-4 (significant fibrosis) and F0-2 vs F3-4 (advanced fibrosis) with non-viral chronic liver diseases (n = 25)
| AUROC | 95%CI |
Pairwise comparison of ROC curves |
|||
| Factor | Difference between areas (95%CI) | P value | |||
| Significant fibrosis | |||||
| SWE | 0.979 | 0.826-0.988 | HA | 0.035 (-0.058-0.128) | 0.465 |
| Type IV | 0.035 (-0.051-0.121) | 0.429 | |||
| APRI | 0.389 (0.163-0.615) | 0.001 | |||
| HA | 0.944 | 0.773-0.993 | Type IV | 0.000 (-0.103-0.103) | 1.000 |
| APRI | 0.354 (0.137-0.572) | 0.001 | |||
| Type IV | 0.944 | 0.773-0.993 | APRI | 0.354 (0.130-0.578) | 0.002 |
| APRI | 0.590 | 0.378-0.781 | |||
| Advanced fibrosis | |||||
| SWE | 0.910 | 0.726-0.985 | HA | 0.077 (-0.042-0.196) | 0.206 |
| Type IV | 0.090 (-0.034-0.214) | 0.156 | |||
| APRI | 0.295 (0.060-0.530) | 0.014 | |||
| HA | 0.987 | 0.839-1.000 | Type IV | 0.013 (-0.034-0.060) | 0.593 |
| APRI | 0.372 (0.155-0.589) | 0.001 | |||
| Type IV | 1.000 | 0.862-1.000 | APRI | 0.385 (0.160-0.609) | 0.001 |
| APRI | 0.615 | 0.401-0.801 | |||
ROC: Receiver-operating characteristic curves; AUROC: Area under the ROC curve; SWE: Shear wave elastography; HA: Hyaluronic acid; Type IV: Type IV collagen; APRI: Aspartate aminotransferase to platelet ratio index.
DISCUSSION
We assessed the clinical usefulness of LSM using SWE in patients with various chronic liver diseases in predicting the degree of hepatic fibrosis by comparing SWE with histopathological results. The results clearly showed LS values measured using SWE were significantly correlated with severity of hepatic fibrosis (r = 0.774, P < 0.001). Furthermore, the results indicated that the diagnostic accuracy of LSM using SWE for the detection of significant fibrosis (≥ F2) and advanced fibrosis (≥ F3) was very high (AUROC values of 0.915 and 0.913, respectively), suggesting that SWE offers excellent diagnostic performance. Our results are consistent with previously published studies. Bavu et al[14] compared the results of SWE with that of TE after grading hepatic fibrosis into F0-1, F2, F3, and F4 using serologic examination without performing liver biopsies. In that study, LS measured using SWE increased according to the severity of hepatic fibrosis, and AUROC values for the diagnosis of significant fibrosis, advanced fibrosis and cirrhosis were 0.948, 0.962 and 0.968, respectively. Ferraioli et al[15] also compared SWE with TE in chronic hepatitis C patients using liver biopsy specimens, and LS measured using SWE also increased according to hepatic fibrosis stage. In their study, AUROC values for the diagnosis of significant fibrosis, advanced fibrosis and liver cirrhosis were 0.92, 0.98 and 0.98, respectively. Taken together, these results suggest that SWE is a promising tool for non-invasively predicting various degrees of hepatic fibrosis in patients with chronic liver diseases.
Previous studies have reported that serologic examinations using serum markers or TE more accurately diagnose liver cirrhosis rather than intermediate stages of fibrosis (F2-3)[8,11]. However, in our study, the AUROC value (0.878) of LSM using SWE for detecting cirrhosis was slightly lower, but not significantly, than the values for detecting fibrosis staged ≥ F2 and ≥ F3 (which were 0.915 and 0.913, respectively). We are not currently able to explain this difference. A small sample size and heterogeneous causes of chronic liver diseases may explain the result. Therefore, large prospective studies in patients with homogenous disease causes are needed. Nonetheless, a recent study showed no significant difference between LSM using SWE for detection of intermediate stage fibrosis and cirrhosis, and, in addition, reported that SWE was superior to TE in detecting significant fibrosis[17]; our findings suggest that SWE may diagnose intermediate stages of fibrosis more accurately than other modalities.
We did not compare SWE with TE in this study. However, we performed additional serologic examinations, and included various serum markers of hepatic fibrosis, such as APRI, HA, and type IV collagen, as well as other serum parameters [hemoglobin, serum bilirubin, PT (INR), GGT]. Levels of all the listed serum markers were positively correlated with hepatic fibrosis stage. On the other hand, platelet and serum albumin were negatively correlated, and AST and ALT showed no significant correlations. These results are consistent with other published data[15,19,20]. The results of LSM using SWE showed the highest correlation with hepatic fibrosis stage (r = 0.774, P < 0.001) of all the tested parameters.
When we compared the results of SWE and serum markers, the AUROC value for the detection of significant fibrosis was higher in SWE than the other serum markers, although the only significant difference was between SWE and APRI. The AUROC value for the detection of advanced fibrosis was also significantly higher using SWE than APRI, but the AUROC value of SWE was similar to both HA and type IV collagen. To our knowledge, there are no previous studies that compare SWE with serum fibrosis markers such as APRI, HA, and type IV collagen. In previous studies, TE was reportedly superior to serum markers for detecting hepatic fibrosis in hepatitis C patients[6,9,21,22]; additionally, SWE was superior to TE in detecting significant fibrosis, but similar to TE in detecting advanced fibrosis and liver cirrhosis[15]. In sum, the diagnostic performance of SWE is similar or superior to that of serum markers in detecting hepatic fibrosis. Furthermore, when we analyzed the results more specifically according chronic liver disease causes, SWE consistently showed AUROC values greater than 0.9, whereas the AUROC values of APRI, HA and type IVcollagen varied according to disease cause. This suggests that SWE is a promising single method for detecting hepatic fibrosis, regardless of cause.
This study has several limitations. Firstly, it was a retrospective study of a relatively small number of patients conducted in a single institution. To overcome this limitation, we consecutively collected subjects for the study, but there were lost data from serologic examinations of some patients, including HA and type IV collagen; and the results of these patients were excluded from the statistical analysis when comparing SWE and serum markers. Secondly, AUROC values of LS measured using SWE tended to be lower in our study than previously reported studies. This could be explained by the inclusion of heterogeneous subjects with various causes of chronic liver disease. Finally, we could not compare SWE to other recently developed imaging modalities, such as TE and ARFI.
In conclusion, LS measured using SWE positively correlates to hepatic fibrosis stage assessed by liver biopsy, and SWE is a very useful and accurate method for detecting significant fibrosis and advanced fibrosis, with diagnostic accuracy comparable to serum HA and type IV collagen. Prospective studies of a large cohort of patients with a homogeneous cause of chronic liver disease should be undertaken in the near future.
COMMENTS
Background
The staging of liver fibrosis, therefore, is of major clinical concern because it informs the patient’s prognosis and is a key factor when determining a treatment strategy. Particularly in cases of chronic viral hepatitis B and C, it is important to detect significant and advanced fibrosis, because these stages are the critical points for anti-viral treatment.
Innovations and breakthroughs
This study was to evaluate the correlation between liver stiffness measurement (LSM) using shear wave elastography (SWE) and liver fibrosis stage determined histopathologically in patients with various chronic liver diseases, as well as to determine the diagnostic accuracy and clinical usefulness of SWE in predicting significant fibrosis and advanced liver fibrosis.
Applications
SWE is a very useful and accurate method for detecting significant fibrosis and advanced fibrosis, with diagnostic accuracy comparable to serum HA and type IV collagen.
Peer review
In this study authors evaluated the correlation between LSM byreal-time SWE and liver fibrosis stage. They enrolled 70 consecutive patients with various chronic liver diseases (hepatitis B virus, hepatitis C virus, alcohol, non-alcoholic liver disease and other diseases including autoimmune hepatitis and unknown cause). The major result is that LSM by SWE showed a significant correlation with the severity of liver fibrosis, maximally identifying moreadvanced degrees of disease.
Footnotes
Supported by Research fund of the Hanyang University, No. HY-2010-G
P- Reviewer: Di Minno MND, Ferreira Caboclo JL, Greco L, Tripathi D, Yoshida H S- Editor: Qi Y L- Editor: A E- Editor: Du P
References
- 1.Cho SW, Cheong JY. Clinical application of non-invasive diagnosis for hepatic fibrosis. Korean J Hepatol. 2007;13:129–137. [PubMed] [Google Scholar]
- 2.Dienstag JL. The role of liver biopsy in chronic hepatitis C. Hepatology. 2002;36:S152–S160. doi: 10.1053/jhep.2002.36381. [DOI] [PubMed] [Google Scholar]
- 3.Bravo AA, Sheth SG, Chopra S. Liver biopsy. N Engl J Med. 2001;344:495–500. doi: 10.1056/NEJM200102153440706. [DOI] [PubMed] [Google Scholar]
- 4.Bedossa P, Dargère D, Paradis V. Sampling variability of liver fibrosis in chronic hepatitis C. Hepatology. 2003;38:1449–1457. doi: 10.1016/j.hep.2003.09.022. [DOI] [PubMed] [Google Scholar]
- 5.Regev A, Berho M, Jeffers LJ, Milikowski C, Molina EG, Pyrsopoulos NT, Feng ZZ, Reddy KR, Schiff ER. Sampling error and intraobserver variation in liver biopsy in patients with chronic HCV infection. Am J Gastroenterol. 2002;97:2614–2618. doi: 10.1111/j.1572-0241.2002.06038.x. [DOI] [PubMed] [Google Scholar]
- 6.Castera L. Noninvasive methods to assess liver disease in patients with hepatitis B or C. Gastroenterology. 2012;142:1293–1302.e4. doi: 10.1053/j.gastro.2012.02.017. [DOI] [PubMed] [Google Scholar]
- 7.Aubé C, Oberti F, Korali N, Namour MA, Loisel D, Tanguy JY, Valsesia E, Pilette C, Rousselet MC, Bedossa P, et al. Ultrasonographic diagnosis of hepatic fibrosis or cirrhosis. J Hepatol. 1999;30:472–478. doi: 10.1016/s0168-8278(99)80107-x. [DOI] [PubMed] [Google Scholar]
- 8.Ronot M, Asselah T, Paradis V, Michoux N, Dorvillius M, Baron G, Marcellin P, Van Beers BE, Vilgrain V. Liver fibrosis in chronic hepatitis C virus infection: differentiating minimal from intermediate fibrosis with perfusion CT. Radiology. 2010;256:135–142. doi: 10.1148/radiol.10091295. [DOI] [PubMed] [Google Scholar]
- 9.Degos F, Perez P, Roche B, Mahmoudi A, Asselineau J, Voitot H, Bedossa P. Diagnostic accuracy of FibroScan and comparison to liver fibrosis biomarkers in chronic viral hepatitis: a multicenter prospective study (the FIBROSTIC study) J Hepatol. 2010;53:1013–1021. doi: 10.1016/j.jhep.2010.05.035. [DOI] [PubMed] [Google Scholar]
- 10.Castéra L, Vergniol J, Foucher J, Le Bail B, Chanteloup E, Haaser M, Darriet M, Couzigou P, De Lédinghen V. Prospective comparison of transient elastography, Fibrotest, APRI, and liver biopsy for the assessment of fibrosis in chronic hepatitis C. Gastroenterology. 2005;128:343–350. doi: 10.1053/j.gastro.2004.11.018. [DOI] [PubMed] [Google Scholar]
- 11.Friedrich-Rust M, Nierhoff J, Lupsor M, Sporea I, Fierbinteanu-Braticevici C, Strobel D, Takahashi H, Yoneda M, Suda T, Zeuzem S, et al. Performance of Acoustic Radiation Force Impulse imaging for the staging of liver fibrosis: a pooled meta-analysis. J Viral Hepat. 2012;19:e212–e219. doi: 10.1111/j.1365-2893.2011.01537.x. [DOI] [PubMed] [Google Scholar]
- 12.Huwart L, Sempoux C, Vicaut E, Salameh N, Annet L, Danse E, Peeters F, ter Beek LC, Rahier J, Sinkus R, et al. Magnetic resonance elastography for the noninvasive staging of liver fibrosis. Gastroenterology. 2008;135:32–40. doi: 10.1053/j.gastro.2008.03.076. [DOI] [PubMed] [Google Scholar]
- 13.Muller M, Gennisson JL, Deffieux T, Tanter M, Fink M. Quantitative viscoelasticity mapping of human liver using supersonic shear imaging: preliminary in vivo feasibility study. Ultrasound Med Biol. 2009;35:219–229. doi: 10.1016/j.ultrasmedbio.2008.08.018. [DOI] [PubMed] [Google Scholar]
- 14.Bavu E, Gennisson JL, Couade M, Bercoff J, Mallet V, Fink M, Badel A, Vallet-Pichard A, Nalpas B, Tanter M, et al. Noninvasive in vivo liver fibrosis evaluation using supersonic shear imaging: a clinical study on 113 hepatitis C virus patients. Ultrasound Med Biol. 2011;37:1361–1373. doi: 10.1016/j.ultrasmedbio.2011.05.016. [DOI] [PubMed] [Google Scholar]
- 15.Ferraioli G, Tinelli C, Dal Bello B, Zicchetti M, Filice G, Filice C. Accuracy of real-time shear wave elastography for assessing liver fibrosis in chronic hepatitis C: a pilot study. Hepatology. 2012;56:2125–2133. doi: 10.1002/hep.25936. [DOI] [PubMed] [Google Scholar]
- 16.Sagir A, Erhardt A, Schmitt M, Häussinger D. Transient elastography is unreliable for detection of cirrhosis in patients with acute liver damage. Hepatology. 2008;47:592–595. doi: 10.1002/hep.22056. [DOI] [PubMed] [Google Scholar]
- 17.Castéra L, Foucher J, Bernard PH, Carvalho F, Allaix D, Merrouche W, Couzigou P, de Lédinghen V. Pitfalls of liver stiffness measurement: a 5-year prospective study of 13,369 examinations. Hepatology. 2010;51:828–835. doi: 10.1002/hep.23425. [DOI] [PubMed] [Google Scholar]
- 18.Park YN, Kim Hg, Chon CY, Park JB, Sohn JH, Yang SH, Yu ES, Lee MS, Jang JJ, Chang HK, et al. Histological grading and staging of chronic hepatitis standardized guideline proposed by the Korean Study Group for the Pathology of Digestive Diseases. Korean J Pathol. 1999;33:337–346. [Google Scholar]
- 19.Kim SM, Sohn JH, Kim TY, Roh YW, Eun CS, Jeon YC, Han DS, Oh YH. Comparison of various noninvasive serum markers of liver fibrosis in chronic viral liver disease. Korean J Hepatol. 2009;15:454–463. doi: 10.3350/kjhep.2009.15.4.454. [DOI] [PubMed] [Google Scholar]
- 20.Takahashi H, Ono N, Eguchi Y, Eguchi T, Kitajima Y, Kawaguchi Y, Nakashita S, Ozaki I, Mizuta T, Toda S, et al. Evaluation of acoustic radiation force impulse elastography for fibrosis staging of chronic liver disease: a pilot study. Liver Int. 2010;30:538–545. doi: 10.1111/j.1478-3231.2009.02130.x. [DOI] [PubMed] [Google Scholar]
- 21.Zarski JP, Sturm N, Guechot J, Paris A, Zafrani ES, Asselah T, Boisson RC, Bosson JL, Guyader D, Renversez JC, et al. Comparison of nine blood tests and transient elastography for liver fibrosis in chronic hepatitis C: the ANRS HCEP-23 study. J Hepatol. 2012;56:55–62. doi: 10.1016/j.jhep.2011.05.024. [DOI] [PubMed] [Google Scholar]
- 22.Kim SU, Jang HW, Cheong JY, Kim JK, Lee MH, Kim DJ, Yang JM, Cho SW, Lee KS, Choi EH, et al. The usefulness of liver stiffness measurement using FibroScan in chronic hepatitis C in South Korea: a multicenter, prospective study. J Gastroenterol Hepatol. 2011;26:171–178. doi: 10.1111/j.1440-1746.2010.06385.x. [DOI] [PubMed] [Google Scholar]