The Medicare Current Beneficiary Survey (MCBS) tracks health care expenditures for 12,000 beneficiaries. The survey is unique because it combines survey data with Medicare administrative data to give a detailed portrait of health care spending for Medicare beneficiaries. The MCBS provides health care expenditures for the Medicare population by service and payer, and it allows for analysis by demographic and socioeconomic characteristics. The MCBS collects beneficiaries' out-of-pocket expenses and insurer payments for all services, whether they are covered by Medicare or not.
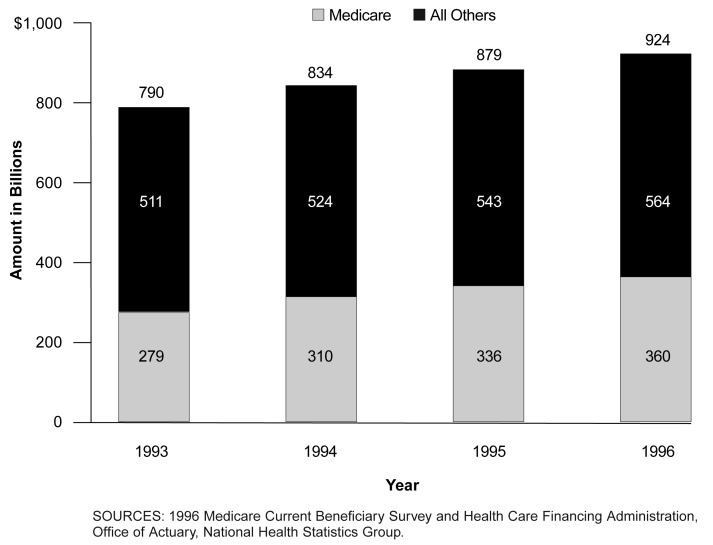
Figure 1. Personal Health Care Expenditures, by Source of Funds, 1993-1996.
- Personal health care expenditures for Medicare beneficiaries were $360 billion in 1996, while personal health care spending for the Nation was $924 billion.
- Medicare beneficiaries make up 14 percent of the U.S. population but account for 39 percent of the Nations' personal health care expenditures.
- Health care spending for the Medicare population has grown faster in recent years than for the Nation as a whole—health care spending for the Medicare population increased by 29 percent between 1993 and 1996 while national spending increased by 17 percent.
- The faster growth in spending has resulted in an increasing share of national health care expenditures by the Medicare population—35 percent in 1993 versus 39 percent in 1996.
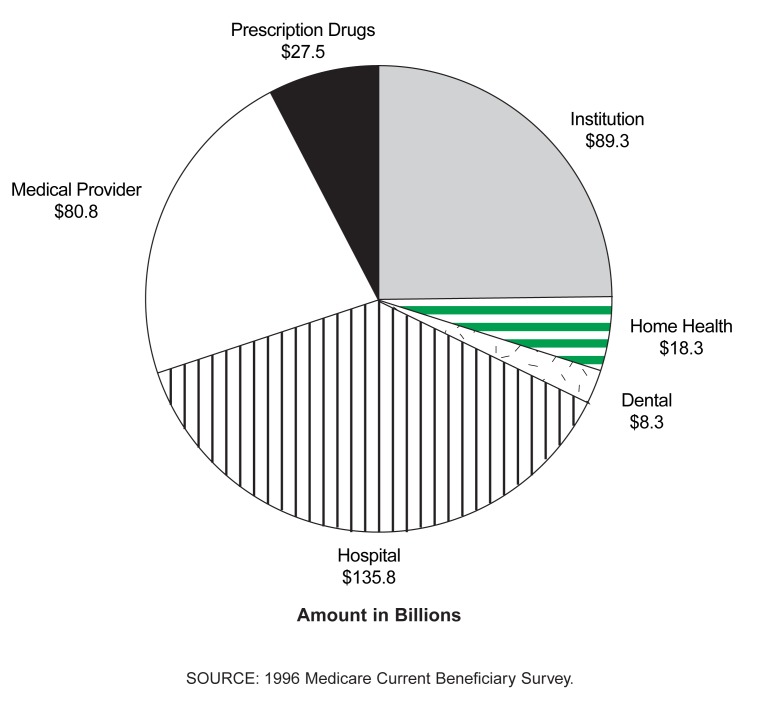
Figure 2. Medicare Health Care Expenditures, by Type of Service, 1996.
- The largest portion of health care dollars for Medicare beneficiaries is spent on hospital care (both inpatient and outpatient). Hospital care accounts for 38 percent of spending for the Medicare population and 39 percent of spending at the national level.
- While only 7 percent of Medicare beneficiaries spent some or all of the year in a skilled or long-term care facility in 1996, institutional costs for those beneficiaries were the second largest expense for the Medicare population. Nearly $90 million was spent for institutional care in 1996 for Medicare beneficiaries; $75 million was for long-term care.
- Prescription drug costs constitute about 7 percent of personal health costs for the Medicare population as well as the Nation.
Figure 3. Percent Distribution of Health Care Expenditures, by Payer, 1996.
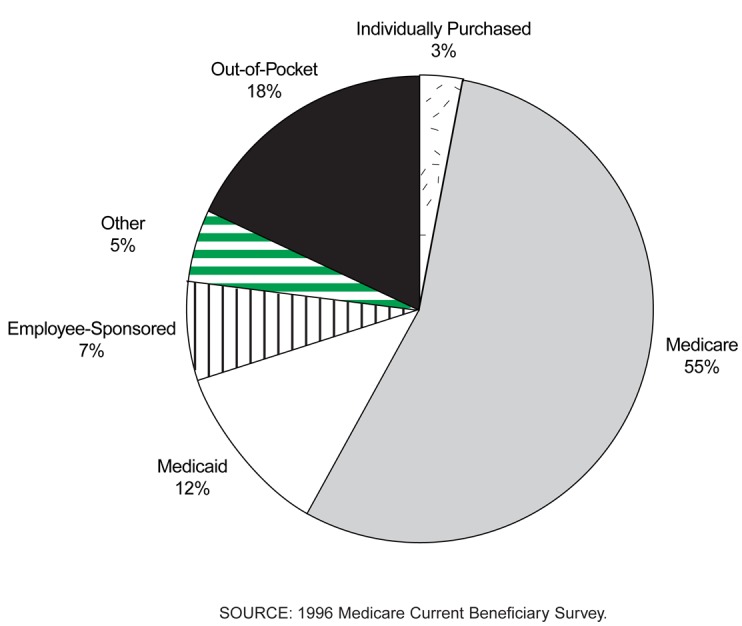
- Medicare pays for nearly 55 percent of beneficiaries' health care expenses while private insurers (medigap or employer-sponsored policies) pay for an additional 10 percent.
- Medicare beneficiaries pay for 18 percent of their personal health care costs out-of-pocket, about the same percentage that is paid out-of-pocket nationally.
- Medicaid pays for nearly 16 percent of the Nation's personal health care costs and 12 percent of Medicare beneficiaries' health care costs.
- Overall, public funding (Federal, State and local programs) pays for 45 percent of the Nation's personal health care costs and 72 percent of Medicare beneficiaries' health costs.
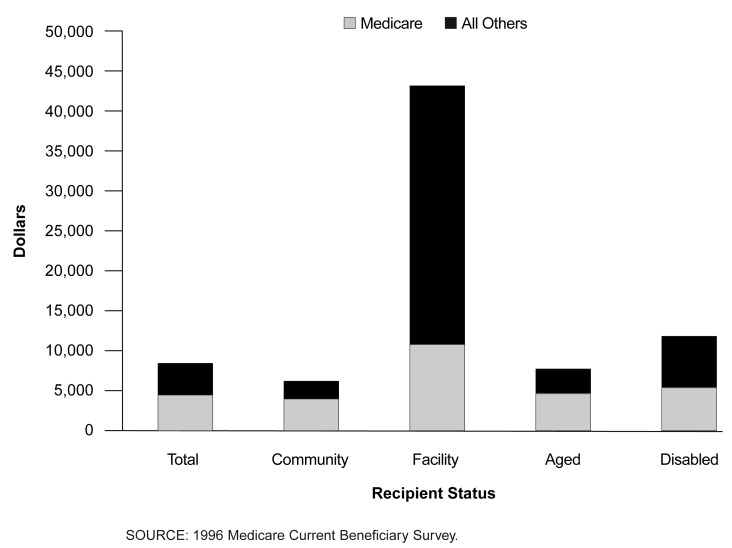
Figure 4. Per Capita Medicare Health Care Expenditures, by Recipient Status, 1996.
- In 1996, Medicare paid an average of $4,950 per beneficiary. Medicare paid an average of $4,565 for beneficiaries living in the community and $10,776 for beneficiaries living in skilled or long-term care facilities.
- Aged Medicare beneficiaries were slightly less expensive to the program than the disabled—$4,885 per capita for an aged beneficiary versus $5,431 per capita for a disabled beneficiary.
- Average total health costs were $9,100 per beneficiary in 1996 while beneficiaries living in the community had average costs of $6,900. Nationally, per capita costs were $3,400 in 1996.
- Beneficiaries living in facilities had the highest personal health care costs in 1996, averaging $42,900.
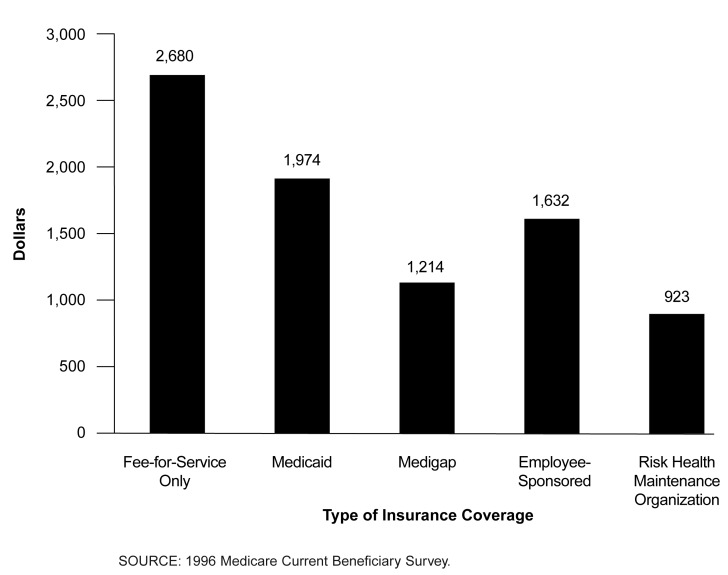
Figure 5. Per Capita Medicare Out-of-Pocket Expenses, by Type of Insurance Coverage, 1996.
- Beneficiaries in a Medicare risk health maintenance organization plan had the lowest out-of-pocket costs in 1996 averaging $923.
- Beneficiaries with no supplemental insurance (Medicare fee-for-service only) had average out-of-pocket costs of nearly $2,700—three times more than risk health maintenance organization members.
- Nationally, per capita out-of-pocket costs in 1996 were $650. Medicare beneficiaries spent an average $1,674 out-of-pocket—two and a half times greater than the national level.
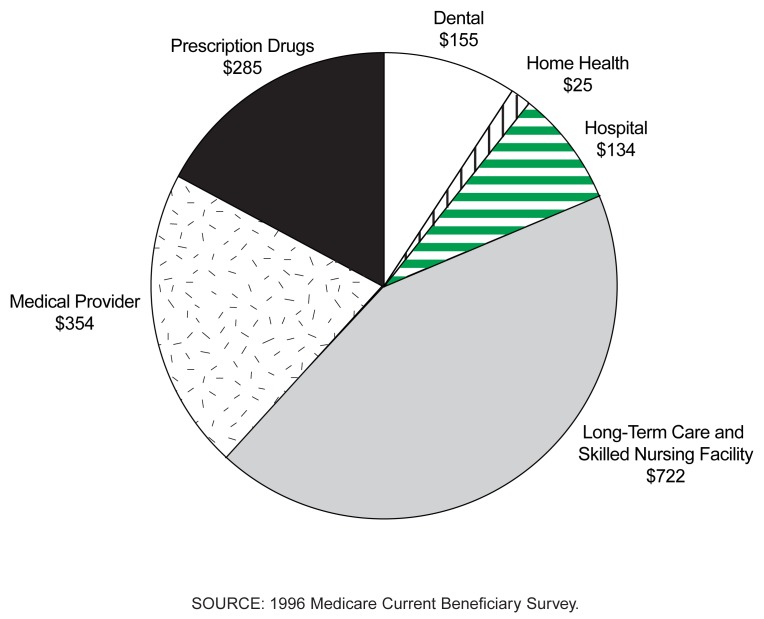
Figure 6. Per Capita Medicare Out-of-Pocket Expenses, by Type of Service, 1996.
- The largest out-of-pocket expense for Medicare beneficiaries in 1996 was for skilled or long-term facility care. This expense was disproportionately paid by the small percentage of beneficiaries living in long-term care facilities. Long-term care facilities, in many instances, can cost in excess of $1,000 per month.
- Medicare beneficiaries paid an average of $285 out-of-pocket on prescription drugs in 1996.
Footnotes
The authors are with the Office of Strategic Planning, Health Care Financing Administration (HCFA). The views expressed in this article are those of the authors and do not necessarily reflect the views of HCFA.
Reprint Requests: Lauren A. Murray, Office of Strategic Planning, Health Care Financing Administration, 7500 Security Boulevard, C3-17-07, Baltimore, MD 21244-1850. E-mail: lmurray@hcfa.gov


