Abstract
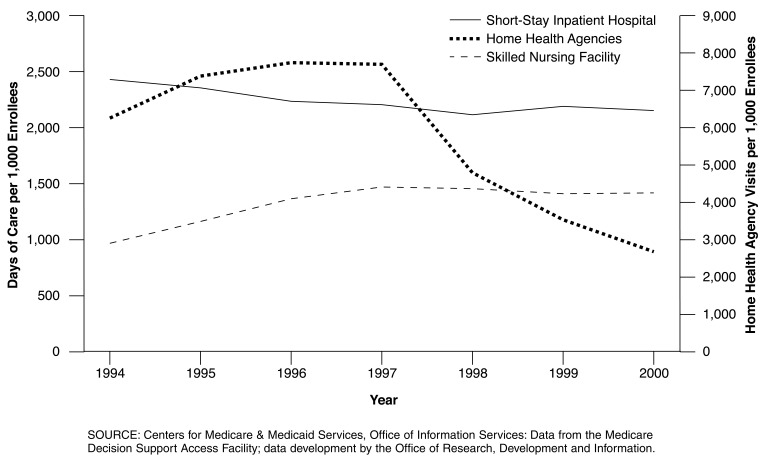
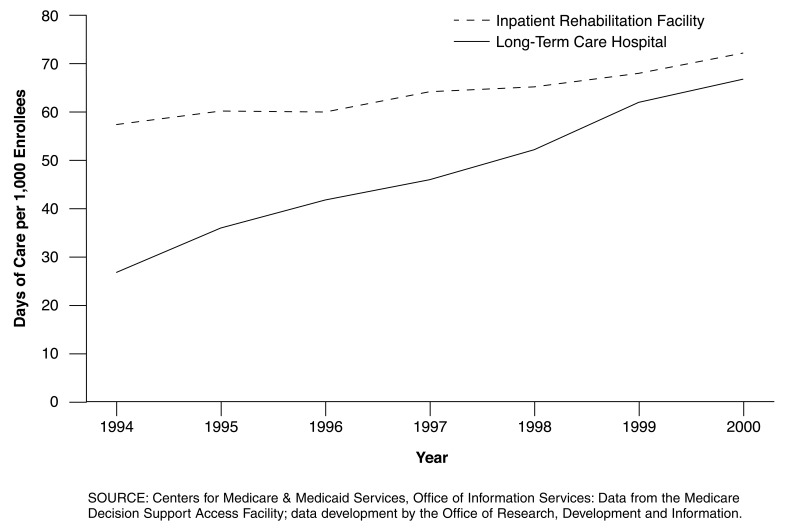
The Balanced Budget Act (BBA) of 1997 contained the most sweeping changes in payment policy for Medicare post-acute care (PAC) services ever enacted in a single piece of legislation. Research on the early impacts of these changes is now beginning to appear, and this issue of the Health Care Financing Review includes six articles covering a range of timely PAC issues. There are two articles on skilled nursing facility (SNF) care—the first by Chapin White, Steven D. Pizer, and Alan J. White and the second by Kathleen Dalton and Hilda A. Howard. These are followed by two articles on home health care by Harriet Komisar and Nelda McCall, Jodi Korb, Andrew Petersons, and Stanley Moore. The next article in this issue by Susan E. Bronskill, Sharon-Lise T. Normand, and Barbara J. McNeil examines PAC use for Medicare patients following acute myocardial infarction. The last article by Jerry Cromwell, Suzanne Donoghue, and Boyd H. Gilman considers methodological issues in expanding Medicare's definition of transfers from acute hospitals to include transfers to PAC settings. To help the reader understand the impacts of the BBA changes in payment policy, we present data on Medicare utilization trends from 1994-2000 for short-stay inpatient hospital care and each of the major PAC services—SNF, home health, inpatient rehabilitation, and long-term care hospital (Figures 1 and 2). Utilization is measured as the volume of services (days of care for the institutional settings and visits for home health) per 1,000 Medicare beneficiaries. Medicare managed care enrollees and their service utilization are excluded.
Expansion of PAC Services
PAC permits patients to shift from the acute short-stay hospital to less intensive and more appropriate settings as their recovery progresses. Prior to 1984, Medicare paid all providers of services across the acute-PAC spectrum on a retrospective cost basis, so that payment incentives had little effect on the distribution of services between and among acute and PAC settings. However, in 1984 the discharge-based prospective payment system (PPS) for acute short-stay hospitals gave hospitals an incentive to reduce lengths of stay and discharge patients either to home or PAC earlier than had been the case historically. In addition, hospitals that provided PAC services as well as acute care could generate additional Medicare revenue—paid at cost—by shifting patients to PAC care for services that previously would have been part of an acute hospital stay.
Payment incentives, combined with advances in technology, facilitated the shift from inpatient to outpatient settings and resulted in tremendous growth in Medicare payments for PAC services between 1984 and 1997. This growth was further stimulated by several court rulings in the mid-1980s, which in effect liberalized and expanded Medicare coverage for PAC services (Prospective Payment Assessment Commission, 1995). Acute hospital days per 1,000 Medicare beneficiaries declined between 1994 and 1997 while utilization rates for all PAC services rose sharply (Figures 1 and 2). Trends in Medicare spending also reflect these utilization changes. For example, the ratio of Medicare hospital expenditures to combined expenditures for skilled nursing and home health care fell from 20:1 to just over 3:1 between 1986 and 1996. Between 1990 and 1995, Medicare spending for home health services grew from $3.9 billion to $18.3 billion and skilled nursing care expenditures rose from $2.5 billion to $11.7 billion (U.S. Department of Health and Human Services, 1999).
Figure 1. Medicare Utilization Rates for Short-Stay Hospitals, Skilled Nursing Facilities, and Home Health Agencies: 1994-2000.
Figure 2. Medicare Utilization Rates for Inpatient Rehabilitation Facilities and Long-Term Care Hospitals: 1994-2000.
Closer examination of utilization patterns reveals that changes were occurring in both the proportion of Medicare beneficiaries using PAC services and the extent or intensity of use among those beneficiaries receiving these services. For example, hospitals were increasing the rate at which they transferred patients from acute hospital stays to PAC services (Cutler and Meara, 1999; Blewet, Kane, and Finch, 1996). In the case of SNFs, the increased (and earlier) transfer of patients from acute hospitals was accompanied by greater provision of ancillary services by SNFs and the rise of the so-called “subacute” SNF Between 1988 and 1996, SNF ancillary charges increased from 15 to 29 percent of total SNF charges (Prospective Payment Assessment Commission, 1997). During the same period, home health use and intensity rates also were increasing rapidly. The number of visits per user, particularly home health aide visits, rose faster than the use rate, which is consistent with other evidence that home health care was increasingly being provided for less intensive and chronic care needs (Prospective Payment Assessment Commission, 1995).
Using data from the pre-BBA period (1994-1995), Bronskill et al. examine the extent to which factors beyond patient characteristics, such as attributes of the discharging hospital and State factors, explained variations in PAC use (predominantly home health care) for a cohort of elderly Medicare patients with acute myocardial infarction. Their study is noteworthy for the richness of their patient data, which allowed them to control for differences in clinical severity at both hospital admission and discharge. They find that for-profit ownership and provision of home health care by the discharging hospital were important predictors of PAC use.
One response of the BBA to earlier hospital-PAC transfers was the expansion of the hospital transfer payment policy. Under the expanded policy, acute care hospitals do not receive a full diagnosis-related group (DRG) payment for shorter than average inpatient stays in 10 DRGs when these short-stay cases are transferred to PAC providers. Instead, the hospital receives a per diem payment that is less than the full DRG payment. In their article, Cromwell et al. evaluate criteria for selecting DRGs subject to the PAC transfer provision, and consider the pros and cons of expanding the policy to additional DRGs. They note that the pervasive trend towards shorter acute stays limits the policy's effectiveness. For example, the Medicare acute care length of stay declined steadily from 7.5 days in 1994 to 6.0 days in 2000.
Prospective Payment for PAC Providers
To soften the payment incentive to shift care to cost-based PAC settings, the BBA mandated new PPSs for all major PAC provider groups. The systems vary widely in key design features (e.g., the unit of payment), timing of implementation, and fiscal stringency.
The SNF PPS was the first of these systems to be implemented (October 1998). It is a case-mix adjusted per diem system based on 44 resource utilization groups (RUGs). As previously noted, one consequence of the trend toward earlier hospital discharges to SNFs was an increase in the importance of ancillary services among total SNF costs. In their article, White et al. demonstrate the importance of non-therapy ancillary costs in explaining variation in total per diem SNF cost and suggest ways that the RUGs could be refined to capture this source of variation.
Designed by law to restrain spending, the SNF PPS rates were based on 1995 costs rolled forward to 1998 by less than full input price increases (market basket minus one percentage point). In addition, the higher costs of hospital-based SNFs were only partially reflected in the rates. Figure 1 shows that SNF utilization growth flattened out concurrently with the implementation of the SNF PPS. Dalton and Howard examine the impact of SNF PPS on market entry and exit by SNFs. They find that 12 years of steady growth ceased in 1998, but that net reductions were largely confined to hospital-based SNFs. Reductions were more likely in areas with higher bed-to-population ratios prior to PPS, and in areas with recent expansions in capacity.
The BBA placed home health agencies (HHAs) immediately on an interim payment system (IPS) until a PPS could be developed. The IPS continued per visit payment, but tightened the existing per visit cost limits and instituted a new agency-specific limit on per beneficiary cost that ratcheted down payment for most agencies. Figure 1 shows the dramatic reductions in home health care utilization. The articles by Komisar and McCall et al. examine the reductions in home health services that resulted under the IPS. Komisar focuses on changes in the mix of types of visits (home health aide visits fell disproportionately). McCall et al. explore the impact of the utilization reductions on particular utilization-defined outcomes (various measures of admission to either an acute care hospital or a SNF). They found no evidence supporting a connection between the sharp contraction in home health utilization and an increase in potentially adverse outcomes.
The HHA PPS, based on 60-day episodes classified into one of 80 home health resource groups, was implemented in October 2000. Reflecting serious congressional concern over the rapid home health spending growth of the early 1990s, the HHA PPS was mandated to constrain aggregate spending under the PPS to reflect a 15-percent reduction in the IPS cost limits. Largely as a consequence of the strong impact of the IPS on home health utilization, implementation of the 15-percent reduction was subsequently delayed until 2003.
The BBA also mandated PPSs for inpatient rehabilitation facilities (IRFs) and long-term care hospitals (LTCHs). However, in 1997 new payment systems for these providers were years away from implementation, and IRFs and LTCHs remained on cost-based payment systems while SNFs and HHAs moved to PPS. During this period, the use of IRFs and LTCHs rose steadily (Figure 2). The IRF PPS and the LTCH PPS were implemented in 2002. Both systems pay on a per discharge basis, but the IRF PPS uses its own rehabilitation case mix groups, whereas the LTCH PPS uses essentially the same DRGs as the acute inpatient hospital PPS (although with its own LTCH relative weights).
Future PAC Research
In addition to providing results about the impact of the changes in PAC payment policy mandated by the BBA, the articles in this issue indicate potential directions for future PAC research. For example, several of these articles demonstrate that PAC providers have been highly responsive to financial and market incentives. Bronskill et al. showed that, even when it is possible to control for differences in patient severity, provider and market characteristics are important determinants of PAC service provision. Dalton and Howard found that there was a quick market response to the implementation of the SNF PPS, and the home health articles (both Komisar and McCall et al.) have documented the changing volume and mix of home health care provided in response to the IPS. McCall et al. examines whether adverse outcomes resulted from the dramatic reductions in home health utilization, and one of the greatest challenges for future research will be to assess the impact of the BBA changes on PAC outcomes and quality.
Future research will need to pay special attention to the responses of PAC providers across potentially substitutable settings. There are several reasons why interactions among settings are likely to be important. First, due to the different implementation dates of the various PPSs, fiscal pressure has and will continue to vary across settings over time. For example, when the relatively fiscally stringent SNF PPS and the home health IPS were implemented, IRFs and LTCHs continued to be paid on a cost basis. At least some of the utilization growth in IRF and LTCH services between 1997-1998 and 2000 may reflect a shift of services from SNF and home health care. Even when all PAC PPSs have been implemented, fiscal stringency may change over time and vary across systems depending on how annual updates are applied to the payment rates of each system. Second, fiscal pressure will vary among providers within each PPS system. This variation is a consequence of the fact that PPS payment rates are based on averages. For better or worse, fiscal pressure will vary among providers depending on how appropriately case mix, input price, and other payment factors adjust the base average payment amounts. As already observed in the case of SNFs, high cost hospital-based PAC providers are likely to experience substantial fiscal pressure compared to freestanding providers. Finally, there may be relative price effects if substantially different payments are made for highly similar services in different service settings.
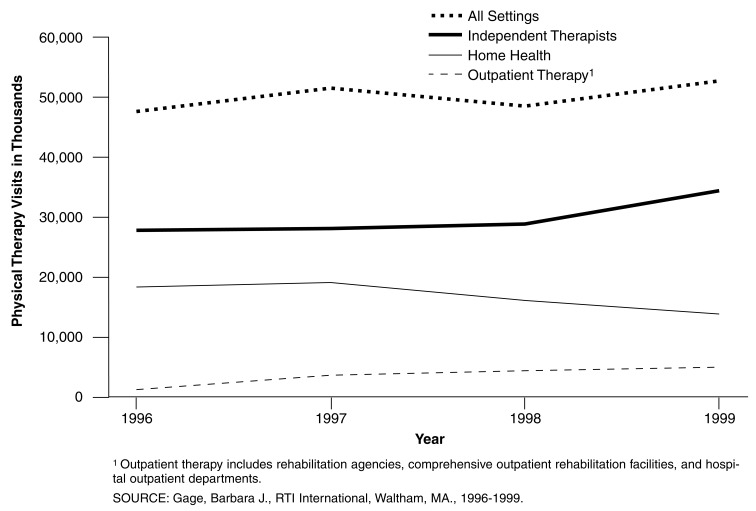
Rehabilitation therapy services may be especially sensitive to these effects since they are provided in all PAC (and other ambulatory) settings. In addition, therapy services receive substantially higher payment than non-therapy services in the SNF and HHA PPSs. Figure 3 shows trends in the number of physical therapy visits among different settings between 1996 and 1999. The data suggest that shifts among sites of care may have already taken place post-BBA between home health and other ambulatory settings (rehabilitation agencies, comprehensive outpatient rehabilitation facilities, hospital outpatient departments, and independent therapists).
Figure 3. Trends in Physical Therapy Visits: 1996-1999.
In 1996, independent therapists provided 60 percent of all physical therapy services, exceeding home health agencies which provided much of the other 40 percent of visits (Figure 3). However, after the BBA, the utilization trends diverge dramatically. Home health physical therapy provision declined to only 27 percent of all physical therapy visits by 1999. Concurrent with the declines in home health provision of physical therapy, therapy use in outpatient providers increased dramatically, accounting for 73 percent of all physical therapy visits in 1999. Similar shifts occurred in the provision of occupational therapy services as well.
Of course, it should be noted that while these comparative trends are suggestive of shifting sites of care as a result of changes in payment policy, this simple analysis cannot rule out the possibility that the observed changes are due to other factors. This example is one of many potentially interesting topics for additional research in the coming years as data become available and experience evolves under the new BBA payment systems.
Footnotes
Philip G. Cotterill is with the Centers for Medicare & Medicaid Services (CMS). Barbara Gage is with RTI International. The views expressed in this article are those of the authors and do not necessarily reflect the views of CMS or RTI International.
Reprint Requests: Philip G. Cotterill, Ph.D., Centers for Medicare & Medicaid Services, Office of Research, Development, and Information, 7500 Security Boulevard, C3-21-28, Baltimore, MD 21244-1850. E-mail: pcotterill@cms.hhs.gov
References
- Blewett LA, Kane RL, Finch M. Hospital Ownership of Post-Acute Care: Does It Increase Access to Post-Acute Care Services? Inquiry. 1995/1996 Winter;32(4):457–467. [PubMed] [Google Scholar]
- Cutler DM, Meara E. The Concentration of Medical Spending: An Update. National Bureau of Economic Research Working Paper #7279. 1999 Aug; [Google Scholar]
- Prospective Payment Assessment Commission. Medicare and the American Health Care System. Washington, DC.: Jun, 1995. Report to Congress. [Google Scholar]
- Prospective Payment Assessment Commission. Medicare and the American Health Care System. Washington, DC.: Jun, 1997. Report to Congress. [Google Scholar]
- U.S. Department of Health and Human Services, Assistant Secretary of Planning and Evaluation. Medicare's Post-Acute Care Benefit: Background, Trends and Issues to be Faced. U.S. Government Printing Office; Washington, DC.: 1999. [Google Scholar]


