Introduction
Demographic projections made in the 1980s suggested that the aging of the population would produce a surge in the number of persons needing long-term facility care as we approached the year 2000. Based on the existing stock of nursing home beds, it appeared that there would be a shortage of beds to accommodate these persons. However, this expected large increase in the number of nursing home patients did not materialize. Findings from the National Nursing Home Survey (National Center for Health Statistics, 2003) suggested that elderly use of nursing homes actually declined between 1985 and 1995 (Bishop, 1999).
One explanation for this decline seems to lie in an important supply side trend occurring in the U.S. long-term care (LTC) system. During the past 10 to 15 years, an increasing number of elderly persons began living in settings that are neither traditional home settings nor traditional nursing homes. There has been a proliferation of facility-like residential alternatives to nursing homes. These settings go by various names including assisted living facilities, continuing care facilities, retirement communities, staged living communities, age-limited communities, etc. For simplicity in this article we will refer to all these types of living arrangements as elderly group residential arrangements (EGRAs).
Because of the way that traditional LTC facility survey samples have been selected, persons living in these EGRAs were often counted as community residents, not LTC facility residents. If an increasing proportion of the elderly are entering a new class of residential alternatives to the nursing home, and these new facilities are falling outside the traditional LTC facility sampling frameworks, it seems to explain why we are seeing a lesser number of persons in traditional nursing homes.
Facility Sample
Several government-sponsored LTC facility surveys, such as the National Nursing Home Survey or the Institutional Medical Expenditure Survey (Agency for Healthcare Research and Quality, 2003), use a master list of LTC facilities to select their samples. The disadvantage of using this approach is that these master lists, which usually consist of facilities which are either Medicare or Medicaid certified or State licensed, tend to underrepresent smaller facilities and newer forms of long-term institutional care such as assisted living facilities or other EGRAs.
The Medicare Current Beneficiary Survey (MCBS) does not draw its LTC facility sample from a master facility list. It uses a person-based sample drawn from the Medicare Enrollment Files. The sampled beneficiaries are interviewed wherever they are found, including EGRAs that would not necessarily appear on State-licensed facility lists. The advantage of this approach is that we get a more complete picture of the types of LTC residential places where Medicare beneficiaries live. One difficulty with this approach, however, is that it is hard to find a basis to create meaningful and coherent facility categories. This lower level residential care sector is changing very fast and very similar places may be called by very different names. Determining the right set of questions to ask to elicit useful information about these highly variable EGRAs is a challenge.
LTC Facility Distribution
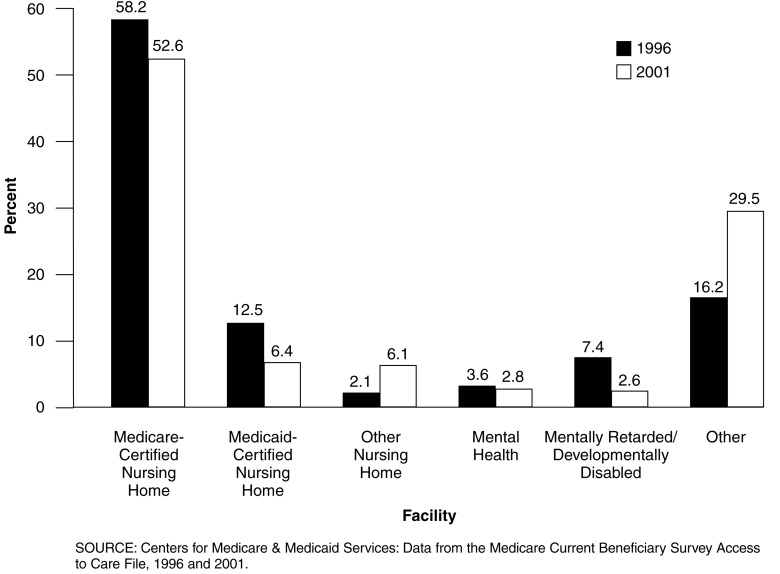
Figure 1 compares the distribution of Medicare LTC beneficiaries by type of facility for the years 1996 and 2001. While certified nursing homes still constitute the bulk of LTC facilities, the proportion of beneficiaries residing in this type of setting fell considerably over a 5-year period. In 1996, 70 percent of Medicare persons living in LTC facilities resided in either a Medicare- or Medicaid-certified nursing home. In 2001, that number dropped to 59 percent. Over the same period however, the percentage of Medicare persons living in other facilities (the previously defined EGRAs) almost doubled as it rose from 16 percent in 1996 to 30 percent in 2001.
Figure 1. Distribution of Medicare Long-Term Care Facility Beneficiaries: 1996 and 2001.
However, this does not fully explain the missing elderly question. While new forms of non-traditional facilities are growing, they are not growing fast enough to offset the decline in nursing home residents. Medicare beneficiaries residing in a LTC facility represented 7.3 percent of the Medicare population in 1996 (McCormick and Chulis, 2000). In 2001, they comprised only 5.2 percent of Medicare enrollees. This suggested we needed to look more carefully at community residents.
Group Residential Arrangements
When organized residential arrangements are near the lower end of the health acuity continuum, it is not always clear where LTC facilities end and community housing begins. MCBS' definition of a LTC facility is fairly broad. To be a LTC facility in the MCBS there must be three or more beds and certification by Medicare or Medicaid or be licensed as a nursing home or other LTC facility or provide at least one personal care service or provide 24 hour 7 day a week supervision by a caregiver. Many of the EGRAs meet these qualifications and are grouped with other LTC facilities.
However, there is a considerable number of additional very similar EGRAs that house Medicare persons. These places were generally not classified as LTC facilities in the MCBS. Sometimes these places are licensed by the State in which they are located, but many operate so as not to be subject to the State licensing and regulations that apply to nursing homes. These community EGRAs generally have the same names as their LTC facility counterparts. That is, they are called assisted living facilities, continuing care communities, health graded housing arrangements, retirement homes and apartments, elderly homes, etc.
In order to get more information about persons who were in these community EGRAs, we added new questions to the MCBS housing module. These questions went into the field in September 2001. The main objective was to estimate how many elderly persons were living in EGRAs that did not meet the formal LTC facility definition, but were clearly not traditional homes, apartments, or condominiums.
First-Year Results
One of the most interesting findings from these new questions was that the number of community persons who said they lived in EGRAs (5.3 percent of Medicare persons) is slightly larger than the number of persons living in all types of formal LTC facilities (5.2 percent of Medicare persons). Persons who would have formerly entered nursing homes and other traditional LTC facilities are finding a way to stay in the community, not necessarily in traditional community settings, but rather in organized elderly group residential arrangements (community EGRAs).
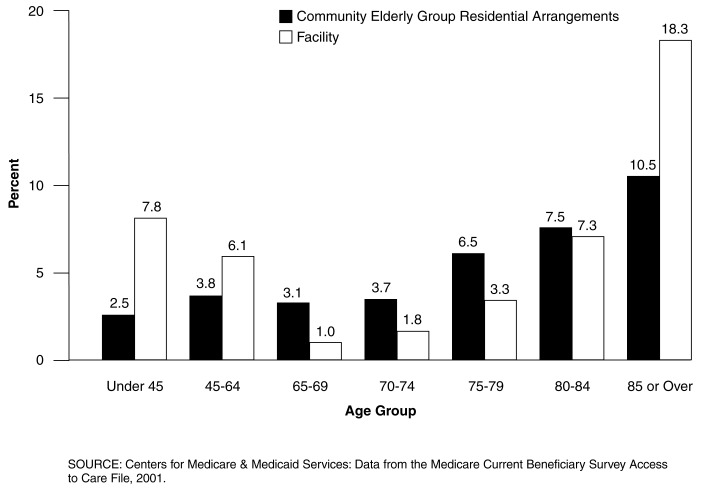
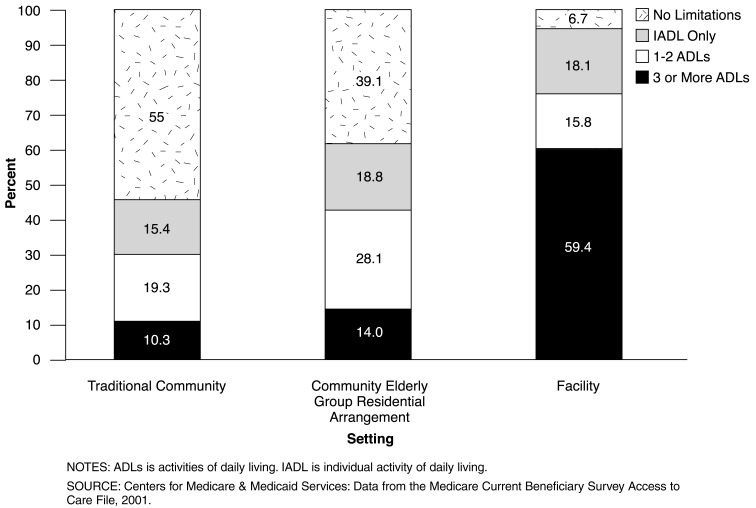
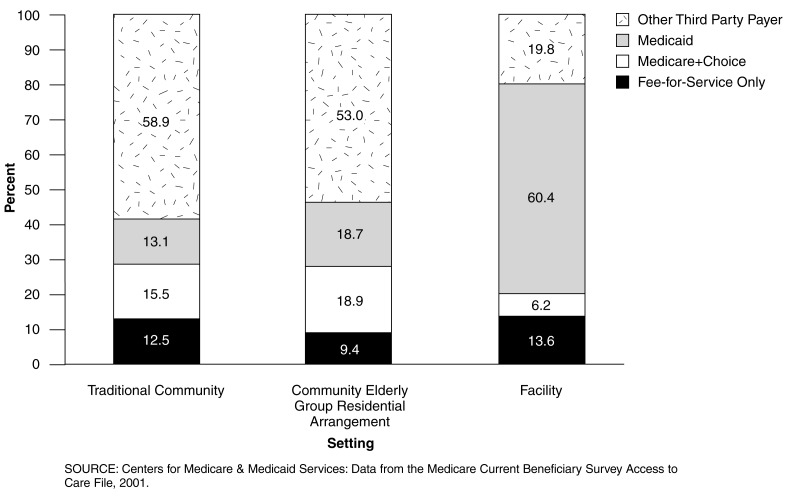
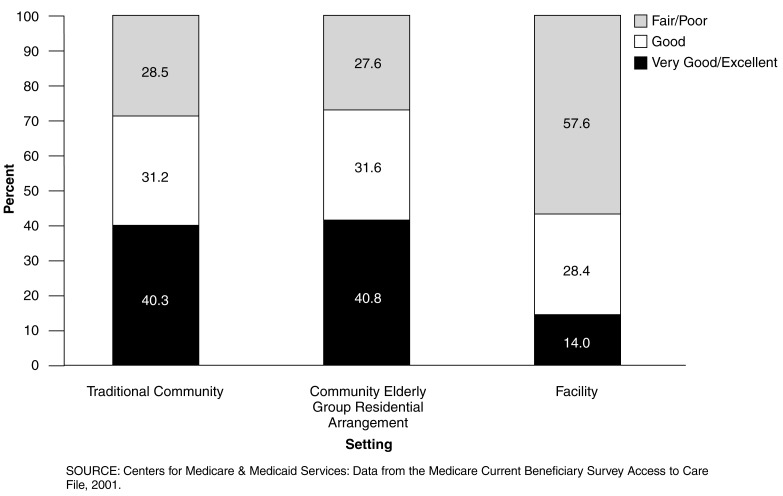
The population residing in community EGRAs appears to be distinct from either that in traditional community or LTC settings. Figure 2 compares age distributions for those in community EGRAs with Medicare persons in LTC facilities. For age groups 65 or over, LTC facilities have only a greater proportion of their residents in the 85 or over category. This suggests that beneficiaries are substituting care from a community EGRA instead of going into a LTC facility until they require a higher level of care. Figures 3-5 compare the populations of the traditional community setting, community EGRAs, and LTC facilities. Examining functional limitations, a clear trend in declining health is seen as people move from traditional community into community EGRAs and then into LTC facilities (Figure 3). Figure 4 shows that in terms of self-assessed health status, the traditional community and the community EGRA populations are almost identical, both of which reported better health than the LTC facility population. Figure 5 shows that individuals who move from the community setting into a LTC setting become more dependent on Medicaid and less on other third-party payers for their health care expenses.
Figure 2. Medicare Enrollees in Community Elderly Group Residences and Long-Term Care Facilities, by Age Group: 2001.
Figure 3. Medicare Enrollees with Functional Limitation, by Residential Setting: 2001.
Figure 5. Distribution of Medicare Enrollees by Third-Party Insurance, by Residential Setting: 2001.
Figure 4. Medicare Enrollees by General Health Status, by Residential Setting: 2001.
Footnotes
The authors are with the Centers for Medicare & Medicaid Services (CMS). The views expressed in this article are those of the authors and do not necessarily reflect the views of CMS.
Reprint Requests: Chris McCormick, Centers for Medicare & Medicaid Services, Office of Research, Development, and Information, 7500 Security Boulevard, C-3-16-27, Baltimore, MD 21244-1850. E-mail: cmccormick@cms.hhs.gov
References
- Agency for Healthcare Research and Quality. Medicare Expenditure Panel Survey. Internet address: www.meps.ahrq.gov (Accessed 2003.)
- National Center for Health Statistics. National Nursing Home Survey. Internet address: www.cdc.gov/nchs/about/major/nnhsd/nnhsd.html (Accessed 2003.)
- Bishop CE. Where are the Missing Elders? The Decline in Nursing Home Use, 1985 and 1995. Health Affairs. 1999 Jul-Aug;18(4):146–155. doi: 10.1377/hlthaff.18.4.146. [DOI] [PubMed] [Google Scholar]
- McCormick JC, Chulis GS. Characteristics of Medicare Persons In Long-Term Care Facilities. Health Care Financing Review. 2000 Winter;22(2):175–179. [PMC free article] [PubMed] [Google Scholar]


