Abstract
Prior research has shown that prescription drug spending grew substantially during the decade of the 1990s. This analysis uses 1996 to 1998 State Medicaid Research File (SMRF) fee-for-service (FFS) data for 29 participating States to provide insight into the factors driving this growth. The analysis examines cost variation by census region, State, Medicaid basis of eligibility, and therapeutic use of drugs. In 1998, the highest expenditures were for central nervous system (CNS) drugs and for anti-psychotics compared to three other groups of CNS drugs (anti-anxiety agents, anti-depressants, and hypnotics). By eligibility group, expenditures were typically highest for disabled enrollees. There were major variations among SMRF States and their respective regions.
Introduction
In this article, we present Medicaid prescription drug spending on CNS drugs for 29 States for which SMRF data are available in 1998. The SMRF prescription drug records include coding that allowed us to analyze prescription drug utilization and spending by therapeutic use. Because there is substantial variation in Medicaid Program characteristics across States, we did not attempt to estimate national Medicaid utilization and spending for CNS drugs.
In other research we have shown that national Medicaid prescription drug spending grew from $4.4 billion in 1990 to over $20 billion in 2000, representing an average annual increase of 16.3 percent during the decade. The average annual increase was even greater for the disabled at over 20 percent. We found that the percentage of total Medicaid prescription drug payments for the disabled increased from just over 40 percent to nearly 60 percent during those 10 years. We also showed that the disabled and aged eligibility groups represented a disproportionate share of total drug spending. Together, these 2 groups represented only 29.1 percent of Medicaid drug recipients in FY 2000, but they accounted for 84.9 percent of Medicaid drug payments. By therapeutic category, the largest percentage of total Medicaid prescription drug payments (17 percent in 1997) was for CNS drugs (Baugh et al., 2004). The statistics presented here were produced to develop a better understanding about the factors driving Medicaid prescription drug spending variations.
The tables and figures use 1998 data for all 29 of the States available in the SMRF data (Centers for Medicare & Medicaid Services, 2003). They present data on prescription drug recipients, number of prescriptions and Medicaid payments for drugs by eligibility group, therapeutic category, and group and individual State.
In the tables and figures, Medicaid eligibility is presented for four major eligibility groups: aged, disabled, adults, and children.The disabled group includes beneficiaries of any age who were determined to be eligible because of disability or blindness. The children's group includes foster care and adoptive services children. There were a small number of beneficiaries with unknown basis of eligibility that is not reported.
The data are presented for all of the Medi-Span therapeutic categories (Wolters Kluwer Health, 2003) in Figures 1 and 2. In Figures 3 through 11, data are presented by four of the Medi-Span therapeutic groups (anti-anxiety agents, anti-depressants, anti-psychotics, and hypnotics) within the CNS category. Additionally, data for individual SMRF States are presented within their respective regions in Figures 10 and 11. Tables 1 and 2 provide detailed information on CNS drug payments, number of prescriptions by State and basis of eligibility. Table 3 provides further detail on drug payments number of prescriptions, and drug recipients for the four CNS drug groups.
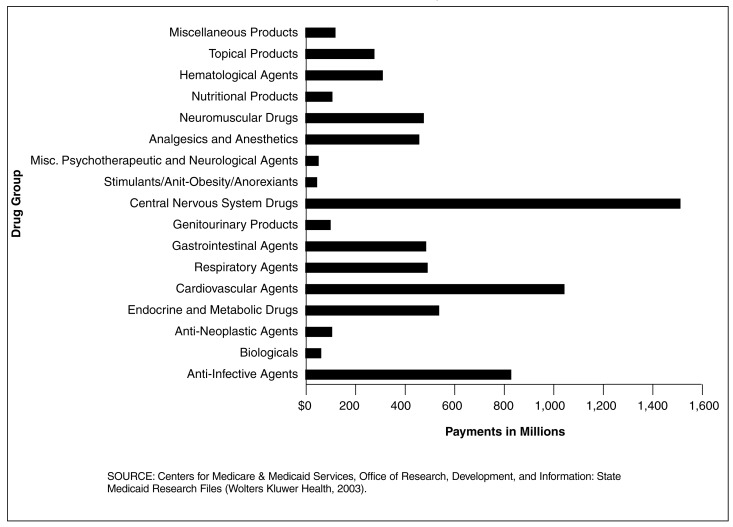
Figure 1. Medicaid Prescription Drug Payments for 29 SMRF States All Eligibles, by Drug Category: 1998.
Central Nervous System (CNS) Drug Payments Exceeded $1.5 Billion in the 29 SMRF States
- For all four eligibility groups, CNS drug payments were over 48 percent greater than the second highest drug category, cardiovascular agents.
- Even though CNS drug payments exceeded payments for all other drug groups, the number of CNS prescriptions dispensed was not the highest. Prescriptions dispensed for cardiovascular agents outpaced CNS drugs 31.4 to 24.8 million.
- Medicaid payment per prescription for all eligibles in 1998 for these 29 States was highest, by an overwhelming margin, for biologicals at nearly $590 each (data not shown). Of the 17 drug groups, 15 averaged under $82 per perscription. In this comparison, CNS drug payments per prescription was comparable to most of the other groups and did not exhibit atypical cost averages.
- In 1998, the disabled eligibility group constituted a 55.3 percent share of the total Medicaid prescription drug payments (data not shown). The trend has shown yearly increases since at least 1990 when the disabled's share of drug payments was 42.2 percent of the total, an amount higher than any of the other three eligibility groups. This study highlights the increasingly important impact of the disabled on Medicaid payments and CNS drug use.
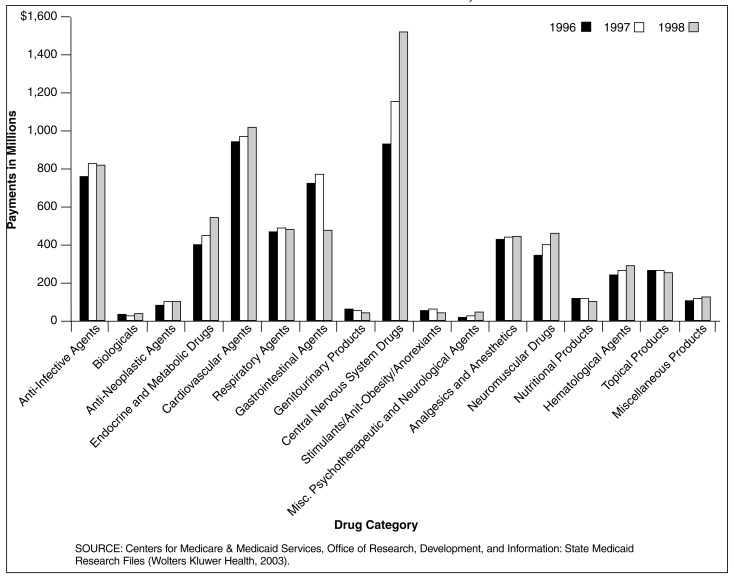
Figure 2. Medicaid Prescription Drug Payments for 29 SMRF States, by Drug Category: 1996-1998.
Total Medicaid Payments for Central Nervous System (CNS) Prescription Drugs Grew Phenomenally from 1996 to 1998 for the 29 SMRF States
- The explosive growth rate in payments for CNS drugs is evidenced by consecutive year increases. The 26.2 percent increase from 1996 to 1997 was shadowed by an even larger 29.9 percent jump in 1998.
- CNS drug payments increased by 63.9 percent in the 2-year period ending in 1998 and exceeded $1,511 million. This increase was second only to the 238.8 percent growth in payments in miscellaneous psychotherapeutic and neurological agents which reached only $46 million.
- In the same time period, payments for all drug categories increased by 13.6 percent to $6,907 million in 1998 in these 29 SMRF States. At a rate of growth of more than 4½ times that of the average for all drug categories, CNS drug payments were a major driver in the cost of the Medicaid Program for all Americans.
- No other drug category exhibited such a marked impact on total Medicaid drug payments in such a short period as did CNS drugs. Ten of the drug groups demonstrated either modest growth or declines; but CNS drug payments rose sharply in both years. Should this trend persist, CNS drug payments will continue to have a tremendous impact on the future of Medicaid spending.
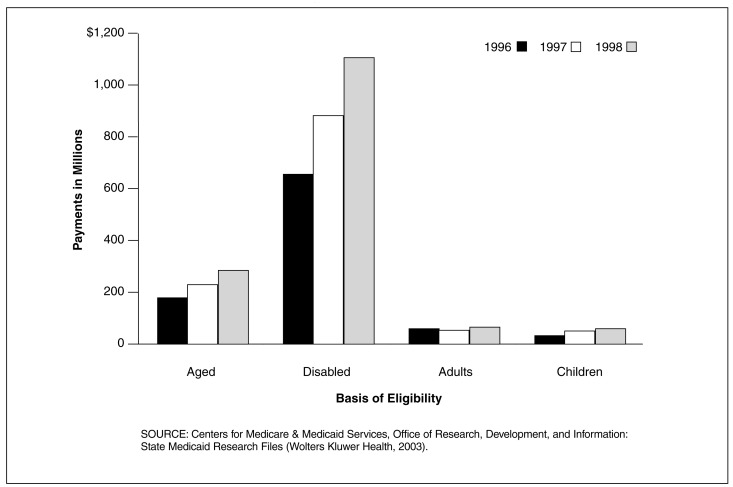
Figure 3. Medicaid Central Nervous System (CNS) Drug Payments for 29 SMRF States, by Basis of Eligibility: 1996-1998.
In the 29 SMRF States, the Disabled had the Largest Share of CNS Drug Payments
- The disabled had $658 million in CNS drug payments in 1996, $840 million in 1997, and $1,102 million in 1998. The disabled had the largest share of CNS drug payments for all 3 years.
- The largest change in share was a modest increase for the disabled which experienced an increase from 71.4 percent of the total spending for CNS drugs in 1996 to 72.9 percent in 1998.
- From 1996 to 1998 there was virtually no shift in the share of payments for CNS prescription drugs based on eligibility. The aged received about 19 percent, the disabled received about 72 percent, adults received about 5.5 percent and children received only 3.2 percent.
- By no means should these seemingly mild changes in spending shares indicate that CNS drug spending is under control. The unchanging nature of the share of payments may actually be a concern for the Medicaid Program since payments for these years may serve as indicators that high CNS payments could burden Medicaid for the foreseeable future. The breakdown of payments by basis of eligibility for these 3 years merely indicates how CNS drug payments have been channeled to these 4 segments of the population.
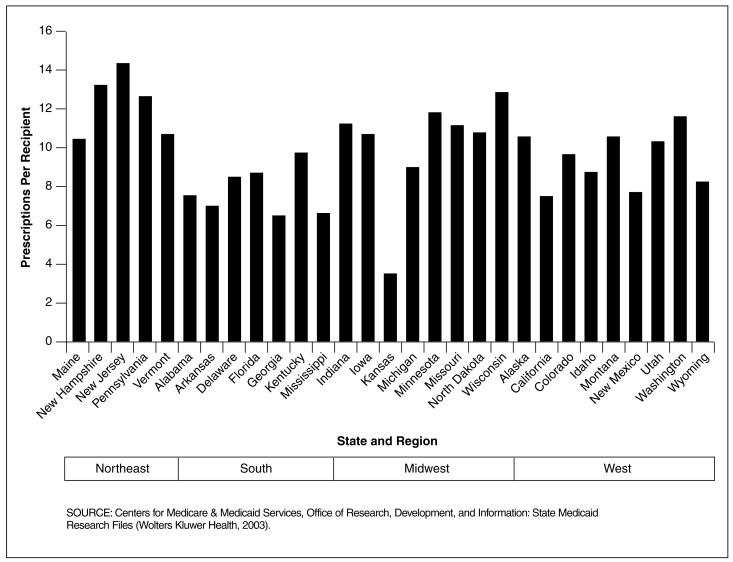
Figure 11. Medicaid Central Nervous System (CNS) Prescriptions Per Recipient, for 29 SMRF States Within U.S. Census Regions: 1998.
Prescriptions Per Recipient for CNS Agents Showed Marked Variation Across Regions
- The Northeast region had the highest number of dispensed prescriptions per recipient for CNS agents and the South had the lowest. By State, New Jersey had the highest prescriptions per recipient for CNS agents at 14 prescriptions per recipient followed by New Hampshire at 13 prescriptions per recipient. Kansas had the lowest number of dispensed prescriptions per recipient for CNS agents at 4 prescriptions per recipient.
- By drug group (data not shown), anti-anxiety agents had the highest number of dispensed prescriptions per recipient in Kentucky; anti-depressants had the highest prescriptions per recipient in Pennsylvania; anti-psychotics had the highest prescriptions per recipient in New Hampshire; and hypnotics had the highest prescriptions per recipient in Kentucky.
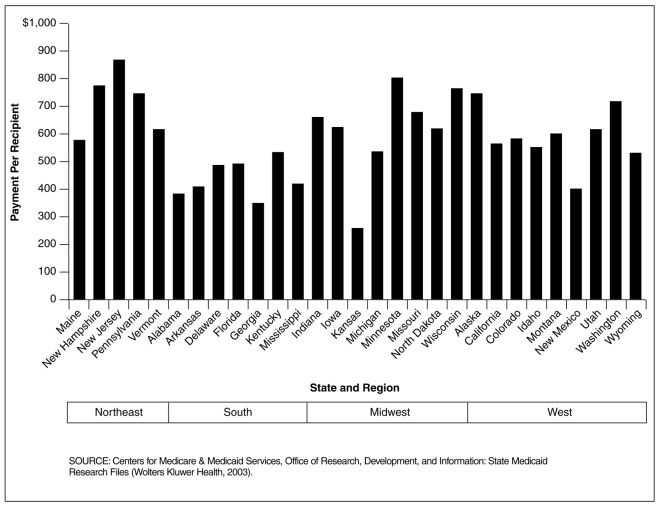
Figure 10. Medicaid Central Nervous System (CNS) Drug Payment Per Recipient for 29 SMRF States Within U.S. Census Regions: 1998.
Drug Payment Per Recipient for CNS Agents Varied Greatly Across Regions
- The Northeast region had the highest payment per recipient for CNS agents. In contrast, the South had the lowest. By State, New Jersey had the highest payment per recipient for CNS agents at $866 per recipient followed by Minnesota at $802 per recipent. Kansas had the lowest payment per recipient for CNS agents at $258 per recipient.
- By drug group (data not shown), anti-psychotics had the highest payment per recipient for all regions followed by anti-depressants. Hypnotics had the lowest payment per recipient for all regions.
Table 1. Medicaid Central Nervous System Drug Prescriptions for 29 SMRF States, by Basis of Eligibility: 1998.
| State | Basis of Eligibility1 | ||||
|---|---|---|---|---|---|
|
| |||||
| Aged | Disabled | Adults | Children | Total | |
|
| |||||
| Number of Prescriptions 2 | |||||
| Alabama | 171,947 | 504,090 | 21,628 | 29,080 | 726,745 |
| Alaska | 14,938 | 57,966 | 19,740 | 7,884 | 100,528 |
| Arkansas | 168,518 | 277,592 | 20,818 | 37,310 | 504,238 |
| California | 711,050 | 3,035,654 | 237,501 | 137,803 | 4,122,009 |
| Colorado | 136,643 | 236,098 | 18,384 | 25,501 | 416,642 |
| Delaware | 22,269 | 67,156 | 37,825 | 7,338 | 134,588 |
| Florida | 766,658 | 1,607,891 | 130,075 | 78,286 | 2,583,962 |
| Georgia | 258,379 | 701,627 | 76,746 | 82,893 | 1,119,645 |
| Idaho | 38,329 | 97,648 | 12,570 | 7,944 | 156,500 |
| Indiana | 405,514 | 632,326 | 46,661 | 77,296 | 1,161,797 |
| Iowa | 196,453 | 347,691 | 55,094 | 51,389 | 650,627 |
| Kansas | 121,809 | 220,008 | 18,279 | 36,046 | 396,142 |
| Kentucky | 281,661 | 705,378 | 62,725 | 38,492 | 1,088,256 |
| Maine | 122,442 | 294,946 | 43,276 | 27,109 | 487,773 |
| Michigan | 314,254 | 797,577 | 80,521 | 51,202 | 1,243,555 |
| Minnesota | 175,263 | 553,531 | 34,927 | 30,500 | 794,269 |
| Missouri | 471,605 | 819,058 | 48,636 | 58,986 | 1,398,285 |
| Mississippi | 171,817 | 370,791 | 13,963 | 21,544 | 578,122 |
| Montana | 41,782 | 91,775 | 24,470 | 14,447 | 172,474 |
| New Hampshire | 81,801 | 149,197 | 30,792 | 22,205 | 284,023 |
| New Jersey | 305,276 | 871,779 | 11,479 | 24,812 | 1,213,346 |
| New Mexico | 44,840 | 84,471 | 4,456 | 4,651 | 138,418 |
| North Dakota | 48,596 | 55,052 | 8,640 | 9,470 | 121,761 |
| Pennsylvania | 882,389 | 1,235,475 | 100,090 | 92,077 | 2,310,031 |
| Utah | 55,015 | 183,466 | 49,288 | 29,469 | 317,238 |
| Vermont | 63,063 | 115,290 | 8,895 | 6,295 | 193,553 |
| Washington | 313,891 | 805,026 | 26,117 | 16,452 | 1,161,486 |
| Wisconsin | 312,086 | 770,476 | 11,362 | 21,238 | 1,115,162 |
| Wyoming | 17,505 | 31,165 | 6,060 | 6,023 | 60,753 |
The Medicaid eligibility group identifies the basis on which Medicaid eligibility was determined, regardless of cash assistance status. The disabled group includes individuals of any age who were determined to be eligible because of disability or blindness. The children's group includes foster care and adoptive service children. There were a small number of beneficiaries with unknown basis of eligibility that are not reported here.
Many States had prepaid care plans covering at least some State beneficiaries, as of June, 1998. These plans may have provided limited or comprehensive coverage of prescription drugs. It is not possible to reliably identify number of prescriptions or prescription payments for drugs provided by prepaid plans, at this time. Therefore, the number of prescriptions reported here are FFS prescriptions.
SOURCE: Centers for Medicare & Medicaid Service, Office of Research, Development, and Information: State Medicaid Research Files (Wolters Kluwer Health, 2003).
Table 2. Medicaid Central Nervous System Drug Payments for 29 SMRF States, by Basis of Eligibility: 1998.
| State | Basis of Eligibility1 | ||||
|---|---|---|---|---|---|
|
| |||||
| Aged | Disabled | Adults | Children | Total | |
|
| |||||
| Payments 2 | |||||
| Alabama | $6,841,244 | $27,736,229 | $928,588 | $931,047 | $36,437,108 |
| Alaska | 654,159 | 4,876,003 | 1,038,196 | 462,920 | 7,031,278 |
| Arkansas | 7,316,446 | 19,696,533 | 1,058,098 | 1,183,069 | 29,254,146 |
| California | 31,704,133 | 251,645,261 | 14,778,779 | 7,748,932 | 305,877,110 |
| Colorado | 5,764,531 | 16,613,279 | 900,106 | 1,574,526 | 24,853,899 |
| Delaware | 917,749 | 4,433,952 | 1,912,480 | 392,208 | 7,656,389 |
| Florida | 32,696,077 | 100,966,854 | 6,049,983 | 3,633,971 | 143,412,985 |
| Georgia | 11,846,366 | 41,529,239 | 3,476,343 | 2,674,333 | 59,526,281 |
| Idaho | 1,738,070 | 6,904,317 | 696,561 | 388,892 | 9,728,136 |
| Indiana | 18,612,307 | 42,820,396 | 1,884,973 | 4,133,690 | 67,451,366 |
| Iowa | 8,225,276 | 23,986,931 | 2,844,952 | 2,398,802 | 37,455,961 |
| Kansas | 6,524,859 | 18,870,043 | 1,113,764 | 2,088,952 | 28,597,618 |
| Kentucky | 9,896,521 | 43,644,882 | 3,589,750 | 2,001,462 | 59,132,615 |
| Maine | 4,930,283 | 18,359,145 | 2,256,591 | 1,460,408 | 27,006,427 |
| Michigan | 12,887,267 | 54,455,868 | 4,203,415 | 2,464,934 | 74,011,504 |
| Minnesota | 6,841,346 | 43,380,860 | 1,924,636 | 1,491,574 | 53,639,902 |
| Missouri | 21,746,673 | 58,443,776 | 2,221,506 | 2,794,390 | 85,206,345 |
| Mississippi | 8,282,750 | 25,857,206 | 738,810 | 884,603 | 35,763,831 |
| Montana | 1,654,862 | 6,199,776 | 1,403,836 | 581,051 | 9,839,525 |
| New Hampshire | 3,484,394 | 10,332,423 | 1,664,046 | 1,226,384 | 16,708,049 |
| New Jersey | 12,949,124 | 58,072,673 | 534,106 | 1,422,274 | 72,978,177 |
| New Mexico | 1,861,342 | 4,915,629 | 180,388 | 230,280 | 7,187,639 |
| North Dakota | 2,142,739 | 3,821,249 | 426,576 | 485,242 | 6,875,877 |
| Pennsylvania | 39,302,482 | 86,177,707 | 5,336,162 | 5,090,895 | 135,907,246 |
| Utah | 2,496,666 | 12,571,566 | 2,547,254 | 1,396,699 | 19,012,185 |
| Vermont | 2,437,913 | 7,855,093 | 404,361 | 328,719 | 11,026,342 |
| Washington | 12,648,430 | 55,608,492 | 1,200,494 | 812,246 | 70,269,662 |
| Wisconsin | 13,879,770 | 49,877,012 | 540,318 | 1,152,095 | 65,449,195 |
| Wyoming | 795,638 | 2,451,716 | 337,346 | 340,886 | 3,925,586 |
The Medicaid eligibility group identifies the basis on which Medicaid eligibility was determined, regardless of cash assistance status. The disabled group includes individuals of any age who were determined to be eligible because of disability or blindness. The children's group includes foster care and adoptive service children. There were a small number of beneficiaries with unknown basis of eligibility that are not reported here.
Many States had prepaid care plans covering at least some State beneficiaries, as of June, 1998. These plans may have provided limited or comprehensive coverage of prescription drugs. It is not possible to reliably identify number of prescriptions or prescription payments for drugs provided by prepaid plans, at this time. Therefore, the payments reported here are for FFS prescriptions.
SOURCE: Centers for Medicare & Medicaid Services, Office of Research, Development, and Information: State Medicaid Research Files (Wolters Kluwer Health, 2003).
Table 3. Medicaid Central Nervous System (CNS) Drug Prescriptions, Payments and Recipients for 29 SMRF States, by Basis of Eligibility and CNS Drug Group: 1998.
| Measure2 | Basis of Eligibility1 | |||
|---|---|---|---|---|
|
| ||||
| Aged | Disabled | Adults | Children | |
| Number of Prescriptions | ||||
| Anti-Anxiety Agents | 1,563,419 | 2,696,771 | 303,251 | 195,616 |
| Anti-Depressants | 3,031,053 | 6,138,328 | 766,631 | 574,643 |
| Anti-Psychotics | 1,467,216 | 5,585,437 | 112,323 | 237,910 |
| Hypnotics | 654,105 | 1,299,664 | 78,813 | 45,573 |
| All CNS Drugs | 6,715,793 | 15,720,200 | 1,261,018 | 1,053,742 |
| Payments | ||||
| Anti-Anxiety Agents | $42,572,746 | $85,985,350 | $7,066,669 | $3,198,307 |
| Anti-Depressants | 138,472,269 | 350,282,331 | 47,408,021 | 27,874,447 |
| Anti-Psychotics | 95,034,419 | 637,882,904 | 9,442,813 | 20,259,345 |
| Hypnotics | 14,999,983 | 27,953,525 | 2,274,915 | 443,227 |
| All CNS Drugs | 291,079,417 | 1,102,104,110 | 66,192,418 | 51,775,326 |
| Recipients | ||||
| Anti-Anxiety Agents | 289,083 | 498,291 | 111,147 | 126,725 |
| Anti-Depressants | 400,718 | 839,005 | 210,177 | 125,134 |
| Anti-Psychotics | 214,475 | 537,100 | 43,928 | 46,265 |
| Hypnotics | 133,040 | 247,040 | 31,944 | 17,396 |
| All CNS Drugs | 706,153 | 1,385,529 | 315,046 | 275,023 |
The Medicaid eligibility group identifies the basis on which Medicaid eligibility was determined, regardless of cash assistance status. The disabled group includes individuals of any age who were determined to be eligible because of disability or blindness. The children's group includes foster care and adoptive service children. There were a small number of beneficiaries with unknown basis of eligibility that are not reported.
Many States had prepaid care plans covering at least some State beneficiaries, as of June, 1998. These plans may have provided limited or comprehensive coverage of prescription drugs. It is not possible to reliably identify number of prescriptions or prescription payments for drugs provided by prepaid plans, at this time. Therefore, the data reported here are for FFS prescriptions.
SOURCE: Centers for Medicare & Medicaid Services, Office of Research, Development, and Information: State Medicaid Research Files (Wolters Kluwer Health, 2003).
Analysis of utilization and spending for prescription drugs by therapeutic use for the dually eligible (persons eligible to receive both Medicaid and Medicare services) will be presented in later research. This is because the data for 1999, and later years contain more detailed information on dually eligible status. Future research will also examine utilization and spending for brand-name, off-patent brand-name and generic drugs.
Conclusion
In 1998, CNS drugs was the most expensive therapeutic category of drugs for the 29 State Medicaid Programs in our study. The greatest increases in Medicaid drug spending by therapeutic category between 1996 and 1998 were also observed for CNS drugs. Among eligibility groups, the disabled, in these States, accounted for the largest percentage of total Medicaid spending for CNS drugs at 71 percent in 1996, increasing to 73 percent in 1998. Spending for CNS drugs in 1998 was $1,102 for the disabled, compared to $291 for the aged, $66 for adults and $52 for children. Among the four CNS drug groups, high numbers of prescriptions per recipient, and high payment per prescription led to the highest payments per recipient for anti-psychotics, regardless of eligibility group. Among SMRF States and census regions, there were major variations in payments per recipient and prescriptions per recipient for CNS drugs.
Technical Notes
As of June 1998, many States had prepaid health care plans covering at least some State beneficiaries. These plans may have provided limited or comprehensive coverage of prescription drugs. Based on available data, it is not possible to develop accurate counts of drug recipients, number of prescriptions, and payments for drugs provided by prepaid plans. Therefore, the data presented here are for FFS prescriptions. Previous research showed that the percentage of beneficiaries who were enrolled in prepaid plans and received no FFS drugs was 33 percent in 1998 across all eligibility groups, but varied by State from below 2 percent (9 States) to 57 percent (New Mexico). The percentage was lower for aged and disabled beneficiaries (12 and 17 percent, respectively) than for children and adults (41 and 36 percent, respectively).
These Medicaid data can be used to examine patterns of payment, but not appropriateness of care. Differences in payment patterns, by health care professionals, should not be attributed to inappropriate recognition or management of complex conditions.
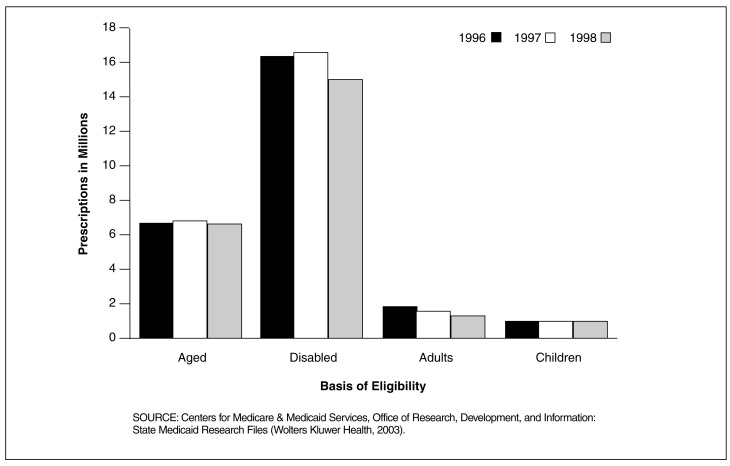
Figure 4. Medicaid Central Nervous System (CNS) Drug Prescriptions for 29 SMRF States, by Basis of Eligibility: 1996-1998.
Disabled Medicaid Recipients Clearly Used More Prescription CNS Drugs Than Any Other Eligibility Group From 1996 to 1998 in the 29 SMRF States
- The disabled accounted for 16.3 million prescriptions in 1996, 16.5 million in 1997, and 15.7 million in 1998. The trend in fewer prescriptions is true for all four eligibility groups. From 1996 to 1998 disabled Medicaid recipients received 15 times the number of prescriptions that children received.
- Each of the four eligibilty groups had fewer prescriptions dispensed in 1998 than in 1996. Adults had the greatest decrease in number from 1.90 million in 1996 to 1.26 million in 1998.
- In 1996 there were 26.1 million FFS CNS drug prescriptions dispensed for all groups compared to 24.7 million in 1998. Why does it appear that CNS prescription drug use among Medicaid recipients decreased? One possible explanation could be the increased enrollment in prepaid plans from 1996 to 1998 in these States. Reporting number of prescriptions paid by prepaid plans is unreliable at this time. However, in the same period in which the number of prescriptions declined, CNS drug payments increased by 63.9 percent.
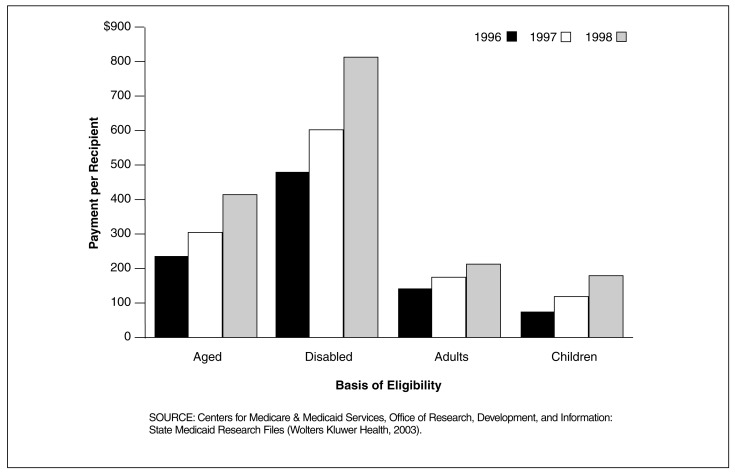
Figure 5. Medicaid Central Nervous System (CNS) Drug Payments Per Recipient for 29 SMRF States, by Basis of Eligibility: 1996-1998.
Disabled Beneficiaries in the 29 SMRF States Had the Highest Utilization of Prescription CNS Drugs Based on Payment Per Recipient for All 3 Years
- The disabled had an annual average CNS drug payment of $483 in 1996, $603 in 1997, and $814 in 1998. Children, who consistently received the lowest annual payment per recipient, received $79 in 1996, $117 in 1997, and $187 in 1998.
- In 1998 the disabled's average CNS drug payment of $814 was nearly double the amount for the aged, well over triple the amount for adults, and over four times the amount for children.
- The percentage increase in drug payments for all four basis of eligibility groups was higher from 1997 to 1998 than it was for 1996 to 1997. The payment per recipient for the disabled increased by 24.95 percent from 1996 to 1997, and another 34.86 percent from 1997 to 1998.
- As remarkable as the increase was for the disabled, the rate of growth for children was considerably higher. Children experienced a jump in the average payment per recipient for CNS drugs of 48.74 percent from 1996 to 1997, and 59.72 percent from 1997 to 1998.
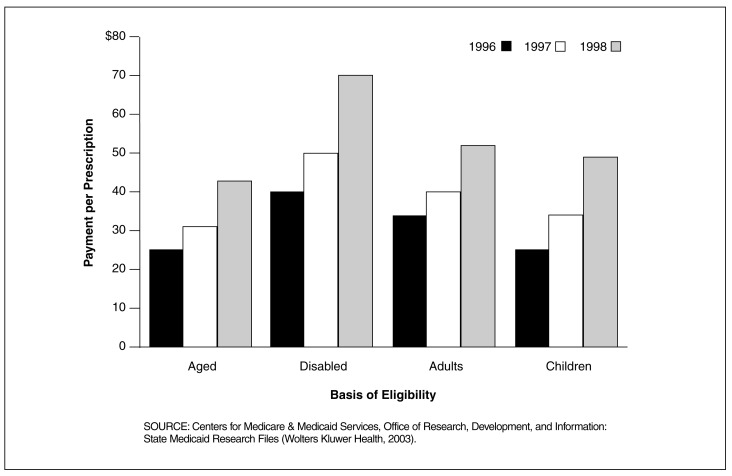
Figure 6. Medicaid Central Nervous System (CNS) Payment Per Prescription for 29 SMRF States, by Basis of Eligibility: 1996-1998.
In the 29 SMRF States, Disabled Beneficiaries Had the Highest Payment Per Prescription for CNS Drugs for All 3 Years
- Payment per prescription for CNS drugs for the disabled was $40 in 1996, $51 in 1997, and $70 in 1998. In contrast, payment per prescription for CNS drugs was lowest in all three years for the aged at $25 in 1996, $32 in 1997, and $43 in 1998.
- In 1998, payment per prescription for CNS drugs for the disabled at $70, was substantially higher compared to the payment per prescription for CNS drugs for the other basis of eligibility groups - $52 for adults, $49 for children, and $43 for the aged.
- The percentage increase in payment per prescription for all four basis of eligibility groups was greater from 1997 to 1998 than it was for 1996 to 1997. Payment per prescription for the disabled increased by 25.86 percent from 1996 to 1997, and another 38.21 percent from 1997 to 1998.
- As high as these increases were for the disabled, payment per prescription grew at an even higher rate for children (33.72 percent from 1996 to 1997, and 43.58 percent from 1997 to 1998). The increase from 1996 to 1997 was also higher for the aged than it was-for the disabled.
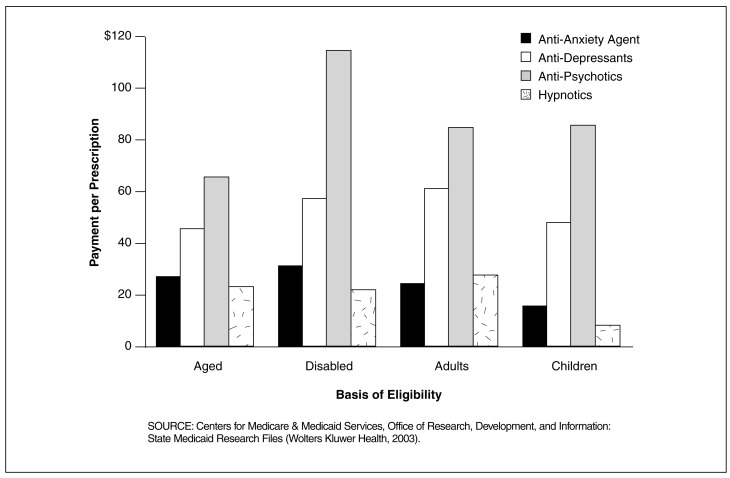
Figure 7. Medicaid Payment Per Prescription for Central Nervous System (CNS) Drugs for 29 SMRF States, by Basis of Eligibility and CNS Drug Group: 1998.
Payment Per Prescription for Anti-Psychotics was Much Higher Than for Other CNS Drug Groups in the 29 SMRF States Between 1996 and 1998
- Payment per prescription for anti-psychotics ranged from a high of $114 for disabled eligibles, $85 for children, $84 for adults, and a low of $65 for aged eligibles. Per prescription, anti-psychotics were more costly than other CNS drug groups, regardless of basis of eligibility.
- Anti-depressants was the second most costly CNS drug group. However, the difference by basis of eligibility was relatively small for anti-depressants, ranging from a low of $46 for the aged to a high of $62 for adults.
- Per prescription payment for anti-anxiety drugs was lowest for children at $16 and highest for the disabled at $32.
- Among these CNS drug groups, hypnotics was the least costly CNS drug group per prescription, ranging from a low of $10 for children to a high of $29 for adults.
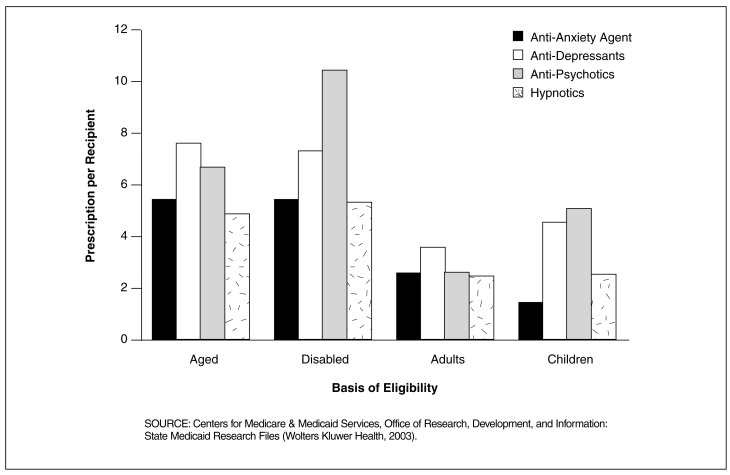
Figure 8. Medicaid Number of Prescriptions Per Recipient for Central Nervous System (CNS) Drugs for 29 SMRF States, by Basis of Eligibility and CNS Drug Group: 1998.
In the 29 SMRF States, Disabled Enrollees Were Among the Highest Users of CNS Drugs?
- Prescriptions per recipient for the disabled were higher for each CNS drug group than they were for any of the other basis of eligibility groups, with one exception. The exception was that the aged used more anti-depressants per recipient than the disabled.
- Usage of anti-psychotics by the disabled, 10.4 prescriptions per recipient, was substantially higher than usage of these drugs by other basis of eligibility groups—6.8 for the aged, 5.1 for children and 2.6 for adults.
- With the exception of children, anti-anxiety drugs were used more frequently, on a per recipient basis, than hypnotics. Per recipient use of both anti-anxiety and hypnotic drugs was much lower than anti-depressants and anti-psychotics for all basis of eligibility groups except adults.
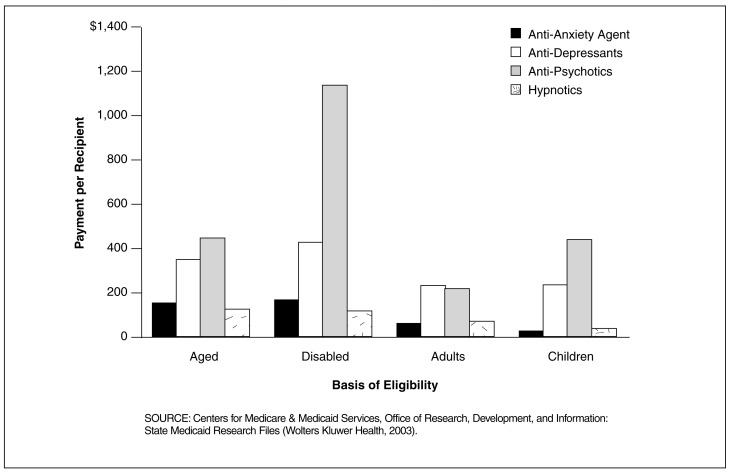
Figure 9. Medicaid Payment Per Recipient for Central Nervous System (CNS) Drugs for 29 SMRF States, by Basis of Eligibility and CNS Drug Group: 1998.
Payment Per Disabled Recipient for Anti-Psychotics was Much Higher Than for Other CNS Drug Groups in the 29 SMRF States
- Payment per recipient for anti-psychotics for the disabled ($1,188) was nearly three times the amount for the aged ($443) and children ($438) and nearly five times the amount for adults ($215). This finding is the result of at least two major factors: payment and utilization. Payment per prescription for anti-psychotics for the disabled was very high (Figure 7). Also, utilization of anti-psychotics by the disabled was also very high (Figure 8).
- Payment per recipient for anti-depressants was also higher for the disabled than for any other basis of eligibility group. However, the difference for anti-depressants by basis of eligibility was smaller than for anti-psychotics, ranging from $223 for children to $417 for the disabled.
- Compared to other CNS drugs, anti-anxiety and hypnotic drugs were relatively inexpensive per recipient at $173 or less. Per recipient expenditures for anti-anxiety drugs were slightly higher for the disabled and aged than for adults and children. In contrast, payment per recipient for hypnotics was slightly higher for adults and children than for the disabled and aged.
Acknowledgments
The authors wish to thank Harold Cooper and Celia Dahlman for their work in developing the software that was used to tabulate SMRF prescription drug claim records by therapeutic category and group.
Footnotes
The authors are with the Centers for Medicare & Medicaid Services (CMS). The statements expressed in this article are those of the authors and do not necessarily reflect the views or policies of the Centers of Medicare & Medicaid Services (CMS).
Reprint Requests: David Baugh, Centers for Medicare & Medicaid Services, 7500 Security Boulevard, C3-20-17, Baltimore, MD 21244-1850. E-mail: dbaugh@cms.hhs.gov
References
- Baugh D, Pine P, Blackwell S, et al. Medicaid Prescription Drug Spending in the 1990s: A Decade of Change. Health Care Financing Review. 2004 Fall;25(3):5–23. [PMC free article] [PubMed] [Google Scholar]
- Centers for Medicare & Medicaid Services. Internet address: http://cms.hhs.gov/researchers/max (Accessed December 2003)
- Wolters Kluwer Health. Internet address: http://www.Medi-Span.com/products/product_mddb.asp (Accessed May 2003)


