Abstract
Individuals eligible in both Medicaid and Medicare, the dually eligible enrollees, account for a disproportionate share of Medicaid utilization and payments. While comprising 14.7 percent of the Medicaid population, they accounted for 40.5 percent of Medicaid payments in 2002. Mean reimbursement for the dually eligible enrollees was nearly four times that of non-dually eligible Medicaid enrollees. This highlight examines utilization and payment data for the dually eligible enrollees in 2002.
Introduction
Dually-eligible enrollees, who are covered by Medicare and Medicaid, are among the most medically-vulnerable populations. They tend to be sicker, more depressed, and report more pain than Medicare-only eligible (Lied and Haffer, 2004). Not surprisingly, they tend to use more services than most other population groups.
Table 1 compares per eligible payments of the dually eligible with non-dually eligible Medicaid enrollees based on an analysis of Federal fiscal year (FFY) 2002 Medicaid Statistical Information System (MSIS) data.1 The dually eligible enrollees accounted for $86.5 billion of the $213.5 billion in claims processing-based payments in FFY 2002 or 40.5 percent of total payments. Overall, 7.6 million dually eligible enrollees were enrolled for at least 1 month during FFY 2002, 14.7 percent of the total Medicaid eligible of 51.6 million individuals in FFY 2002.
Table 1. Medicaid Payments for Dually and Non-Dually Eligible Enrollees: Federal Fiscal Year 2002.
| Comparison | Enrollee | Total | |
|---|---|---|---|
|
| |||
| Dually Eligible | Non-Dually Eligible | ||
| Overall | |||
| Total Payments (in Billions) | $86.5 | $127.0 | $213.5 |
| Total Eligibles (in Millions) | 7.6 | 43.9 | 51.6 |
| Mean Payment for 2002 | $11,352 | $2,891 | $4,142 |
| Selected Services1 | |||
| Prescribed Drugs | 1,955 | 307 | 647 |
| Nursing Facility | 4,514 | 112 | 762 |
| Personal Support | 906 | 193 | 298 |
| Home Health | 262 | 44 | 76 |
| Inpatient | 367 | 599 | 565 |
| ICF-MR | 879 | 91 | 207 |
Mean payment for 2002.
NOTE: ICF-MR is intermediate care facility for the mentally retarded.
SOURCE: Centers for Medicare & Medicaid Services: Data from the Medicaid Statistical Information System, 2002.
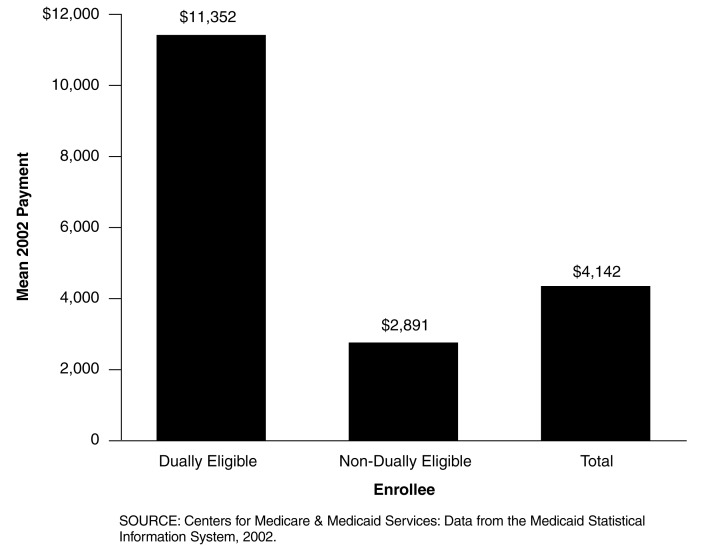
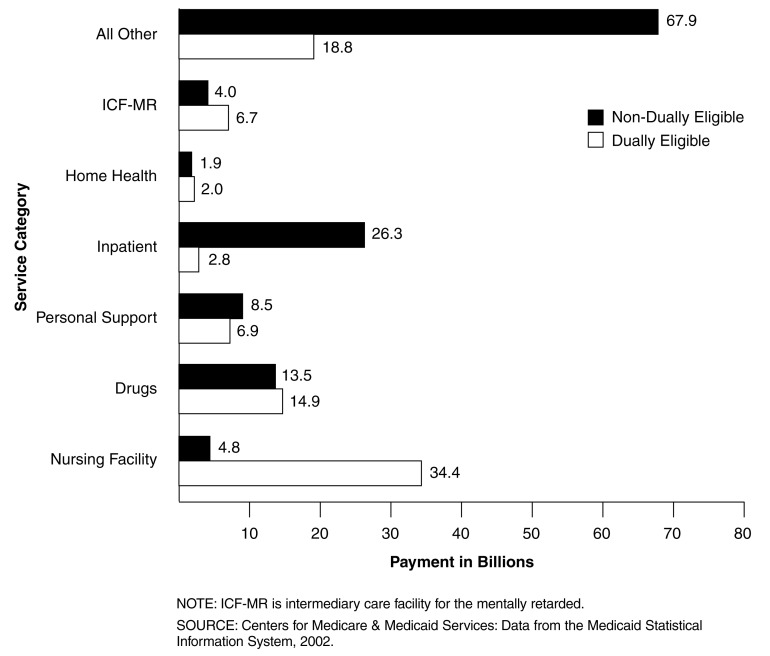
Figure 1 shows the mean Medicaid payments per dually and non-dually eligible enrollees for FFY 2002. The mean annual payment for the dually eligible enrollees was $11,352, almost four times that of the non-dually eligible enrollees at $2,891. Figure 2 compares Medicaid payments by selected service categories for the dually and non-dually eligible enrollees in FFY 2002. The dually eligible enrollees greatly exceeded their counterpart in nursing facility mean payments ($34.4 versus $4.8 billion). The dually eligible enrollees also experienced greater payments for drugs, intermediate care facility for the mentally retarded and home health services.
Figure 1. Mean Medicaid Payment Per Dually Eligible and Non-Dually Eligible Enrollees: Federal Fiscal Year 2002.
Figure 2. Medicaid Payments for Dually Eligible and Non-Dually Eligible Enrollees, by Selected Service Categories: Federal Fiscal Year 2002.
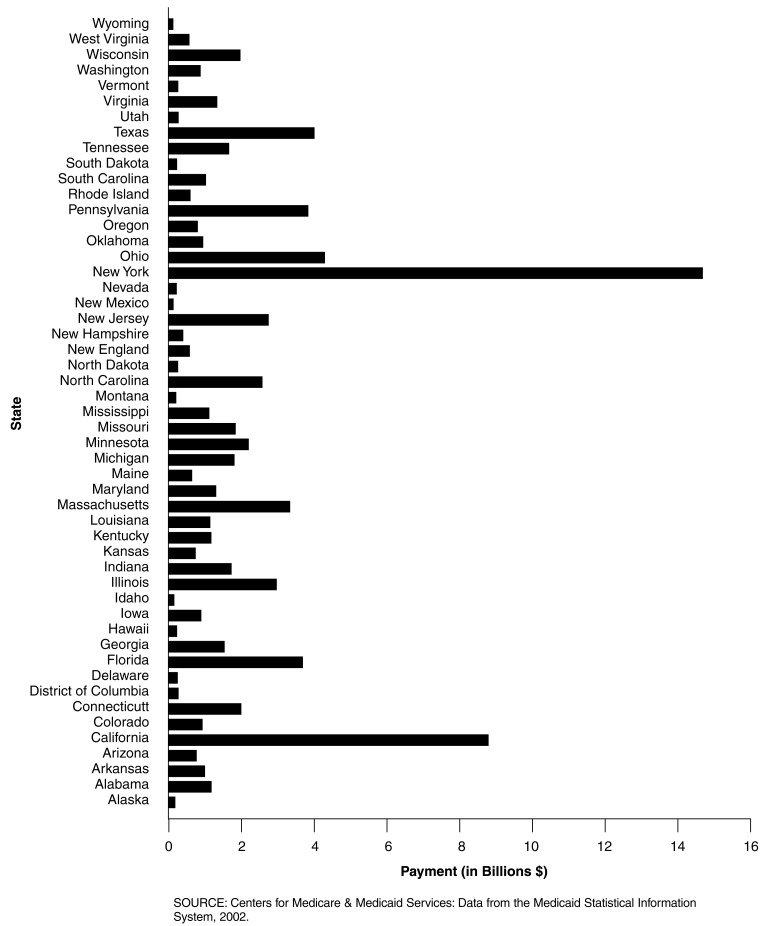
Figure 3 displays the mean Medicaid payment for the dually eligible enrollees broken down by State for FFY 2002 and clearly shows the large variation in mean payments among the States for this group of enrollees. Three States exceeded $20,000 in mean payments for the dually eligible enrollees: New York ($24,385), Connecticut ($22,127), and New Hampshire ($20,161).
Figure 3. Payments for Dually Eligible Medicaid Beneficiaries, by State: 2002.
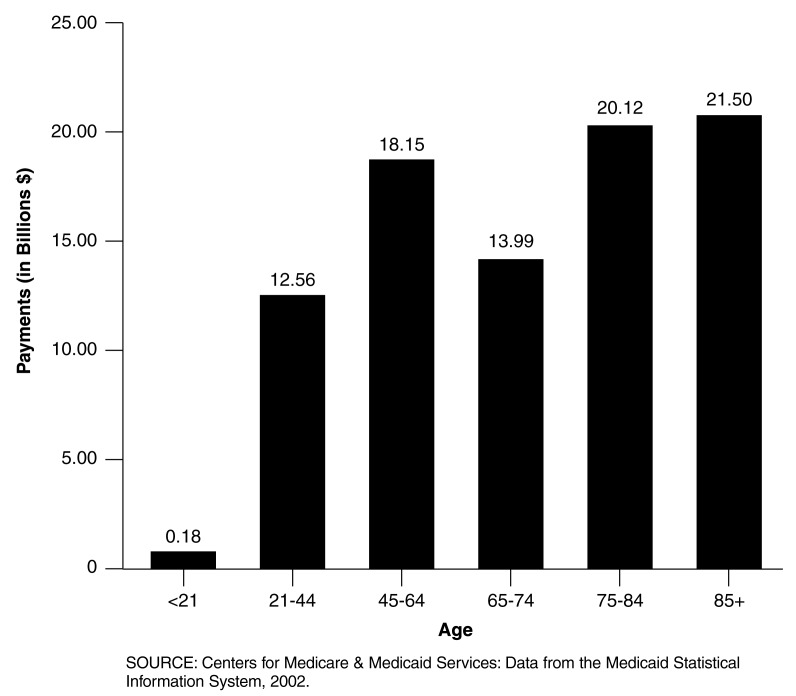
Total Medicaid payments for the dually eligible enrollees by selected age groupings are shown in Figure 4. The age groups 85 and over and 75-84 experienced the highest payment totals, $21.50 and $20.12 billion, respectively. The age group 65-74 at $13.99 billion was actually lower than the age group 45-64 at $18.15; however, the age group 65-74 has a range of 10 years compared to 20 for the age group 45-64. The age group 21-44 experienced $12.56 billion in payments, while the age group under 21 experienced $ 0.18 billion, or about $180 million in payments.
Figure 4. Medicaid Payments for Dually Eligible Enrollees, by Age: Federal Fiscal Year 2002.
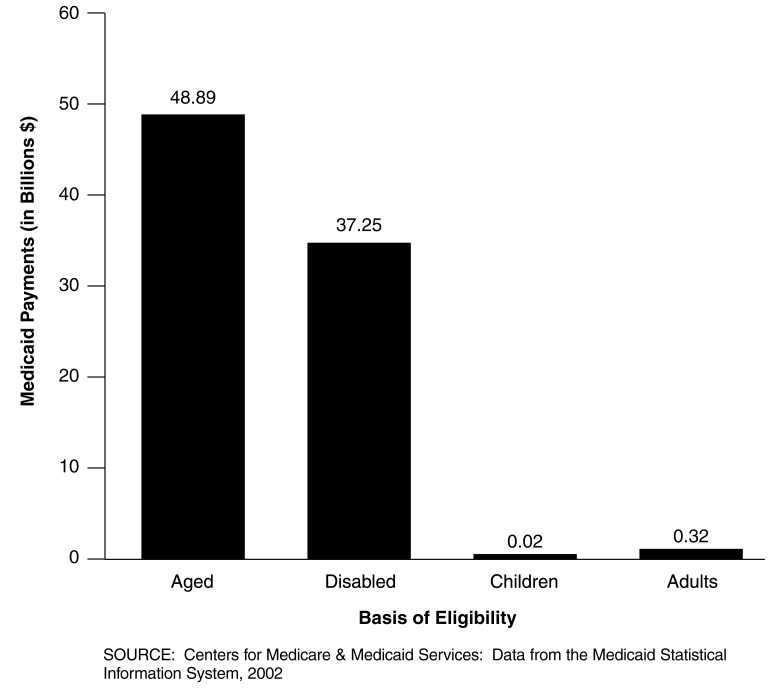
The aged and disabled account for over 99 percent of the payments for the dually eligible enrollees. Figure 5 shows that $48.89 billion was spent for the aged and $37.25 billion for the disabled compared to only about $20 million for children and $320 million for caretaker adults.
Figure 5. Medicaid Dually Eligible Enrollee Payments, by Basis of Eligibility: Federal Fiscal Year 2002.
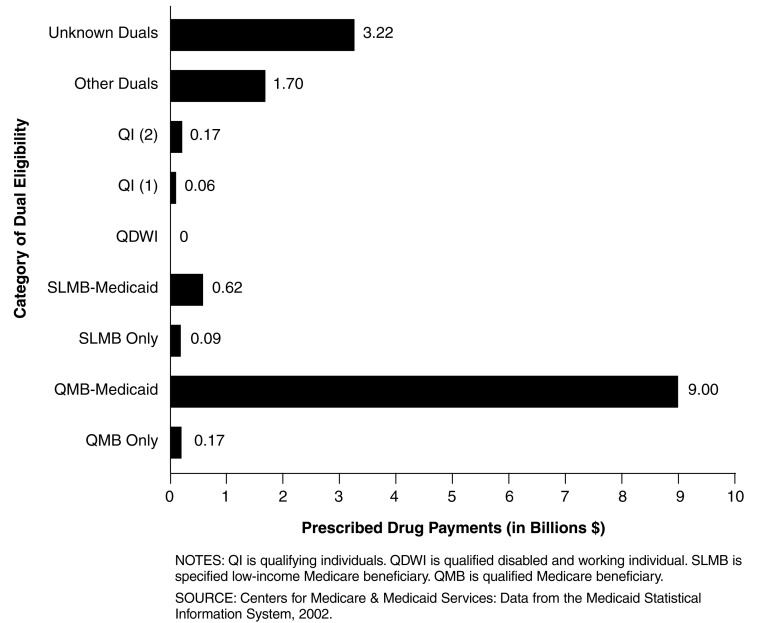
The recent passage and implementation of the Medicare Prescription Drug, Improvement, and Modernization Act of 2003 has increased the attention on prescribed drug costs in Medicaid.2 Figure 6 shows the Medicaid drug payments by category of dual eligibility.3 Qualified Medicaid beneficiaries with full Medicaid benefits experienced the highest amount of prescribed drug payments at $9 billion in FFY 2002.
Figure 6. Medicaid Drug Payments, by Dually Eligible Enrollee Category: Federal Fiscal Year 2002.
Footnotes
The author is with the Centers for Medicare & Medicaid Services (CMS). The statements expressed in this article are those of the author and do not necessarily reflect the views or policies of CMS.
MSIS data were compiled using the State Summary Data Mart for 2002. MSIS data reflect payments made for claims adjudicated during the FFY. MSIS generally does not include payments made outside the claims processing system such as disproportionate share payments, supplemental payments, and administrative costs.
The dually eligible enrollees, if they receive full benefits under Medicaid and if they elect to participate in the program, will receive their drug benefits under Medicare beginning in 2006.
An explanation of the different categories can be found at http://www.cms.hhs.gov/medicaid/msis/msisdd99.pdf.
Reprint Requests: Terry R. Lied, Ph.D., Centers for Medicare & Medicaid Services, 7500 Security Blvd., Mail Stop S3-13-15, Baltimore, MD 21244-1850. E-mail: terry.lied@cms.hhs.gov
Reference
- Lied TR, Haffer SC. Health Status of Dually Eligible Beneficiaries in Managed Care Plans. Health Care Financing Review. 2004 Summer;25(4):59–74. [PMC free article] [PubMed] [Google Scholar]


