Abstract
This article discusses the Severity of Illness case-mix groups, and suggests a refinement to diagnosis-related groups (DRG's) designed to accommodate the important element of patient severity. An application of the suggested refinement is presented in a discussion of the efficient production of hospital services.
The following areas are addressed.
A brief summary of the goals and development of the Severity of Illness Index, and the methodology used to collect severity of illness data on hospital inpatients.
Comparative analyses of the resulting case-mix groups within hospitals, and an application of severity-adjusted diagnosis-related groups case-mix definitions.
The contribution of the variation in physician practice patterns to the variation in resource use per patient within a hospital.
Cross-hospital comparisons.
Some of the consequences of incorporating a patient severity refinement into the prospective payment system.
Introduction
How should patient categories, or case-mix groups, be defined if they are to be used for prospective payment for inpatient care? Two criteria are important for evaluating the effectiveness of a case-mix grouping system: medical meaningfulness of the grouping system and homogeneity of resource consumption within each of the case-mix groups. In addition, if a case-mix grouping system is to be used for prospective payment, two additional criteria must be considered: independence from the medical treatment process, and administrative feasibility.
With these criteria in mind, a Severity of Illness Index was developed by a team of researchers, physicians, and nurses at The Johns Hopkins University. It was designed to be a medically meaningful generic classification system that could differentiate the severity of illness of hospital inpatients. Because discharge abstract data contain only labels of principal and secondary diagnoses, procedures performed, age, etc., the conventional discharge abstract data base is not rich enough to describe patient severity of illness accurately.
Measuring patient severity of illness
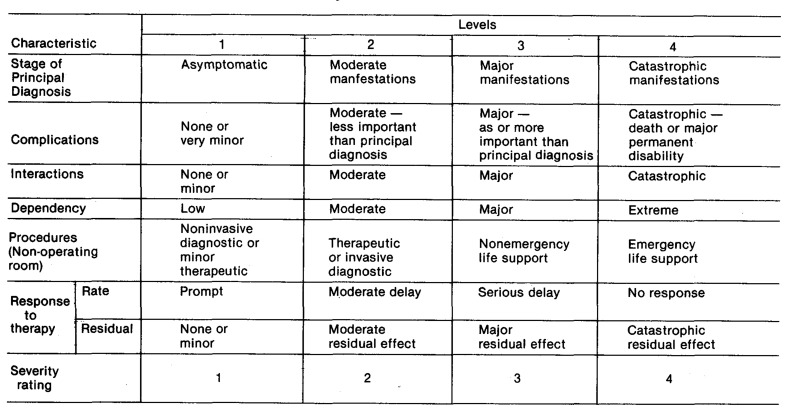
Using the patient's total medical record, the Severity of Illness Index assigns to each patient at discharge an overall severity score that is determined from the scores of each of seven medically meaningful dimensions chosen to reflect burden of illness. These seven dimensions, as shown in Figure 1, are:
Figure 1. Severity of illness instrument.
Stage of the principal diagnosis.
Complications of the principal condition.
Concurrent interacting conditions that affect the hospital course.
Dependency on hospital staff.
Extent of nonoperating room life support procedures.
Rate of response to therapy or rate of recovery.
Impairment remaining after therapy for the acute aspect of the hospitalization.
The Severity of Illness Index is described in detail in various reports (Horn, Sharkey, and Bertram, 1983; Horn, 1983a; Horn and Sharkey, 1983; Horn, Chachich, and Clopton, 1983; Horn, 1983b).
To determine the severity of illness score for an individual case, a rater scores each of the seven dimensions into one of four levels of increasing severity by examining data in the patient's medical record following discharge. Definitions of each of the four levels for each dimension are provided, and raters are intensively trained to distinguish the reasons for selecting the level of each dimension. The rater then assigns an overall severity score for the patient on a four-point scale by implicitly integrating the values of the seven dimensions.
The reliability and validity of the severity of illness instrument has been studied in several ways. Reliability checks and followup training sessions are conducted periodically. More than 95 percent of the individual raters achieve greater than 90 percent agreement on blind re-rating of a sample of their charts after using the Severity of Illness Index for 2 months. All the hospital data reported here had greater than 90 percent agreement rates on blind re-rating of samples of charts. The actual agreement percent, rather than agreement corrected for chance agreement, has been reported here because of the very different distributions of overall severity of illness in the samples of charts selected for blind re-rating. We did not feel that each rater's reliability assessment should be affected because the random sample selected for that review happened to contain charts from mostly one of the severity of illness levels. However, over 90 percent of the time, the agreement percent and the agreement corrected for chance agreement statistic were within 2 percentage points of each other. Thus, we found that severity of illness data can be collected in a reproducible manner.
With respect to the validity of the severity of illness instrument, we used the following procedures to assure that the instrument would come as close as possible to accurately measuring patient severity of illness. Content validity was assessed by presenting the criteria for classification (definitions of severity levels) to a panel of medical experts who systematically examined the definitions and came to a consensus. The clinical experts felt that the criteria were representative of patient severity of illness at each identified severity level. Face validity was examined by asking the developers and users of the instrument to make subjective judgments as to whether or not the instrument seemed reasonable and had the ability to obtain reasonable data. Empirical investigation suggests that the Index is a good measure of severity, but the process of validation is constantly being examined. The Severity of Illness Index cannot be compared with another validated measure of severity because none is available at this time. The research and statistical analyses discussed below, however, present evidence that the instrument leads to an accurate measurement of illness severity.
The four levels of severity are an ordinal scale from the least severe (level 1) to the most severe (level 4); the “distances” between successive levels have no significance and are not necessarily equal. The Severity of Illness Index is a generic measure, referring to the patients themselves. Thus, any grouping system for patient classification can be subdivided into severity of illness levels. In particular, the Severity of Illness Index can be used within DRG's or within any other case-mix system.
Another feature of the Severity of Illness Index, which it shares with other case-mix grouping systems such as DRG's and disease staging, is that it does not explicitly take into account the quality of care received by the patient. The Severity of Illness Index asks how sick the patient is and what burden of illness the patient exhibits while in the hospital. It does not ask whether the patient's burden of illness was naturally caused or iatrogenically caused, (i.e., was exacerbated by accident or infection during hospitalization). Thus, a patient may become sicker as a result of poor quality of care.
Severity of illness data are being or have been collected in more than 30 hospitals in the United States and Canada. These hospitals include university teaching hospitals, community teaching hospitals, and community nonteaching hospitals. The results presented here are based on those hospitals for which we had at least six months of data. These results are preliminary and will need to be studied more thoroughly when additional data become available. Because of the controversies about what trim points should be used, the data have not been trimmed. This permits generalization to an entire patient population, and thus application of a prospective payment system to all patients. Severity of illness data are usually collected at discharge by medical records personnel concurrent with the coding of discharge abstract data, or by utilization review personnel when a final utilization review on a patient is completed.
For analysis, severity of illness data are merged with discharge abstract data and financial data on each patient. At this point, a computer algorithm takes the presence of an operating room procedure into account. The data are subdivided into three subgroups depending on whether the patient had no operating room procedure, a moderate operating room procedure, or a major operating room procedure. The designation of moderate versus major operating room procedure is based on a list developed by a surgeon panel. A major operating room procedure either requires very special skills and education or takes a long time from which to recover. The subdivision into procedure type subgroups is done for analytical purposes, but does not affect the patient's severity rating. It does, however, help to make the resulting groups more medically meaningful.
Results within hospitals
Within each severity of illness group, we examined resource consumption as expressed by total charges, length of stay, and ancillary service charges such as laboratory, radiology, pharmacy, and routine charges. We studied severity of illness within DRG's and within major diagnostic categories (MDC's), of which the DRG's are a finer subdivision. The results are similar for all types of resource use, so we shall demonstrate them using total charges. The necessary data are being collected to take charges back to costs, but the results are not yet available.
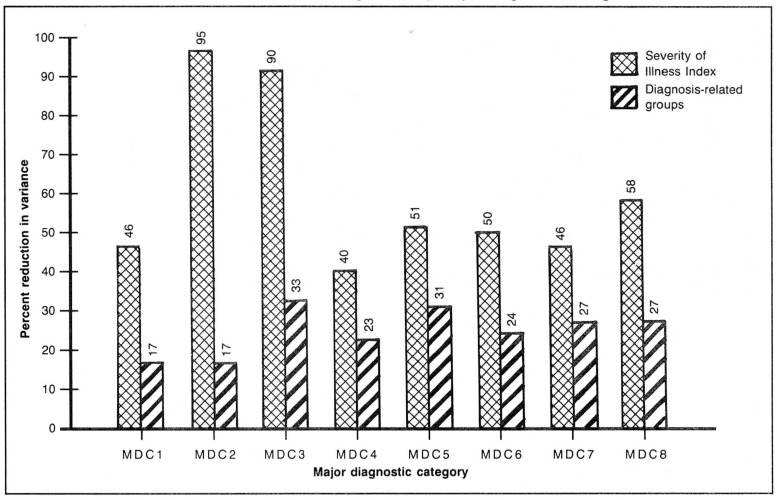
In Figure 2, we show a sample of the reduction in variance (RIV) results obtained when patients are grouped within an MDC. The patients are placed either into DRG's (from 5 to 48 subgroups depending on the MDC) or into the four severity levels divided into procedure type subgroups (up to 12 subgroups).
Figure 2. Reduction in variance for charge data by major diagnostic categories.
The data in Figure 2 represent MDC's 1 through 8. Reduction in variance is represented by the formula:
The data come from a total sample of over 19,000 cases in one university teaching hospital. These results are representative of the kinds of RIV results that have been seen for all the MDC's in the hospitals in the data set. The data show that even though the Severity of Illness Index may place patients into fewer groups (at most 12) than the DRG's, the variability in resource use that is explained by the severity of illness groups is greater than the variability that is explained by DRG's.
The weighted (by sample size) coefficient of variation statistics for the same MDC's are shown in Figure 3. The coefficient of variation of a data set is the standard deviation divided by the mean. Thus, smaller weighted coefficients of variation reflect more homogeneous resource-use groups. We see that the severity of illness groups have lower weighted coefficients of variation, and hence, by this measure, have greater homogeneity than the DRG's.
Figure 3. Coefficient of variation for charge data by major diagnostic categories.
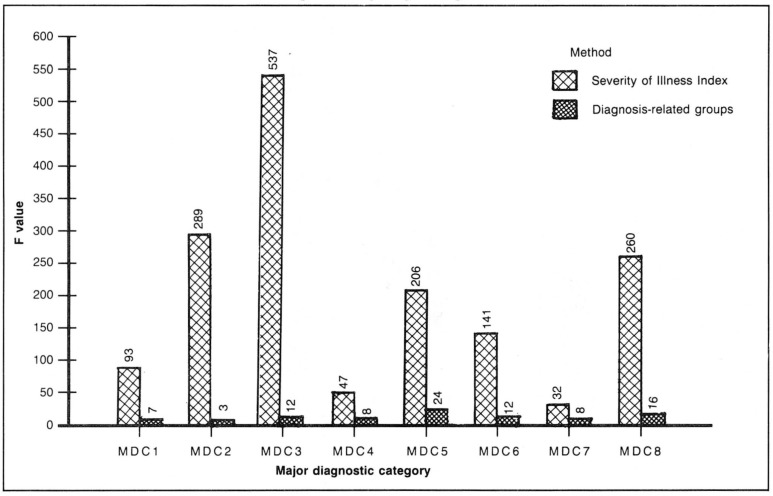
Analysis of variance F test statistics for the Severity of Illness Index and for DRG's are shown in Figure 4. The analysis of variance F test indicates how different the means are between the various groups, compared with the variability within the groups. A higher F value indicates a grouping system with greater differentiation among the groups as well as better homogeneity within the groups. We see that the severity of illness groups have much higher F values than the DRG's. Thus, by three common measures of homogeneity, the severity of illness groups, even though almost always fewer in number, are found to be more homogeneous with respect to resource use than DRG's. These results are representative and typical of those seen from all the hospitals collecting severity of illness data on an ongoing basis.
Figure 4. F value for charge data by major diagnostic categories.
Homogeneity of resource use is a desirable feature of a case-mix grouping system for prospective payment. It implies that most cases in a group will actually have resource-use levels which are approximately that of the “typical” (average, median, or whatever) case in the group—the norm used to determine the amount of prospective payment for all patients in the group. Even if a particular hospital's patient distribution is atypical, it will be reimbursed appropriately at levels that fairly reflect the resource consumption of its patients. If groups are heterogeneous, the possibility exists that a hospital's patients in a group will cluster far from the “typical” level used for reimbursement, with consequent financial risk or windfall for the hospital.
A grouping system with more groups might be expected, in principle, to be able to produce groups that are more homogeneous than those produced by a system with fewer groups. For the DRG's and severity of illness case-mix systems, however, this is not what is observed. Thus, it is not just the number of groups that has a decisive influence on homogeneity, but also the fundamental conception of what is being quantified by the system. The data indicate that just the labels of principal and secondary diagnoses, age, procedures, etc., on which DRG's are based, do not describe sufficiently well how severely ill the patients are. Hence, they may not accurately predict resource requirements. It was found, however, that dividing patients into severity of illness groups yields much better explanatory power.
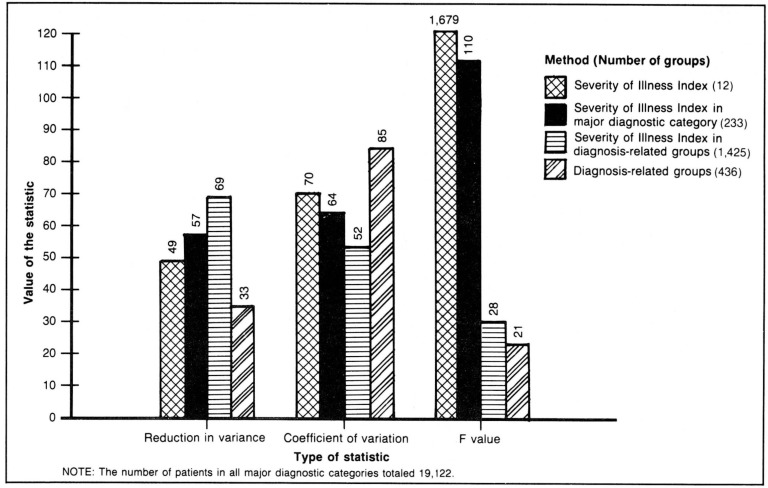
An example of these results for one hospital with more than 19,000 cases in 1 year is shown in Figure 5. Patients were placed into DRG's and also classified by severity of illness level and procedure type alone, severity and procedure type within MDC's, and severity and procedure type within DRG's. For each of these three ways to use severity of illness, the result is that the severity of illness groups are more homogeneous than the DRG's alone, as indicated by greater reductions in variance, larger F values, and lower coefficients of variation. The number of groups into which the patients were classified in this hospital for each of the case-mix grouping systems is given in parentheses in the legend.
Figure 5. Homogeneity statistics for charge data by major diagnostic categories.
In Tables 1-3, examples are shown of three DRG's, each illustrating a different aspect of variability. Table 1 is for DRG 75 (major chest procedures), which contained 47 patients whose total charges ranged from $1,117 to more than $205,000. The patients were classified into four severity levels and two procedure types. A patient was placed in the major operating room procedure category if any of the patient's operations was on the major operating room procedures list. Otherwise, the patient was placed into the moderate operating room procedures category. In particular, the patient with charges of $1,117 was classified by the DRG grouper into DRG 75 because of a procedure coded 33.27 (other lung biopsy). Our refined definitions of procedure codes do not list this procedure in the major category, nor does this patient's resource use reflect such a designation. However, some differences are noted in resource use by severity of illness level even among those patients who have only a moderate operating room procedure. The same phenomenon is observed for patients with major operating room procedures. Large differences can be found between the average resource use for patients in the same severity level who have a moderate operating room procedure versus a major operating room procedure. The coefficients of variation of each of the severity of illness groups are much smaller than the coefficient of variation for DRG 75 overall. By dividing the patients into severity of illness and procedure type groups within this DRG, the variability was reduced by 98.5 percent.
Table 1. Number of patients, mean, and coefficient of variation for diagnosis-related group 75 (major chest procedures), by type of procedure and severity level.
| Procedure type and severity level | Number of patients | Mean | Coefficient of variation |
|---|---|---|---|
| Total | 47 | $ 11,684 | 251 |
| Moderate operating room procedure | |||
| Severity level 1 | 6 | 2,650 | 43 |
| Severity level 2 | 11 | 6,341 | 52 |
| Severity level 3 | 3 | 14,789 | 8 |
| Major operating room procedure | |||
| Severity level 1 | 13 | 5,891 | 38 |
| Severity level 2 | 13 | 10,523 | 55 |
| Severity level 4 | 1 | 205,747 | 0 |
Notes: Total charges per patient ranged from $1,117 to $205,747. The reduction in variance equals 98.5 percent; F value equals 761.8; and the weighted coefficient of variation equals 53.0.
Table 3. Number of patients, mean, and coefficient of variation for diagnosis-related groups 296 (nutritional and miscellaneous metabolic diseases, age > 70 and/or complications or comorbidity) by type of procedure and severity level.
| Procedure type and severity level | Number of patients | Mean | Coefficient of variation |
|---|---|---|---|
| Total | 52 | $ 7,482 | 143 |
| No operating room procedure | |||
| Severity level 1 | 19 | 2,167 | 108 |
| Severity level 2 | 24 | 6,006 | 90 |
| Severity level 3 | 6 | 14,658 | 62 |
| Severity level 4 | 3 | 38,605 | 53 |
Notes: Total charges per patient ranged from $347 to $57,295. The reduction in variance equals 65.1 percent; the F value equals 30.0; and the weighted coefficient of variation equals 91.3.
Table 2 is for DRG 108 (cardiothoracic procedures, except valve and coronary bypass, with pump), which contained 60 patients with total charges ranging from a little more than $5,000 to more than $289,000. Although all these patients had a major operating room procedure, some differences in resource use by severity of illness level were found.
Table 2. Number of patients, mean, and coefficient of variation for diagnosis-related group 108 (cardiothoracic procedures except valve and coronary bypass with pump), by type of procedure and severity level.
| Procedure type and severity level | Number of patients | Mean | Coefficient of variation |
|---|---|---|---|
| Total | 60 | $ 30,180 | 163 |
| Major operating room procedure | |||
| Severity level 1 | 21 | 9,678 | 45 |
| Severity level 2 | 26 | 19,162 | 60 |
| Severity level 3 | 5 | 27,885 | 24 |
| Severity level 4 | 8 | 121,243 | 76 |
Notes: Total charges per patient ranged from $5,133 to $289,207. The reduction in variance equals 55.1 percent; the F value equals 22.9; and the weighted coefficient of variation equals 54.0.
Table 3 is for DRG 296 (nutritional and miscellaneous metabolic disorders, age over 70 and/or with a complicating or comorbid secondary diagnosis), which contained 52 patients and had a smaller range of total charges, from $374 to more than $57,000. However, differences were still observed in resource use as severity of illness increased. In this case, however, the severity level 1 group had a rather large coefficient of variation. This is attributable to one patient who had difficulty in placement, and whose resource use was therefore much higher than would be expected for a patient in this level.
Evaluating variations in physician practice patterns
One of the main reasons for adopting a prospective payment system is to encourage an efficient level of operation within the health care delivery system. Within a hospital, a prospective payment system should provide specific incentives for reducing inefficiencies of hospital services and should have groups that are meaningful to the medical community. If it does, then physicians may be led to modify their behavior, if appropriate.
It is also important that a case-mix system for prospective payment produce groups that are homogeneous (by various measures) with respect to patient resource use. Because of the often great variability in resource use found within DRG's, a question arises about their effectiveness in inducing desirable modifications in physician practice patterns.
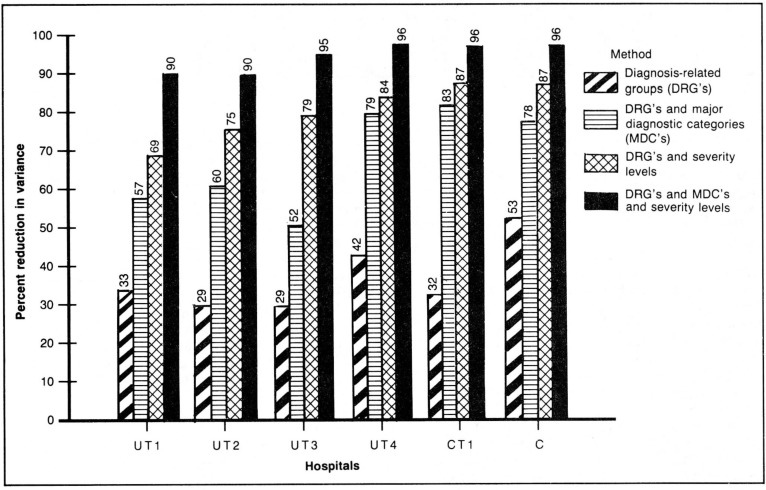
Severity of illness within DRG's produced the most homogeneous groups (Figure 5). However, there is still a large amount of unexplained variability. To see how much of this variability might be explained by differences in physician practice patterns, the DRG and severity of illness groups were subdivided further into groups of patients treated by each individual physician. In addition, within each DRG the patients were subgrouped by the attending physician. We could, by this means, compare how much of the variability of charges within DRG's could be explained by physician practice patterns, compared with how much of the variability of charges within severity-of-illness-adjusted DRG's was explained by physician practice patterns.
The results of these comparisons are presented in Figure 6 for several hospitals. In general, the results show that DRG's explain 30-40 percent of the variability in resource use. Physician subgrouping within DRG's explains another 20-40 percent of the variability of resource use. Taking severity of illness into account as well, raises the explanatory power to between 90 percent and 96 percent of the variability in charges for each of the hospitals. These results suggest that most of the variability in resource use within a hospital can be explained by:
Figure 6. Reduction in variance in total charge data by hospital.
The case mix that is going to the hospital (DRG).
The severity of illness of the patients.
The practice patterns of the physicians within the institution.
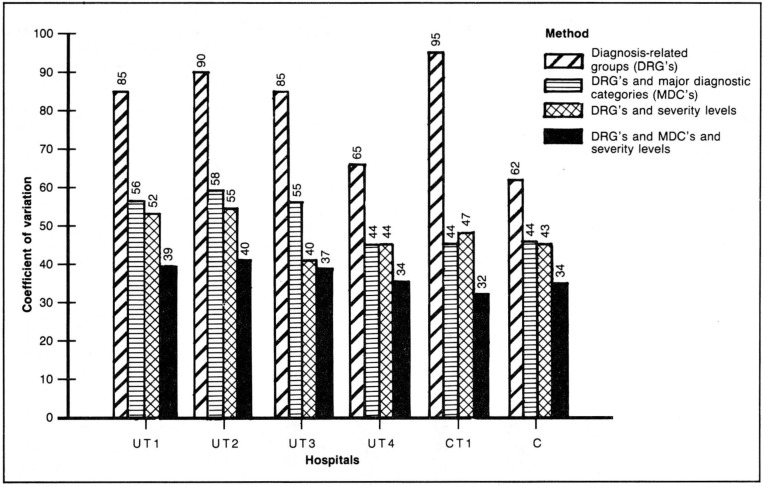
The coefficients of variation for these same hospitals grouped in the same ways are shown in Figure 7.
Figure 7. Coefficient of variation in total charge data by hospital.
These results show that physicians do explain some of the variability in resource use. However, it is not clear if the variability results from different physicians treating the same type of patient differently (efficiency) or differences in patients within a DRG, severity, procedure type group treated by the same physician (classification). These results, as well as the contribution of poor quality of care and its effect on the definitions of severity of illness and DRG's, need further study.
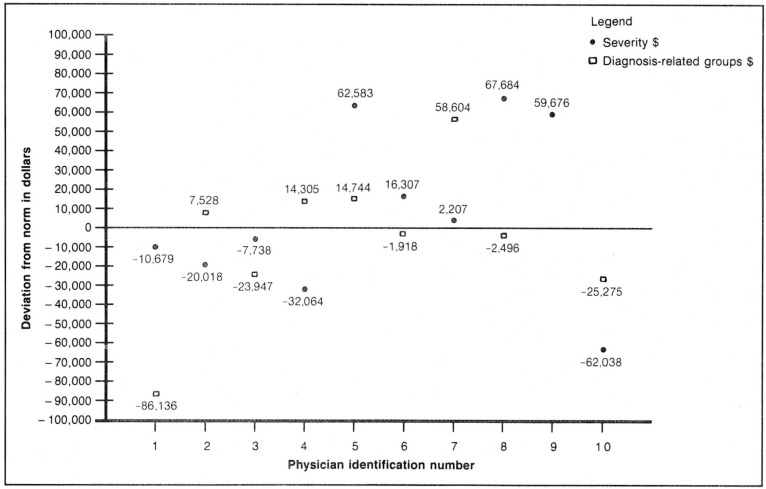
If a hospital's (or a physician's) resource use within a DRG is higher than a typical level, it could be that the institution (or physician) is inefficient. It could also mean that the institution or physician is treating patients who are more severely ill. Because severity-adjusted DRG's produced the most homogeneous groups in this study, patients from the whole institution were placed into the appropriate DRG group and further subclassified by severity of illness level and procedure type (DRG, severity, procedure). As the norms of practice in each institution, we used the average resource use expressed in terms of total charges, length of stay, laboratory charges, radiology charges, routine charges, and pharmacy charges for patients in each DRG, severity, procedure group. Subsequently, we compared the resource use of each physician's patients with the norms in the appropriate categories. For each physician, we then accumulated the differences between each of his patient's resource use and the norms, controlling for DRG, severity, and procedure type. The results are explained in more detail in another article (Horn, Horn, and Moses, 1984). It was found that some physicians treated most of their patients with less resource use than the norms, and some with more. The same comparisons were also made when the patients were grouped only by DRG's, and not adjusted for severity or procedure type (Figure 8). The two different methods of assessing an individual physician's efficiency often led to different conclusions. These disparate results signal to a hospital administrator that the underlying causes of the differences should be investigated. Only a more detailed review will show whether the differences are because of quality of care, efficiency, or treatment of more severe cases. However, the implications of these differences between DRG's and severity- and procedure-adjusted DRG's are great. Where will medical practice be in the future if the wrong physicians are criticized (or praised) for atypical practice patterns?
Figure 8. Physician practice patterns for Severity of Illness Index and diagnosis-related groups, by deviation in charges from the norm.
Inter-hospital differences in patient severity
The results in the previous sections have indicated that severity of illness refinements within DRG's can produce resource-use groups that are more homogeneous. However, the fact that there is a spread of severity within a DRG is not necessarily a fatal problem. If all hospitals treat patient populations with the same distribution of severity of illness within each of the DRG's, one might expect variations in resource use within a DRG to average out. Exactly such a reliance on a law of large numbers was explicitly stated in Secretary Richard Schweiker's Report to Congress (Department of Health and Human Services, 1982) in which he proposed the present prospective payment system for Medicare.
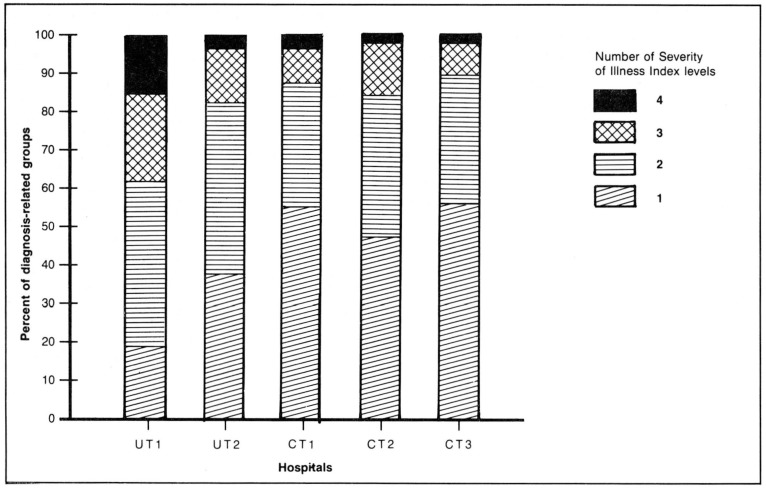
In Figure 9, the distribution of severity of illness within DRG's in several different types of hospitals is shown. Each hospital is represented by a stacked bar. Within each bar, the various shaded sub-bars represent the percent of DRG's having one severity of illness level (homogeneous with respect to severity of illness), having two severity of illness levels, etc. In hospital UT1, 18 percent of the DRG's were homogeneous with respect to severity of illness. On the other hand, more than 60 percent of the DRG's in hospital C1 had one level of severity, and fewer than 10 percent of the DRG's had three and four levels of severity. Thus, different hospitals have different numbers of DRG's with a spread of severity of illness.
Figure 9. Percent distribution of diagnosis-related groups, by number of Severity of Illness Index that each contains.
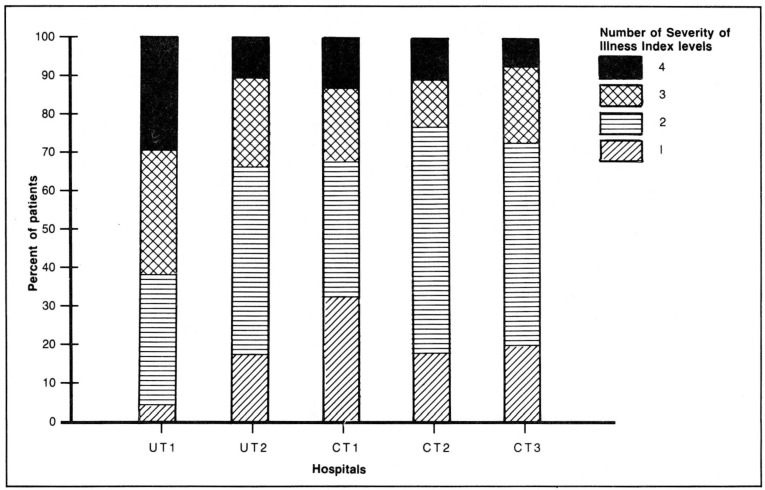
Figure 10 shows the distribution of patients according to the number of severity levels that their respective DRG's contained. In hospital UT1, 37 percent of the DRG's contained three or four levels of severity. These DRG's contained 63 percent of the hospital's patients, compared with 35 percent or less of the patients in the other hospitals in DRG's with three or four levels of severity. Only 18 percent of the DRG's in hospital UT1 were homogeneous with respect to severity, and these DRG's contained only 3 percent of the patients in the institution. In the other hospitals, no more than 31 percent of the patients were in DRG's that were homogeneous with respect to severity of illness. Thus, the DRG's that are homogeneous with respect to severity contained only a minority of the patients in the study hospitals, whereas those DRG's that were heterogeneous with respect to severity encompassed the majority of patients in all five institutions. However, the distribution of those patients varied greatly by institution.
Figure 10. Percent distribution of patients in diagnosis-related groups by number of Severity of Illness Index levels that each contains.
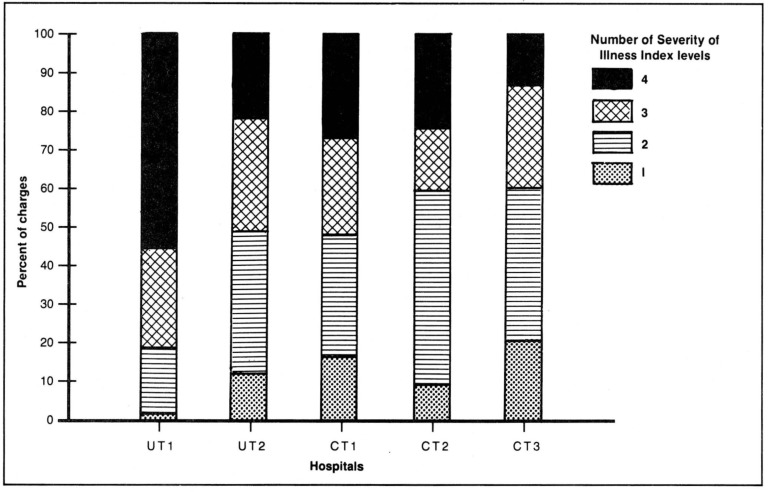
The financial impact of patients in the DRG's that were heterogeneous with respect to severity of illness is shown in Figure 11. The DRG's that contain three or four levels of severity of illness in hospital UT1 (37 percent of all DRG's present in UT1) accounted for 81 percent of the total charges in hospital UT1, compared with 52 percent or less of the charges in the other hospitals. In this respect, hospital CT1 resembled hospital UT2, and hospital C1 resembled hospital CT2. Thus, different percentages of a hospital's revenue are at risk in the DRG's that are heterogeneous.
Figure 11. Percent distribution of charges in diagnosis-related groups, by number of Severity of Illness Index levels that each diagnosis-related group contains.
These findings indicate that there can be large inter-hospital differences in the distribution of severity of illness of patients treated within a DRG. Furthermore, although teaching hospitals frequently treat a greater proportion of more severely ill patients, the severity distributions of the patients in the study hospitals are not predicted reliably by a simple classification by hospital type (teaching versus community) or by number of residents available per bed.
Severity adjustments to the prospective payment system
The prospective payment system based on DRG's is an average-cost-formula system. Claims data in the Health Care Financing Administration Medicare provider analysis and review file supplemented by discharge records from Maryland and Michigan were used to place patients into their designated DRG's, and cost weights per DRG were constructed. These weights reflect the relative costs of treating patients in a particular DRG across all hospitals. The actual DRG payments are computed by multiplying the DRG cost weight by standardized amounts with adjustments for region of the country, differences in wage rates, and differences in number of residents per bed.
A similar process could be carried out using severity-adjusted DRG groups. Collection of severity of illness data could be accomplished simultaneously with the collection of discharge abstract data on which the DRG system is based. Professional Review Organizations, who have been designated to monitor the reliability of discharge abstract data, could also monitor the reliability of severity of illness data.
Implementation of a prospective payment system involves administrative issues of equity, cost and regulatory burden. An equitable distribution of payments is essential to pay hospitals fairly for the efficient production of services performed. Definition of the hospital product as accurately and precisely as possible is of primary importance. Unreliable discharge abstract and severity data from coder errors, incomplete records, and potential “gaming” of the system definitions can be audited and corrected. This problem will exist and will require expense and regulatory efforts to monitor it. To alleviate part of this problem, we are developing a computerized severity of illness information data base that is based on a 6th digit enrichment of the current coding system, the International Classification of Diseases, Ninth Revision, Clinical Modification. This new, richer discharge abstract data set will be the basis for obtaining severity of illness levels from computer algorithms. It will also permit researchers to define and study other case-mix grouping systems from the new discharge data.
As mentioned earlier, a patient may become sicker, and hence may receive a higher severity of illness rating, either because of poor quality of care that allows the patient to develop complications, or a poor clinical choice of therapy, to which the patient does not respond promptly. The consequence of this for a prospective payment system would be a higher payment for iatrogenically caused, as well as naturally, caused, illness. This problem exists, however, in the current DRG prospective payment system, with or without a severity of illness adjustment. What is needed is a good measure of quality of care to correct this problem in any prospective payment system.
Conclusions
A per-case prospective payment system has many of the right incentives to deal with the financial crisis in the health care field. With more accurate descriptions of their “products”, hospitals should be able to manage themselves in a more businesslike manner, and accurate cross-hospital comparisons can be made.
Each individual hospital patient is different, but there are sufficient similarities among patients to allow them to be grouped into medically meaningful homogeneous resource-use groups. Trade-offs between the number of groups in such a grouping system, their medical meaningfulness, their homogeneity, and the robustness of the system against manipulation by hospitals and physicians need to be investigated thoroughly to determine which of the various possible case-mix systems is most suitable for prospective payment purposes. Although our results, which used the Severity of Illness Index for case-mix purposes, are consistent within all the hospitals’ analyses to date, these results could be biased by the self-selection factor of the hospitals that have elected to gather severity data. More data from a greater cross-section of hospital types are needed to determine if these results will continue to hold for all hospitals.
Acknowledgement
The authors wish to acknowledge many valuable comments from Charles R. Buck, Jr., ScD., Executive Director of the Hospital of the University of Pennsylvania, and to thank him for his contributions to this article.
This research was supported by a grant from the Pew Memorial Trust.
References
- Horn SD, Sharkey PD, Bertram D. Measuring severity of illness: Homogeneous case-mix groups. Med Care. 1983 Jan.21:14–31. doi: 10.1097/00005650-198301000-00002. [DOI] [PubMed] [Google Scholar]
- Horn SD. Measuring severity of illness: Comparisons across institutions. American Journal of Public Health. 1983a Jan.73:25–31. doi: 10.2105/ajph.73.1.25. [DOI] [PMC free article] [PubMed] [Google Scholar]
- Horn SD, Sharkey PD. Measuring severity of illness to predict patient resource use within DRG's. Inquiry. 1983 Winter;20:314–321. [PubMed] [Google Scholar]
- Horn SD, Chachich B, Clopton C. Measuring severity of illness: A reliability study. Med Care. 1983 Jul;21:705–714. doi: 10.1097/00005650-198307000-00004. [DOI] [PubMed] [Google Scholar]
- Horn SD. Does severity of illness make a difference in prospective payment? Healthcare Financial Management. 1983b:49–53. [PubMed] [Google Scholar]
- Horn SD, Horn RA, Moses HG. Patterns of physician practice and severity of illness. The Johns Hopkins University; Baltimore, Md.: Mar. 1984. Technical Report Center for Hospital Finance and Management. [Google Scholar]
- Department of Health and Human Services. Hospital prospective payment for Medicare. Washington: Dec. 1982. Report to Congress. [Google Scholar]


