

Abstract
Use of a robust score statistic based on a variance components model to map quantitative trait loci in randomly sampled pedigrees is reviewed. Sibships ascertained through a single proband are discussed. Under a standard assumption of multivariate normality, two suggested methods of ascertainment correction are shown to be asymptotically equivalent when the number of sibships is large.
A seminal contribution to mapping quantitative trait loci (QTL) in humans is the regression method of Haseman and Elston (1). In the past decade this method has, to a considerable degree, been superceded by variance component methods (e.g., refs. 2–6), which are typically more flexible with regard to pedigree structure and more powerful (e.g., refs. 7 and 8). A recent regression-based contribution that contains many of the positive features of variance component methods is provided by Sham et al. (9). See Feingold (10) for a review of and additional references to a rapidly expanding literature.
Although the basic theory associated with these methods presupposes that pedigrees are randomly sampled, in practice, they are often ascertained through one or more probands having particular phenotypic values, e.g., a proband who has an extreme phenotype, perhaps by virtue of being affected by a disease for which the quantitative trait is a diagnostic marker.
This article reviews recent methodological developments in QTL mapping derived under the assumption of random sampling and gives a more detailed analysis of one simple ascertainment method. We begin by reviewing some basic theory, which is closely related to and combines features of both regression and variance components methods. In particular, we review the argument of Tang and Siegmund (11) that a particular parameterization and systematic use of the large-sample statistical theory of score statistics allows one to compute explicitly what would otherwise be very complicated expressions, and, consequently, to understand results that previously were inferred from extensive numerical simulations. Comparison with Regression Methods: Miscellaneous Remarks contains a brief comparison of our method with regression-based methods along with discussion of the underlying assumptions and ways to deal with violations of those assumptions. In Ascertainment we build on the results of first sections to give an analysis of single ascertainment, in particular, a demonstration that two apparently different methods of ascertainment correction (2, 12) are asymptotically equally powerful when the number of pedigrees is large. The case of an arbitrary number of probands and more complete numerical results will be discussed elsewhere. The final section contains a discussion of the implications and limitations of our ascertainment corrections.
Description of the Model
We assume Hardy–Weinberg and linkage equilibrium throughout. This assumption means, in particular, that, for both markers and QTL, haplotypes within the same locus and genotypes among different loci are stochastically independent. Our basic model goes back to the classic article by Fisher (13) for the case of diallelic genes; the general case is discussed by Kempthorne (14). We assume a QTL exists at the genomic location τ. The phenotypic value Y is assumed to be given by
 |
[1] |
The mean value μ can also accommodate covariates in the form of a linear model with minor changes to what follows. The parameter αa = αa(τ) denotes the additive genetic effect of allele a at locus τ; δa,b denotes the dominance deviation of alleles a and b. A subscript x denotes the allele contributed by the mother, whereas a subscript y refers to the father. By standard analysis of variance arguments, we may assume that Eαx = Eαy = E(e) = E[δx,y|x] = E[δx,y|y] = 0. Since by the assumption of Hardy–Weinberg equilibrium x and y are independent (unless the parents are inbred), the different genetic effects in Eq. 1 are uncorrelated. We assume, in addition, that e is uncorrelated with the explicitly modeled genetic effects. The phenotypic variance is  . The variances of the additive and dominance effects associated with the QTL at τ are by definition
  and
and  . Implicitly, we expect that several QTL may occur, which may interact. (An explicit model is given below). For this article we assume that other QTL lie on other chromosomes and are in linkage equilibrium with the QTL at τ. Then, their contribution to the phenotype Y can be assumed to be a part of the residual term e. With the notation
  , it follows that
  .
.
Now consider a pair of siblings satisfying the model (Eq. 1). Recall that at any locus two relatives share alleles identical by descent if they inherit the same alleles from a common ancestor. Two siblings can share 2, 1, or 0 alleles identical by descent depending on whether they inherit the same alleles from both mother and father, from one but not both, or from neither. Let ν = ν(τ) denote the number of alleles identical by descent at τ. Letting Yi denote the phenotypic value of the ith sibling (i = 1, 2), we have (refs. 13 and 14):
 |
[2] |
where r = corr(e1, e2) accounts for the correlation between sibs that arises from other QTL and from a shared environment.
Taking the expectation of Eq. 2, we find the unconditional covariance. Then we can rewrite Eq. 2 in the form
 |
In this equation the terms involving ν have mean 0 and are uncorrelated. In what follows it will be convenient to introduce new parameters  ,
,  , and
, and  , and rewrite the preceding equation in the form
 |
[3] |
(compare with Eq. 4).
Since the QTL location, τ, is unknown, we will be interested in marker loci t distributed throughout the genome and the process ν(t) for a sib pair considered as a stochastic process in t. For markers t1 and t2 on different chromosomes, ν(t1) and ν(t2) are stochastically independent. For markers on the same chromosome Cov[ν(t1), ν(t2)] = 2–1[1 – 2φ], where φ is a function of the recombination frequency. When recombination follows the Haldane model of no interference, 1 – 2φ = exp(–4|t1 – t2|), where the marker location ti denotes genetic distance in morgans (M) from a designated end of the chromosome.
In this article we assume that ν(t) is observable. This assumption is often not satisfied and the process of estimating the value of ν(t) from marker data is quite complex [e.g., Kruglyak et al. (15)]. See Teng and Siegmund (16) for a theoretical analysis of the amount of information lost in this process.
Score Statistics
Suppose we have a sample of N sibships, each of size s. We index sibs within a sibship by i and j and sibships by n = 1,... N. The subscript n is often suppressed in our notation. Let Y = Yn denote the vector of phenotypes in the nth sibship. Let νij(t) denote the number of alleles shared identical by descent at the marker locus t by the ith and jth sibs in the nth sibship. Let Aν denote the s × s matrix with entries νij – 1 for i ≠ j and zeroes along the diagonal, and let Dν denote a similar matrix with off diagonal elements (1/2 – 1{νij = 1}). Let ∑ν = E[(Y – μ)(Y – μ)′|Aν) and ∑ = E[(Y – μ)(Y – μ)′], so from Eq. 3, we have
 |
[4] |
The critical assumption of components of variance linkage analysis is that conditional on Aν, the random variable Y has a multivariate normal distribution. This assumption has mathematical convenience to facilitate the following computations. It cannot be expected to be exactly true even, or perhaps especially, in the case that the QTL are diallelic, so it is important to check (as we discuss below) that the statistical consequences of this assumption are reasonable.
Under the normality assumption, the log likelihood for the QTL at τ is 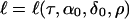 given by
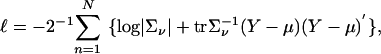 |
[5] |
where ν = ν(τ).
Using the identities ∂ log |G|/∂x = tr(G–1∂G/∂x and ∂G–1/∂x = –G–1∂G/∂xG–1), which are valid for any differentiable nonsingular matrix function, we obtain the score equations:
 |
[6] |
and
 |
where B = ∂∑ν/∂ρ = 11′ – I. We omit the similar expression for  . The Fisher information matrix can be computed as the expected value of
 |
[7] |
and similar expressions for  , etc. Under the null hypothesis that α0 (hence, also δ0) = 0, the scores
  and
and  for the parameters of interest are linear functions of Aν and Dν, which have mean values equal to 0, so they are uncorrelated with the scores
  , and
, and  for the segregation parameters, which depend only on phenotypic data (when α0 = 0).
The score statistic at a given marker location t to test the hypothesis that α0 = 0 is
 |
[8] |
Here, Iαα is the appropriate entry from the Fisher information matrix (i.e., the expected value of Eq. 7); both numerator and denominator are evaluated with α0 = δ0 = 0 and with the nuisance parameters estimated by their maximum likelihood estimates under the condition that α0 = δ0 = 0. A second statistic involving  , which is asymptotically uncorrelated with Eq. 8, can be defined similarly. For ease of exposition we temporarily ignore this second statistic.
It may be shown [Tang and Siegmund (11)] that at a marker t linked to the trait,
 |
[9] |
where φ is as given above and
 |
[10] |
The denominator of the score statistic (Eq. 8) is very sensitive to the assumption of normality. This sensitivity can be mitigated somewhat by considering the conditional distribution of the numerator given the phenotypic observations, Y1,...,YN, which, under the hypothesis α0 = δ0 = 0, is approximately a normal distribution with mean 0 and standard deviation  in large samples. Tang and Siegmund (11) have calculated this quantity, which, when used to standardize
  instead of
  , leads to a statistic that is asymptotically normally distributed whether the normality hypothesis is satisfied or not, and it still has roughly the noncentrality parameter (Eq. 10) if the normality assumption is approximately true.
In the special case of sib pairs, this robust score statistic takes a relatively simple form. One can rewrite Eq. 6 in terms of the uncorrelated variables D = (Y1 – Y2) and S = Y1 + Y2 – 2μ, to obtain
 |
where
 |
We set α0 = δ0 = 0 and replace the segregation parameters μ,  , and ρ by their maximum likelihood estimators under the condition α0 = δ0 = 0 to obtain, say, Ĉn. The robust score statistic at the marker locus t is
 |
[11] |
Its asymptotic expectation is N1/2 times
 |
In the normal case this reduces to Eq. 10 with s = 2.
Genome Scans
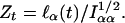
Since we do not know the location of the QTL τ, we scan the genome using
 |
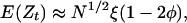
where the max is taken over all marker loci t. To use this statistic, one must establish a detection threshold, zmax, which must be large enough to avoid false-positive errors and small enough to allow detection of true signals. For data involving a large number of pedigrees, so the statistic (Eq. 8) or the robust alternative suggested above is approximately normally distributed, for an idealized genome scan with markers equally spaced at a distance Δ cM in a genome containing c chromosomes of total length L (cM), the following approximation to the genome-wide false-positive rate is given by Feingold et al. (17). Writing P0 to denote probability under the hypothesis that α0 = δ0 = 0, we have
 |
[12] |
where ϕ and Φ are the standard normal density and distribution functions, respectively, and h is the special function discussed by Siegmund (ref. 18, p. 82). The function h can be computed numerically, but the arguments given on pages 210–211 suggest the simple approximation
 |
Some numerical exploration shows that this is a surprisingly good approximation for all x > 0. For a comprehensive discussion of genome-wide significance thresholds in linkage analysis see Lander and Kruglyak (19).
As a numerical example, for sib pairs, a 22-chromosome 3,300-cM human genome and markers equally spaced at 5 cM, a threshold of approximately zmax = 3.73 produces the conventional 0.05 false-positive error rate. Similar approximations for the power (17) show that a noncentrality parameter of N1/2ξ = 5 produces power of ≈0.91 to detect a QTL located at a marker and 0.87 when the QTL is midway between markers (compare Eqs. 9 and 10). The adequacy of the approximation (Eq. 12) and modifications to deal with different formulations are discussed below.
Comparison with Regression Methods: Miscellaneous Remarks
The preceding argument is in the spirit of variance components, which are often contrasted with “regression-based” methods. The conventional wisdom is that variance components are more flexible in dealing with large pedigrees and more efficient when the normality assumption is approximately satisfied but less robust against violations of the assumption of normality (e.g., refs. 9 and 10). However, the efficient score,  , derived from a variance components model is of the form of a covariance, so if it is standardized by a nonparametric estimator of its standard deviation, as suggested above, one obtains a regression-like statistic (compare Eq. 11) that is robust against nonnormality under the null hypothesis of no linkage. In fact, the original Haseman–Elston regression statistic for sib pairs can be deduced by a similar line of reasoning by starting from the likelihood function for D alone and ignoring S. The “new” Haseman–Elston statistic (20) can be derived by starting with the likelihood function for S2 – D2.
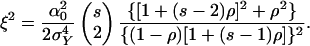
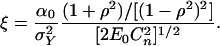
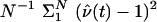
It is straightforward to show that when the phenotypes are close to normally distributed the asymptotic squared noncentrality parameter (per sib pair) for the classical Haseman–Elston statistic is
 |
whereas that of the new Haseman–Elston statistic is
 |
By comparing these statistics with Eq. 10 with s = 2, one sees that under the normality assumption (Eq. 8) has greater asymptotic power, sometimes much greater, than either of the Haseman–Elston statistics, the first of which has comparable power when ρ is large, whereas the second has comparable power when ρ is small.
The Haseman–Elston approach is inefficient because it reduces data that is fundamentally two-dimensional (when s = 2) to one dimension. A multivariate regression-based method was introduced recently by Sham et al. (9), and it appears to be essentially equivalent to the robust variance components method described above. In particular, Sham et al. show that for their method the asymptotic noncentrality parameter of a sibship of size s is also given by Eq. 10.
A possible advantage of the regression approach is that there is some flexibility in the assumed covariance of the dependent variables, hence, in the weights of the resulting generalized least-squares estimators. Sham et al. (9) choose a covariance function that would be optimal under an assumption of multivariate normality. Xu et al. (21) suggest a different choice, which they have developed only for sib pairs but which, according to Cuenco et al. (22), may have some advantages when trait distributions are far from normal.
Remarks
In our analysis the primary role of the normality assumption is to suggest the form of the statistic given in Eq. 6, which as noted above can be regarded as a covariance between a function of phenotypes and identity by descent counts. An alternative to the normality assumption that is equally tractable is the multivariate t distribution [cf. Lange et al. (23)]. This assumption leads to a similar statistic, but, because of the heavier tails of the t distribution, it is more robust to outliers in the data. However, it cannot avoid problems that arise from modeling the complexities of multivariate dependence by multivariate distributions that measure dependence only by pairwise correlations.
-
In the preceding argument we assumed completely informative markers to simplify the analysis and made the working assumption that the QTL τ is one of the markers. If either of these assumptions fails to be true, the likelihood function involves a mixture based on the conditional distribution of ν(τ) given the marker data, say M, in the nth family. A convenient representation for the likelihood function is
 , where M denotes marker data,
  is given by Eq. 5, and E0 denotes expectation under the hypothesis that α0 = δ0 = 0. When this hypothesis holds, one sees from Eq. 6 that
  is linear in Aν. Hence, the numerator of the score statistic for partially informative markers is the same as for fully informative markers, but Aν is replaced by its conditional expectation
  . The likelihood ratio statistic is nonlinear in the Aν. Hence, it requires a more complicated calculation, although it has been observed in Monte Carlo studies (e.g., ref. 4) that simply replacing Aν by E0[Aν|M] can produce excellent results. Since the score and likelihood ratio statistics are asymptotically equivalent when α0 and δ0 are small, the preceding observation about the score statistic provides a theoretical basis for understanding these Monte Carlo results.
The denominator of the score statistic must also be modified to account for partially informative markers. For example, for sib pairs the 1/2 in the denominator of Eq. 11 arises there as the value of E0[(ν(t) – 1)2], which can be estimated by, for example,
 . For other estimators and a comparative evaluation see Cuenco et al. (22).
The effect of partially informative markers is to increase the autocorrelation of the score statistic and hence to make the approximation given in Eq. 12 somewhat conservative. Although this issue has not received a satisfactory theoretical analysis, there is numerical evidence that the effect is relatively modest (cf. ref. 16).
-
Other reasons exist that the approximation Eq. 12 may fail to be adequate. The most important is that the distribution of Zt can fail to be approximately normal. This distribution can be skewed if large sibships or pedigrees containing more distant relatives than siblings are involved, and it can have excess kurtosis if the phenotypic distributions do. Tang and Siegmund (11) suggest a modification of Eq. 12 that accounts for skewness. This approximation can also be adapted to account for kurtosis. The parameters for skewness and kurtosis should be determined from the conditional distribution of Zt given the phenotypes and will involve the empirical distribution of the phenotypes.
Although Eq. 10 suggests that large sibships may be substantially more powerful than small sibships, a larger threshold is also required because of skewness in the distribution of Eq. 8. Tang and Siegmund (11) show that after adjusting for the larger threshold the power of large sibships turns out to be considerable, although it is not as great as it would appear from the noncentrality parameter alone.
If it is thought that dominance may play an important role, one can also consider a second degree of freedom
 , which is uncorrelated with
  when α0 = δ0 = 0. At a QTL τ it has a noncentrality parameter proportional to
  . (The constant of proportionality is the same as in Eq. 10, except that 2 is replaced by 4 in the denominator.) However, since
 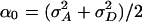 involves the dominance variance and exceeds
  , it turns out that the second degree of freedom rarely adds substantially to the power to detect linkage. See ref. 24 for the modification to Eq. 12 required by the two-dimensional statistic and the constraint 0 ≤ δ0 ≤ α0.
The model (Eq. 1) is very flexible in many respects. For example, it can accommodate multivariate phenotypes, although this accommodation leads to multivariate statistics and hence requires a higher detection threshold to maintain the same false-positive error rate. If one uses for two phenotypes a 3 df statistic involving additive effects on each of the phenotypes and the correlation of these effects, an extension of the method of Dupuis and Siegmund (24) allows one to determine approximate significance thresholds and power. In comparison with the threshold zmax = 3.73 and noncentrality of N1/2ξ ≈ 5 for ≈90% power discussed above for a single trait, the corresponding threshold and noncentrality parameter would increase to zmax = 4.50 and N1/2ξ ≈ 5.50. Such an increase in noncentrality would be greatest when QTL for each trait are tightly linked or even identical because of pleiotropy. A detailed numerical study is required to determine more precisely the conditions under which use of multivariate phenotypes is advantageous. Wang (25) contains a related discussion.
- The model (Eq. 1) can also be expanded to include multiple, possibly interacting, QTL. Assuming for simplicity that no dominance exists, then for two QTL at unlinked loci τ and
 , the phenotype Y is given by
Here αa denotes the additive effect of allele a at locus τ, γa,ã denotes the additive–additive interaction of alleles a at τ and ã at
 , etc. As before,
  is twice the variance of the additive effect αx, whereas
 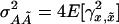 is the –additive interaction additive feature of this model is that the variance. A perhaps surprising essential ingredient of the noncentrality parameter of
  is now
 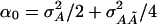 , i.e., a fraction of the interaction variance involving the QTL at τ and
  enters into the noncentrality of the score statistic that tests for an additive effect at τ only. The score for the additive–additive interaction effect has expectation proportional to
  . Its squared noncentrality equals 1/2 of Eq. 10 with α0 replaced by γ0, so much of the effect of the interaction variance component appears in the noncentrality parameter of the statistic to test for a main effect. This fact is similar to the phenomenon in Remark iv regarding dominance and is quite different from the situation in experimental genetics, where in a backcross or intercross the noncentrality parameters of statistics that test for main effects are unaffected by interactions with unlinked QTL.
 Some of the calculations reported above about the asymptotic noncentrality parameter of the robust score statistic, when the normality assumption is violated, are based on the fact that the expected value of
 is asymptotically the same as the value one obtains when the normality assumption holds. At first glance, this equality seems almost obvious, since for known nuisance parameters evaluation of
  depends only on the validity of Eq. 4, which in turn depends only on the basic genetic model, not the normality assumption. However, the segregation parameters μ,
  , and ρ must be estimated, so one must show that this effect, which, under the normality assumption is negligible as a consequence of the orthogonality of the segregation and linkage parameters, is also negligible without that assumption. This effect can be demonstrated by a lengthy Taylor series approximation coupled with the observation that in the term contributed by the nth pedigree the nuisance parameters can be estimated almost equally well by the phenotypic variables from the other N – 1 pedigrees, which then would give an estimate that is independent of the data in the nth pedigree. We omit the details.
Ascertainment
When pedigrees are ascertained by random sampling, the nuisance parameters μ,  , and ρ are easily estimated. In many cases, however, pedigrees are ascertained through the phenotypes of one or more probands, and phenotypes are determined only for ascertained pedigrees. Here we consider the simplest possible situation, where each sibship contains one proband, with phenotypic value Y1; and we are particularly interested in the case where ascertainment is based on a threshold T, so a sibship is ascertained if the proband's phenotype satisfies Y1 ≥ T. As we observe below, the efficient score,
  , has the same form as in the case of random ascertainment; but the estimators of segregation parameters involve an ascertainment correction.
Single ascertainment, as described in the preceding paragraph, has been studied by Elston and Sobel (12), who suggest that one correct for ascertainment by conditioning on the event that a pedigree is ascertained, and by Hopper and Mathews (2), who suggest conditioning on the phenotypic value of the proband (cf. also ref. 26). Using simulation, Andrade and Amos (27) have compared these suggestions and have found that the two methods are comparable. Below we show that, in fact, they are asymptotically equivalent when the number of sibships is large, so the results obtained by simulation are exactly as expected. Ascertainment based on an arbitrary number of probands and more detailed numerical results when the ascertainment rule is not so easily specified will be discussed in a future paper.
The phenotypic vector Y can be partitioned into (Y1,Y(2)), where Y1 is the phenotype of the ascertained sibling. We begin by considering a conditional analysis of Y(2) give the value Y1. For notational simplicity we assume  . Because the efficient score for
  turns out to be uncorrelated with the efficient score for α0, this has no effect on the asymptotic theory that follows. Let μν = E(Y(2)|Y1,Aν). Assume for simplicity that there is no dominance, i.e., δ0 in Eq. 4 equals zero. Then μν = μ1 + (Y1 – μ)(ρ1 + α0aν), where 1 is an s – 1 dimensional vector with 1 at each entry, ρ and α0 have the same meaning as above, and
 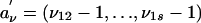 . Also let
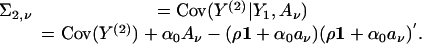 |
The conditional log likelihood given Y1, Aν is exactly of the form of Eq. 5, but with Y replaced by Y(2), μ replaced by μν, ∑ν replaced by ∑2,ν, and the sum is over ascertained sibships.
It is readily verified that the derivative with respect to α0 of ∑2,ν is 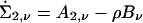 , where Bν = aν1′+ 1a′ν. The efficient score for α0 evaluated at α0 = 0 is
 |
[13] |
where μ(2) is μν evaluated at α0 = 0 and ∑2 = Cov(Y(2)|Y1). Expressions can also be obtained for  and
and  , which when α0 = 0 do not depend on ν, hence are conditionally, given Y1, uncorrelated with
  .
.
From the second derivative,  , one finds that when α0 = 0
 |
It is easy to see that  . Hence the conditional Fisher information is
 |
[14] |
and some additional calculation along the lines of Tang and Siegmund (11) shows that  .
.
The asymptotic conditional noncentrality parameter is
 |
[15] |
The expectation on the right-hand side of Eq. 14 can be evaluated by direct calculations or indirectly by observing that for random ascertainment the expected value of Eq. 14 must equal the unconditional Fisher information, which simply the factor multiplying  in Eq. 10. (Recall that we are now taking
  for notational convenience.) In particular,
 |
[16] |
Because this expression is somewhat complicated for general s, we specialize to s = 2, for which we obtain
 |
[17] |
where S denotes the set of phenotypes for which a proband is ascertained. In large samples, by the law of large numbers the frequency of ascertained sibships converges to P{Y1 ∈ S}, and the average value of 1{Y1 ∈ S}(Y1 – μ)2 converges to E[(Y1 – μ)2; Y1 ∈ S]. Hence, the large sample noncentrality per ascertained sibship is
 |
[18] |
which is consistent with Eq. 10 when s = 2 and all sibships are ascertained.
For a simple numerical example, it follows from Eq. 18 that if ascertainment is based on the upper 10% of the population phenotype, the number of sib pairs that must be genotyped is roughly 1/3 as many in random sampling. For sibships of size s = 4, about 1/2 as many ascertained sibships must be genotyped as random sibships. This gain in genotyping efficiency is smaller with a less stringent ascertainment criterion and with larger sibships.
Observe that, although we have begun the preceding analysis from an analytic expression for the conditional log likelihood given Y1, one could equally well begin by writing the conditional log likelihood in the form of the sum of the unconditional log likelihood given in Eq. 5 and the negative log of the marginal probability density function of Y1. Since this marginal probability does not depend on the genetic parameters α0, δ0, the efficient score  has the same form as in the case of random ascertainment (i.e., the expressions in Eq. 6 evaluated at α0 = 0 and in Eq. 13 are equal), but the estimates of segregation parameters that enter into the final statistic are now determined by conditioning on Y1.
In the case that we condition on the event that a sibship is ascertained, i.e., that Y1 ∈ S, rather than the value of Y1, the analysis is almost the same. The log likelihood function will now equal the sum of Eq. 5 and the additional term –log(P{Y1 ∈ S}); but since the distribution of Y1 involves only the segregation parameters, μ, ρ, and  , the efficient score
  is again unchanged. The efficient scores for the segregation parameters will change, but they are still uncorrelated with
  when α0 = 0. Consequently, the estimates of the segregation parameters will be different, but the asymptotic noncentrality parameter is still given by Eq. 16. Note, however, that when conditioning on the exact phenotypic values of the ascertained siblings, the number r of ascertained siblings must be less than s, whereas in principle an ascertainment rule can involve all siblings if one conditions on the event of ascertainment. Thus, Risch and Zhang (28) discuss an ascertainment rule that involves both siblings of a sib pair, but their method has the disadvantage that it is most efficient when ascertainment involves fairly extreme phenotypes, and it does not extend in an obvious way to larger sibships.
Discussion of Ascertainment Corrections
In this article we have described a components of variance method of linkage analysis in sibships when sibships are either randomly ascertained or ascertained through a single proband. The method in principle is easily adapted to pedigrees other than sibships, although explicit results can be obtained in only a few special cases.
The most serious impediment to use of ascertainment corrections is lack of knowledge of the true ascertainment rule. To some extent this problem is mitigated by conditioning on the exact phenotypic value of the proband(s), but this just removes the problem to the definition of the proband(s). For example, if the proband is identified through diagnosis of a disease related to the quantitative phenotype, should the ascertainment event be (as we have assumed) that a particular sib has the disease, that at least one sib has the disease, or something in between?
An appealing design that avoids some of these fundamental conceptual difficulties is to ascertain nuclear families through parents. This design may often involve both parents, but if a trait is of primary interest in only one sex, e.g., bone mineral density as a quantitative trait in women as it relates to osteoporosis, ascertainment through a particular parent may be relevant. In such a case, the analysis is simpler than that given above, since the conditional means and covariances do not depend on the number of alleles inherited identical by descent between proband and offspring, which is always one. The noncentrality parameter is of the same form as Eq. 10, but with the sib correction ρ replaced by the conditional correlation  , where
  is the phenotypic correlation of parent and offspring. For traits that are purely additive and have no shared environmental covariance,
  .
.
The normality assumption, which yields simple formulas for the conditional phenotypic expectations, variances and covariances given the phenotypes of ascertained relatives, plays an important role in the ascertainment corrections obtained in this article. The robustness of the resulting procedures and how they might be modified to become more robust to violations of the normality assumption and, perhaps even more importantly, to violations of the assumed method of ascertainment should be studied and reported in detail.
Acknowledgments
This research was supported by National Institutes of Health Grant R01 HG00849-09 and by a Stanford Graduate Fellowship.
This contribution is part of the special series of Inaugural Articles by members of the National Academy of Sciences elected on April 30, 2002.
Abbreviation: QTL, quantitative trait loci.
See accompanying Biography on page 7843.
References
- 1.Haseman, J. K. & Elston, R. C. (1972) Behav. Genet. 2, 3–19. [DOI] [PubMed] [Google Scholar]
- 2.Hopper, J. L. & Mathews, J. D. (1982) Ann. Hum. Genet. 46, 373–383. [DOI] [PubMed] [Google Scholar]
- 3.Amos, C. I. (1994) Am. J. Hum. Genet. 54, 535–543. [PMC free article] [PubMed] [Google Scholar]
- 4.Fulker, D. W. & Cherny, S. S. (1996) Behav. Genet. 26, 527–532. [DOI] [PubMed] [Google Scholar]
- 5.Almasy, L. & Blangero, J. (1998) Am. J. Hum. Genet. 62, 1198–1211. [DOI] [PMC free article] [PubMed] [Google Scholar]
- 6.Williams, J. T. & Blangero J. (1999) Ann. Hum. Genet. 63, 545–563. [DOI] [PubMed] [Google Scholar]
- 7.Teng, J. (1996) Ph.D. thesis (Stanford University, Stanford, CA).
- 8.Wright, F. (1997) Am. J. Hum. Genet. 60, 740–742. [PMC free article] [PubMed] [Google Scholar]
- 9.Sham, P. C., Purcell, S., Cherny, S. S. & Abecasis, G. R. (2002) Am. J. Hum. Genet. 71, 238–253. [DOI] [PMC free article] [PubMed] [Google Scholar]
- 10.Feingold, E. (2002) Am. J. Hum. Genet. 71, 217–222. [DOI] [PMC free article] [PubMed] [Google Scholar]
- 11.Tang, H.-K. & Siegmund, D. (2001) Biostatistics 2, 147–162. [DOI] [PubMed] [Google Scholar]
- 12.Elston, R. C. & Sobel, E. (1979) Am. J. Hum. Genet. 31, 62–69. [PMC free article] [PubMed] [Google Scholar]
- 13.Fisher, R. A. (1918) Trans. R. Soc. Edinburgh 52, 399–433. [Google Scholar]
- 14.Kempthorne, O. (1957) Genetic Statistics (Wiley, New York).
- 15.Kruglyak, L., Daly, M. J., Reeve-Daly, M. P. & Lander, E. S. (1996) Am. J. Hum. Genet. 58, 1347–1363. [PMC free article] [PubMed] [Google Scholar]
- 16.Teng, J. & Siegmund, D. (1999) Biometrics 54, 379–411. [PubMed] [Google Scholar]
- 17.Feingold, E., Brown, P. O. & Siegmund, D. (1993) Am. J. Hum. Genet. 53, 234–251. [PMC free article] [PubMed] [Google Scholar]
- 18.Siegmund, D. (1985) Sequential Analysis: Tests and Confidence Intervals (Springer, New York).
- 19.Lander, E. S. & Kruglyak, L. (1995) Nat. Genet. 11, 241–247. [DOI] [PubMed] [Google Scholar]
- 20.Elston, R., Buxbaum, S., Jacobs, K. B. & Olson, J. M. (2000) Genet. Epidemiol. 19, 1–17. [DOI] [PubMed] [Google Scholar]
- 21.Xu, X., Weiss, S., Xu, X. & Wei, L. J. (2000) Am. J. Hum. Genet. 67, 1025–1028. [DOI] [PMC free article] [PubMed] [Google Scholar]
- 22.T.Cuenco, K., Szatkiewicz, J. P. & Feingold, E. (2003) Am. J. Hum. Genet. 73, 863–873. [DOI] [PMC free article] [PubMed] [Google Scholar]
- 23.Lange, K. T., Little, R. J. A. & Taylor, J. M. G. (1989) J. Am. Stat. Assoc. 84, 881–896. [Google Scholar]
- 24.Dupuis, J. & Siegmund, D. (2000) Game Theory, Optimal Stopping, Probability and Statistics, eds. F. Thomas Bruss and L. Le Cam (Institute of Mathematical Statistics, Hayward, CA) pp. 141–152.
- 25.Wang, K. (2003) Hum. Hered. 55, 1–15. [DOI] [PubMed] [Google Scholar]
- 26.Beaty, T. H. & Liang, K. Y. (1987) Genet. Epidemiol. 4, 203–210. [DOI] [PubMed] [Google Scholar]
- 27.Andrade, M. & Amos, C. I. (2000) Genet. Epidemiol. 19, 333–344. [DOI] [PubMed] [Google Scholar]
- 28.Risch, N. & Zhang, H. (1995) Science 268, 1584–1589. [DOI] [PubMed] [Google Scholar]