

Abstract
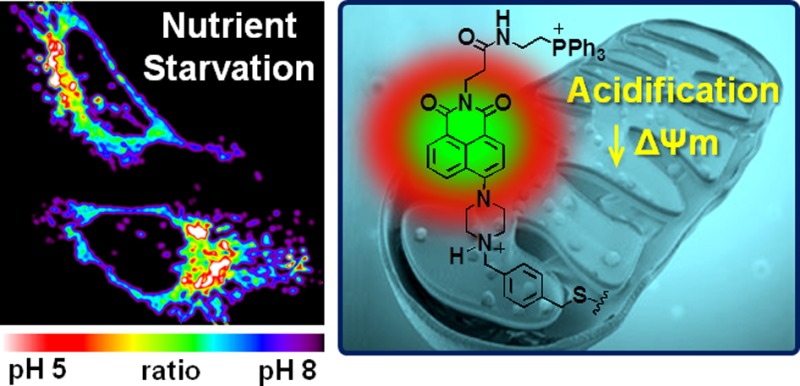
We report here a mitochondria-targetable pH-sensitive probe that allows for a quantitative measurement of mitochondrial pH changes, as well as the real-time monitoring of pH-related physiological effects in live cells. This system consists of a piperazine-linked naphthalimide as a fluorescence off–on signaling unit, a cationic triphenylphosphonium group for mitochondrial targeting, and a reactive benzyl chloride subunit for mitochondrial fixation. It operates well in a mitochondrial environment within whole cells and displays a desirable off–on fluorescence response to mitochondrial acidification. Moreover, this probe allows for the monitoring of impaired mitochondria undergoing mitophagic elimination as the result of nutrient starvation. It thus allows for the monitoring of the organelle-specific dynamics associated with the conversion between physiological and pathological states.
Introduction
Mitochondria play critical roles in cellular metabolism, including energy production through the respiratory chain,1 cell signaling via reactive oxygen species production,2,3 regulation of Ca2+ homeostasis,4,5 and the triggering of cell death.5,6 The unique function of mitochondria depends on the mitochondrial pH. For example, under physiological conditions, mitochondria maintain an alkaline matrix (pH ∼ 8) reflecting proton extrusion across the inner membrane via the respiratory electron transport chain.7,8 This provides a proton-motive force (ψH+) that serves to generate ATP via H+-ATP synthase.2 A breakdown in this normal function leads to the production of reactive oxygen species (ROS), such as superoxide, hydroxyl radicals, and hydrogen peroxide, which act as signaling molecules to initiate apoptosis.9 The proton-motive force further acts to regulate Ca2+ homeostasis,10,11 which in turn modulates dehydrogenase activity associated with the tricarboxylic acid (TCA) cycle,12 adenine nucleotide translocase,13 and ATP synthase.14
Not surprisingly, alterations in mitochondrial baseline pH are a key feature of abnormal cells. For instance, inhibition of mitochondrial function typically results in mitochondrial depolarization.15−17 Mitochondria acidification is also seen during the mitophagic elimination (mitophagy) of malfunctioning mitochondria through lysosomal fusion.18,19 Abnormal levels of mitophagy are associated with various pathological conditions, including cardiovascular diseases,20 neurodegenerative diseases,21 Reye’s syndrome,22 among others. Thus, being able to probe in greater detail the mitochondrial pH, particularly changes associated with mitophagy, could provide new insights into the central features of mitochondrial function under both physiological and pathological conditions.
To the best of our knowledge, fluorescent chemical probes that permit the selective monitoring of baseline mitochondrial pH values and the specific effect of pathogenic events have yet to be reported. Although classic cytosolic pH probes have been used for mitochondrial pH measurements,15,16,23−25 their use requires conditions that restrict their utility, such as working with isolated mitochondria20 or permeabilized cells.15 Biological systems, including green fluorescent proteins (GFPs) modified with mitochondrial targeting peptides, have been successfully used in certain cases to measure mitochondrial pH in intact cells.7,8,26 However, complications such as improper protein expression and misfolding into a nonfluorescent state have been reported.27 Moreover, in contrast to genetically encoded probes, small fluorescent probes are expected to be more readily applicable for use in native cells. This provides an incentive to develop small molecule probes that would allow mitochondrial pH levels to be monitored in living cells.
In recent years, a number of fluorescent probes based on naphthalimide derivatives have been reported, and their potential utility in biological sensing and imaging established in a variety of contexts.28 However, to our knowledge naphthalimide derivatives that can target mitochondria in live cells and allow mitochondrial pH changes to be monitored directly have not hitherto been reported.
Here, we present a new, biocompatible pH-sensitive fluorescent probe 1 consisting of linked piperazine naphthalimide, triphenylphosphonium, and benzyl chloride moieties. As illustrated schematically in Figure 1a, the cationic triphenylphosphonium subunit29 was expected to facilitate the accumulation of probe 1 in mitochondria as the result of charge considerations resulting from the membrane electrical potential (Δψm), which makes the inner surface is negative. In addition, the benzyl chloride functionality was expected to immobilize probe 1 within the mitochondria as the result of nucleophilic substitution with reactive thiols present in various mitochondrial proteins.30 On the basis of this dual localization effect, it was predicted that probe 1 would remain in the mitochondria even after acidification or membrane depolarization. Finally, the piperazine-based naphthalimide group was expected to provide a fluorescence “off–on” signal turn on at acidic pH through protonation-induced inhibition of the photoinduced electron transfer (PET) that takes place in the neutral form.31,32
Figure 1.
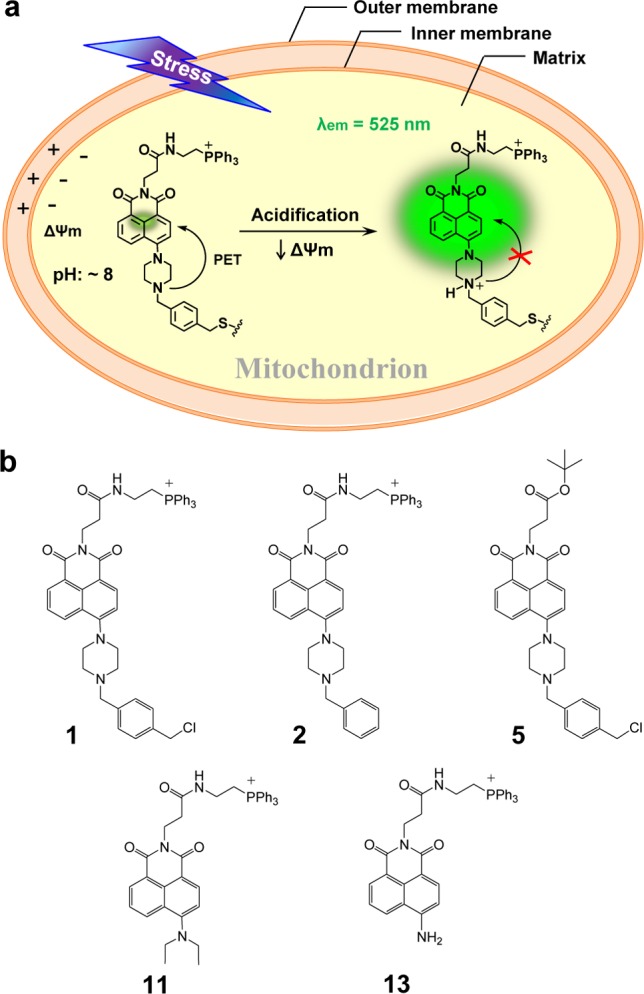
Proposed mitochondrion-specific pH sensing mechanism for probe 1 and fluorescent compounds used in this study. (a) As designed, probe 1 is expected to localize in the mitochondrial matrix where it will be bound covalently to mitochondrial proteins through reaction with cysteine thiol residues. The probe is expected to give rise to a diagnostic fluorescence off–on signal at 525 nm in response to a reduction in the pH. As detailed in the text proper, this probe effect is ascribed to the quenching of the photoinduced electron transfer (PET) from the piperazine ring to the naphthalimide subunit that occurs in the neutral form. (b) Structures of probe 1 and control systems 2, 5, 11, and 13.
Results and Discussion
Compounds 1, 2, 5, 11, and 13 were prepared via the synthetic routes outlined in Figures S1–S4. In this study, compounds 2 and 5, lacking the benzyl chloride or triphenylphosphonium unit, were used as control systems to verify the target specificity and immobilization of 1 to mitochondria in living cells, respectively. Control systems 11 and 13(33) were designed to demonstrate the proposed PET off–on mechanism of 1. The structures of all new compounds were confirmed by 1H- and 13C NMR spectroscopy, as well as ESI-MS spectrometry (Figures S21–S46). Full synthetic procedures are provided in the Supporting Information.
As a starting point, we investigated the pH effect on the fluorescence behavior of the piperazine-naphthalimide subunit present in probe 1. It was recognized that the benzyl chloride moiety in probe 1 could interfere with the fluorescence response due to its potential hydrolysis or reaction with other entities present in biological milieus. Therefore, compound 2, an analogue of 1 lacking the benzyl chloride functionality, was used to probe the effect of pH. This was done using both UV–vis absorption and fluorescence emission spectroscopy. As shown in Figure 2a, as the pH decreases from 11 to 2, the absorption band of 2 gradually shifts from 411 to 391 nm with a distinct isosbestic point being observed at 409 nm.31 The fluorescence intensity at 525 nm undergoes a concomitant monotonic increase (Figure 2b). A quantitative analysis of the fluorescence intensity at 525 nm vs pH (Figure 2c) revealed a 21-fold (from 143.83 ± 6.56 to 6.99 ± 1.01) increase as the pH range is lowered from 11 to 2. A plot of fluorescence intensity (FI) vs pH is linear over the pH range of 5 to 7.5 (R2 = 0.99253). The pKa of 2 was calculated to be 6.18 ± 0.049 (Figure S5). However, in the case of control compounds 11 and 13, analogues of 1 and 2 that lack the piperazine ring, no fluorescence changes are seen as a function of variations in the pH (Figures S6 and S7). This supports the contention that the pH-dependent fluorescence behavior seen in the case of 2, and by extension 1, is due to a PET effect as suggested in Figure 1a. Suitably designed probes containing a piperazine-naphthalimide core were thus expected to produce the desired fluorescence response and to have the sensitivity needed to follow mitochondrial pH changes, including those accompanying the conversion from a physiological to a pathological state.
Figure 2.
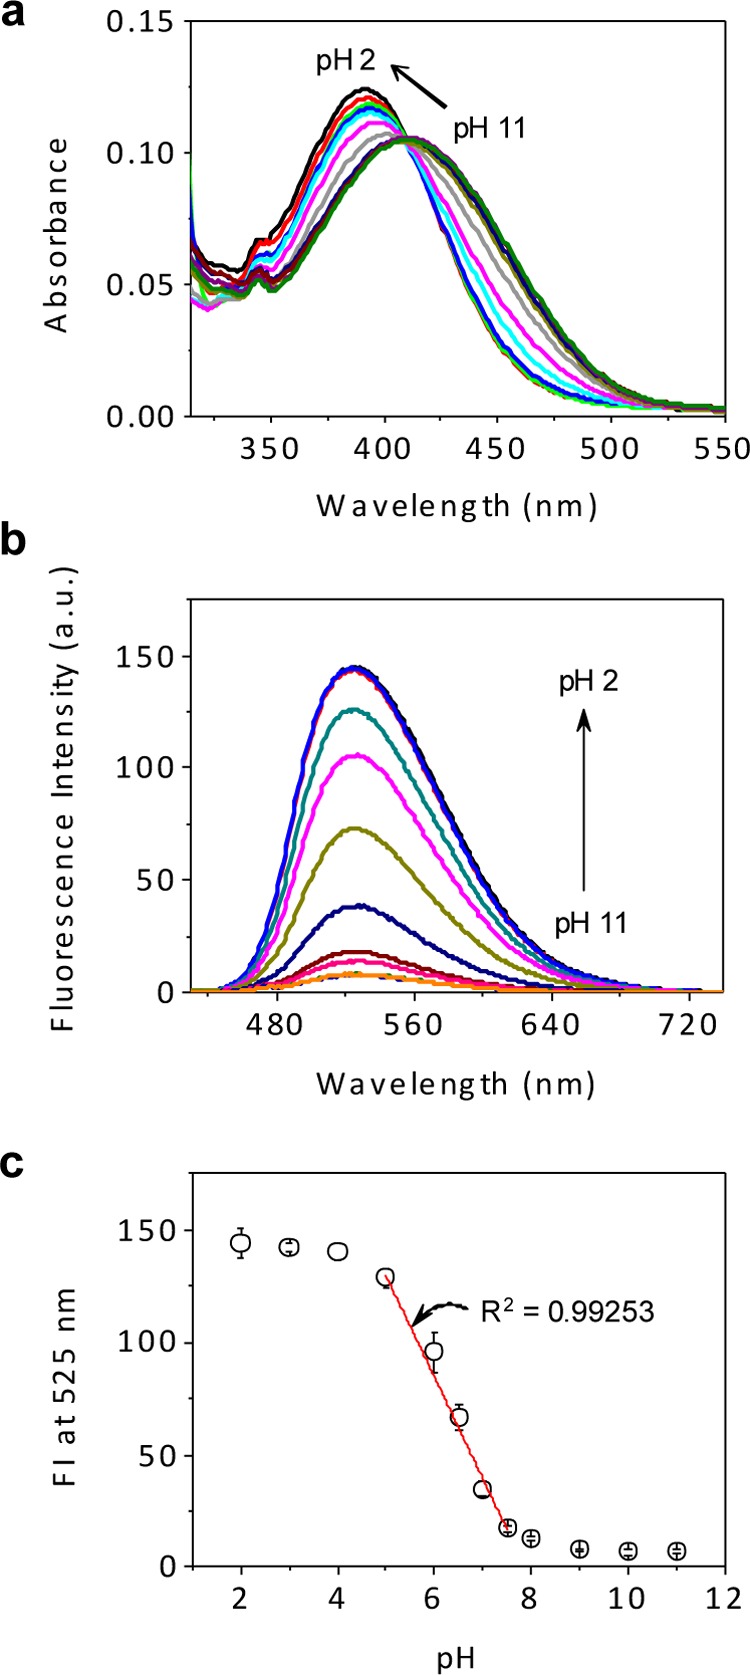
Changes in the optical features of 2 as a function of pH. Absorption (a) and fluorescence (b) spectra of 2 (10.0 and 1.0 μM, respectively) recorded at different pH values (2.0, 3.0, 4.0, 5.0, 6.0, 6.5, 7.0, 7.5, 8.0, 9.0, 10.0, 11.0). (c) Plot of fluorescence intensity (FI) at 525 nm vs pH. The dots are based on the average of three separate measurements with the error bars showing the standard deviation. All data were obtained using an excitation wavelength of 407 nm in 33 mM buffer solution containing 1% (v/v) DMSO at 37 °C.
The possible interference of other analytes was tested. Toward this end, the fluorescence spectrum of 2 was recorded in the absence and presence of various essential metal ions (Na+, K+, Ca2+, etc., as their chloride salts), as well redox substances associated with oxidative stress, including metabolic thiols (GSH, Cys, Hcy) and H2O2 under model physiological conditions (PBS solution at pH 7.4, 37 °C). As shown in Figure S8, no noticeable changes were observed in the case of any of these potential interferants. On this basis, we propose that probe 1 may be used to monitor intracellular pH without interference from other biologically relevant analytes.
In order to confirm the presumed mitochondrial target specificity of 1, colocalization experiments involving 1 were performed in HeLa cells using a known mitochondrion-specific fluorescent probe, MitoTracker Red (MTR). As expected, the fluorescence image produced using 1 overlaps with that obtained using MTR (Pearson’s correlation coefficient: 0.87) (Figure 3). Similar findings were found in the case of 2 (Pearson’s correlation coefficient: 0.82) (Figure S9). In contrast, with 5, a control system lacking the triphenylphosphonium, a poor overlap between the fluorescence of the test compound and MTR was found (Pearson’s correlation coefficient: 0.78) (Figure S10).
Figure 3.
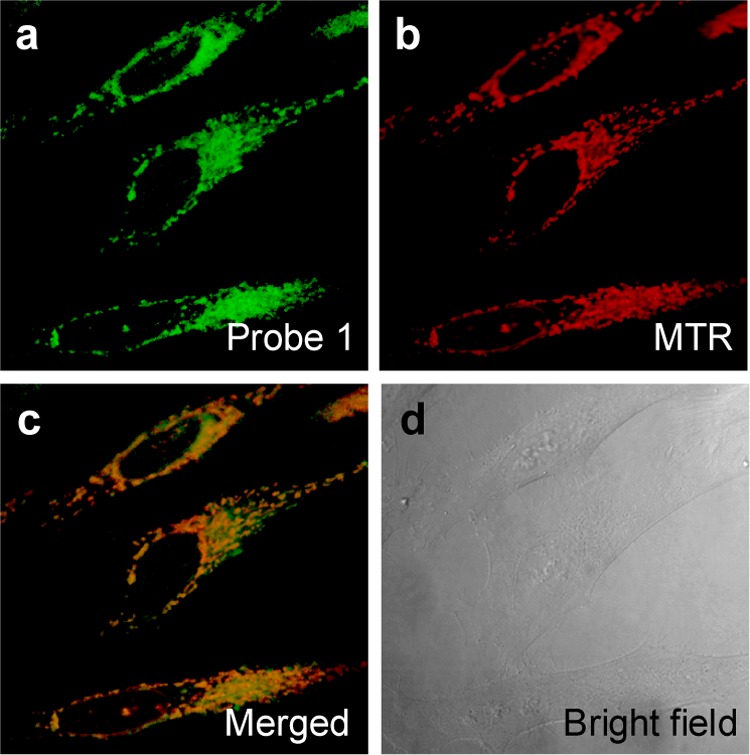
Colocalization experiments involving probe 1 and MitoTracker Red (MTR) in HeLa cells. The cells were incubated with 1 (5.0 μM) for 10 min at 37 °C, and the medium was replaced with fresh medium containing MTR (5.0 μM) and incubated for 10 min. Images for 1 (a) and MTR (b) were then recorded using excitation wavelengths of 488 and 633 nm, and band-path emission filters at 500–550 nm and 700–750 nm, respectively. Panels (c) and (d) show a merged image of (a) and (b) and the corresponding bright field image, respectively.
A separate set of control studies were carried out to determine cell compatibility. It was found that probe 1 displays negligible cytotoxicity in HeLa cells, as inferred from an MTT assay (cf. Figure S11).
Immobilization of 1 within the mitochondria was believed critical in preventing leakage of the probe from the mitochondria under conditions of cell depolarization associated with, e.g., a pathogenic event. To verify immobilization of 1 to the mitochondria in living cells, confocal microscopic experiments were performed in the absence and presence of carbonyl cyanide m-chlorophenyl hydrazone (CCCP). This agent induces an uncoupling of the mitochondrial membrane potential (Δψm).34 It can thus be used in the present context to distinguish between cationic fluorophores that are electrophoretically accumulated into the mitochondria as the result of a negative inner potential Δψm and those that are covalently bound and thus not capable of leaking out once depolarization occurs. In terms of experiment, HeLa cells were separately pretreated with media containing 1 and 2 (5.0 μM each) for 5 h at 37 °C, respectively. The media were then replaced with PBS containing CCCP (10.0 μM) and incubated for 1 and 6 h at 37 °C, respectively. As can be seen from an inspection of Figure 4a, the fluorescence image produced by 1 is retained even after 6 h incubation of CCCP. In contrast, the fluorescence image of 2, a reference, benzyl chloride-free analogue of 1, fades with time when the cellular incubation is carried out in the presence of CCCP. From this explicit difference, we conclude that probe 1 is firmly immobilized within the mitochondria in living cells; presumably, this reflects reaction of the benzyl chloride with endogenous nucleophiles as implied in Figure 1a.
Figure 4.

Analysis of probe 1 immobilized in mitochondria of HeLa cells. (a) The effect of CCCP, a recognized mitochondrial uncoupler, on the fluorescence confocal images of compounds 1 and 2 in HeLa cells. The lower images represent the corresponding bright field images. (b) 2D-gel of proteins collected from cells incubated with 1 for 5 h at 37 °C. The dotted lines define areas of Typhoon and CBB (coomassie brilliant blue) staining. These images were pseudocolored with green and red, respectively, and merged. Bands corresponding to fluorescent 1-fixed proteins are shown with arrows. Typhoon images showing fluorescent bands were obtained using an excitation wavelength of 457 nm. All bands were visualized by CBB staining.
Fluorescent proteins, containing one or more equivalents of the covalently bound form of 1, produced as the result of this immobilization process were monitored by 2D-gel experiments. Figure 4b shows the fluorescent (Typhoon; for the fluorescence spots) and CBB (coomassie brilliant blue; for the protein spots) staining images of a 2D-gel used to visualize the proteins produced after incubation with 1. A distinct fluorescent spot was seen on the gel when visualized at around pH 5. This spot is retained in the merged pseudocolored Typhoon (green) and CBB (red) staining images. Moreover, several proteins covalently linked to probe 1 were isolated from the gel and analyzed by ESI-MS spectroscopy. The peptide sequences of ATP synthase subunit beta (56 kDa)35 and heat shock (60 kDa)36 mitochondrial proteins were clearly observed (Tables S1 and S2). However, in the case of untreated cells and those incubated with the reference compound 2, no fluorescence proteins were observable on the gel (Figure S12). In conjunction with the data presented in Figures 3 and 4, this control study leads us to conclude that probe 1 is selectively immobilized within the mitochondria via covalent attachment in accord with the design expectations (Figure 1a).
The fluorescence response of 1 to changes in pH in HeLa cells was tested using confocal microscopy (cf. Figure S13). For this experiment, the cells were labeled with 1. The intracellular pH was then set at values between 4 and 7 using various buffer solutions in the presence of known H+/K+ ionophores (nigericin and monensin). The fluorescence intensity of 1 gradually increases as the cellular pH is lowered from 7 to 4. These finding match what was seen when 1 was tested in solution (see Figure 2 and accompanying discussion). The off–on manner of the fluorescent response seen upon lowering the pH leads us to suggest that probe 1 can be used to image mitochondrial pH changes associated with pathogenic states in live cells.
As a predicate to testing the above suggestion, an effort was made to quantify the mitochondrial pH in HeLa cells using 1 in conjunction with MitoTracker Red (MTR). It is well-known that ratiometric comparisons of two separate emission bands facilitates accurate and quantitative measurements when using fluorescent chemosensors.37,38 To see if such an approach had merit in the present instance, several preliminary experiments were carried out. First, we tested the effect of pH on the fluorescence emission properties of MTR. The MTR fluorescence at 634 nm is invariant over the 5–8 pH range (Figure S14) However, upon subjecting the cells to laser irradiation 8 time in sequence an approximately ca. 13% decrease in the effective MTR fluorescence intensity was seen (as judged by confocal microscopy) (Figure S15). This effect is ascribed to photobleaching of the MTR dye in the HeLa cells. Such photobleaching was not seen in the case of 1. Upon excitation at 488 nm, confocal fluorescence images were obtained that revealed emission from both 1 and MTR that had its origin in both cases in the mitochondria of HeLa cells (Figure S16). This is taken as evidence of colocalization. On the other hand, when 1 was irradiated selectively by means of two-photon excitation at 750 nm, only a weak image ascribable to MTR was observed. We thus rule out FRET as an important deactivation mechanism (Figure S16). Taken in concert, these studies lead us to conclude that coincubating cells with both 1 and MTR will provide a reliable means of monitoring mitochondrial pH via ratiometric fluorescence studies, provided account is taken of the photobleaching that can occur in the case of MTR.
To establish a valid intracellular pH calibration profile, HeLa cells were coincubated with probe 1 and MTR. The cells were then fixed and exposed to buffer solutions at different pH. As shown in Figure 5a, the fluorescence intensity of 1 (first row, Igreen) in cells gradually increases with decreasing pH over the 8–5 pH range, whereas that for MTR (second row, Ired) remains essentially unchanged. The merged images (third row) serve to confirm the colocalization of 1 and MTR within the mitochondria. Moreover, pseudocolored images, reflecting the ratio of the green (Igreen) and red (Ired) emission intensities ascribed to 1 and MTR, respectively, help underscore the fact that the probe 1 gives rise to pH-dependent signals and does so with a linear response over the 4–8 pH range (Figure 5b).
Figure 5.
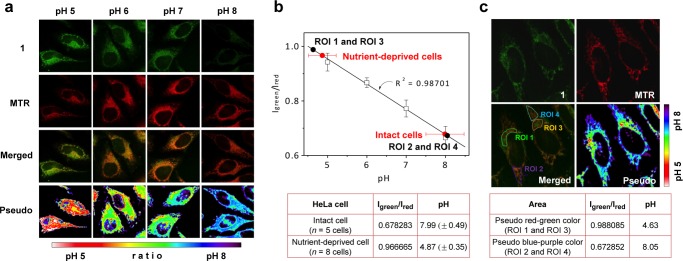
Mitochondrial pH determination in HeLa cells using probe 1 and MitoTracker Red. (a) Confocal microscopy images of 1 (5.0 μM) and MitoTracker Red (MTR) (0.1 μM) in fixed cells exposed to external media fixed at pH 5, 6, 7, and 8, respectively. (b) Intracellular pH calibration curve constructed by plotting Igreen/Ired vs pH. The dots are based on the average with the indicated standard error. The table provides the average pH values of the mitochondria in intact and nutrient-deprived cells. (c) Images of 1 and MTR in intact cells. Four regions of interest (ROI) are indicated in the merged image. The table lists the average pH values for the pseudo red–green color (ROI 1 and ROI 3) and the blue–purple color (ROI 2 and ROI 4) regions. The color strip indicates the pseudo color change observed upon varying the pH. All images were recorded using an excitation wavelength of 488 nm, and band-path emission filters at 500–550 nm and 680–750 nm.
The mitochondrial pH of intact HeLa cells were then measured based on the calibration curve produced from the fixed pH experiments described above (Figure 5b). Merged and pseudocolored images of probe 1 and MTR obtained from live cells are displayed in Figure 5c. On the basis of the ratio of fluorescence intensities corresponding to 1 and MTR, the average pH value of the mitochondria in HeLa cells was determined to be 7.99 ± 0.49 (n = 5 cells). This mitochondrial pH is similar to the earlier studies (Pozzan, pH = 8.05; Tsien, pH = 7.98; both in HeLa cells).7,8
In living cells, mitochondria are expected to be heterogeneous in terms of their pH values as the result of their functional heterogeneity.7,39 Since distinct mitochondrial subsets may vary in their sensitivity to pathogens, resistance to apoptosis, response to oxidative stress, susceptibility to reactive oxygen species (ROS), or changes in Ca2+ ion fluxes, an ability to recognize heterogeneous pH values would be beneficial.
The relatively large standard deviations seen in the initial studies discussed above led us to consider that pH heterogeneity could be monitored with our probe system. Toward this end, four regions of interest (ROI) were chosen in the merged cell images. Regions ROI 1 and ROI 3 were characterized by an enhanced green fluorescence ascribed to 1. In contrast, ROI 2 and ROI 4 displayed relatively low fluorescence intensities. On the basis of these intensity values, the average pH of ROI 1 and ROI 3 and of ROI 2 and ROI 4 were estimated to be 4.63 and 8.05, respectively (see Figure 5b and 5c). These findings support the contention that the present probe can be used to identify mitochondrial heterogeneity.
To test whether probe 1 could be used to identify mitochondrial damage associated with dysfunction and cell death, a starvation model was employed. Nutrient deprivation impairs mitochondria through metabolic inhibition. This leads to mitochondrial acidification, which in turn is correlated with an increase in mitophagy levels.18,40 HeLa cells were thus coincubated with probe 1 and MTR in a serum-free medium. Fluorescence intensity ratios were then acquired via confocal microscopy. Using the calibration curve shown in Figure 5b, the average mitochondria pH of HeLa cells observed upon nutrient deprivation was determined to be 4.87 ± 0.35 (n = 8 cells) (see also Figure S17). The observation of mitochondrial acidification under these conditions is fully consistent with previous reports in the literature,18−20 namely, that cells subjected to nutrient deprivation possess mitochondria characterized by lower pH than those present in intact cells.
The above results led us to propose that probe 1 could also have utility in the real-time monitoring of pH changes during mitophagy, a process induced inter alia by nutrient depravation as noted above. During mitophagy, the impaired mitochondria are entrapped in acidic autolysosomes. This results first in mitochondrial acidification followed by degradation.15,16,18,19 To test whether probe 1 could be used to monitor mitophagy, HeLa cells were treated with both 1 and LysoTracker Red (LTR) in a serum-free medium containing pepstatin A. Probe 1 and LTR were expected to allow for a visual monitoring of mitochondrial pH and acidic autolysosomes, respectively. Pepstatin A is a protease inhibitor and was used to delay mitochondrial degradation by proteases in the autolysosomes.
As can be seen from Figure 6a, the fluorescence intensity of 1 in nutrient-deprived cells is greater than in intact cells. In addition, the fluorescence of 1 predominantly overlaps with that of LTR in nutrient-deprived cells. In contrast, in intact cells instances of such overlap are rare.
Figure 6.

Real-time monitoring of mitochondrial pH changes and lysosome fusion in intact and nutrient-deprived HeLa cells. (a) Confocal microscopy images of HeLa cells treated with probe 1 (5.0 μM) and LysoTracker Red (LTR) (1.0 μM) in growth medium (for intact cells) or in serum-free KRH (Krebs-Ringer-HEPES) buffer containing pepstatin A (7.5 μM) (for nutrient-deprived cells). Time course images of intact (b) and nutrient-deprived cells (c). The images were recorded at time points consisting of t = 0, 90, 180, 270, and 360 s. All images were recorded using an excitation wavelength of 488 nm and band-path emission filters at 510–550 nm and 570–660 nm.
We also monitored the changes in the fluorescent images of 1 and LTR at 15 s intervals over a 435 s time period. The results of this monitoring appear in Figure 6b and 6c and in the Supporting Information (cf. Supplementary Movie 1 and Figure S18 for intact cells; cf. Supplementary Movie 2 and Figures S19 and S20 for nutrient-deprived cells). Figure 6c shows fluorescent images of nutrient-deprived cells recorded at 90, 180, 270, and 360 s, respectively. Enlarged images are shown in Figure S20. The fluorescence intensity ascribed to 1 gradually increases while overlapping with that of LTR. Pearson’s correlation coefficient increases from 0.85 to 0.91. However, in the case of intact cells in growth medium, these time-dependent changes are not observed (Figure 6b). Pearson’s correlation also shows a little change (i.e., going from 0.87 to 0.84). Therefore, we conclude that probe 1 allows for the quantitative measurement of pH changes in mitochondria, as well as the real-time monitoring of mitophagy in living cells. The ability to study mitochondrial pH dynamics leads us to suggest that in due course probe 1 or its analogues could find use as potential diagnostic tools for mitochondria-related diseases.
Conclusions
Mitochondrial pH is a potential indicator of both normal physiology and cellular pathology. A significant current bottleneck in exploiting mitochondrial pH as a marker of cell status is an absence of probes that allow for the direct and reliable measurement of mitochondrial pH measurement in whole cells. In this study, we have successfully developed a chemical strategy that permits the selective and effective determination of mitochondrial pH. We have shown that the system in question, probe 1, permits the real time monitoring of pH changes associated with the mitochondrial acidification and fusion that occurs during mitophagy resulting from nutrient deprivation. The success of our probe is ascribed to the fact that it contains a piperazine-based naphthalimide as a PET driven fluorophore, a triphenylphosphonium group for mitochondria targeting, and a reactive benzyl chloride subunit that induces mitochondrial fixation. We therefore envision that in due course this strategy will contribute to improvements in diagnostics and testing wherein mitochondrial pH dynamics are monitored as a means of distinguishing between physiological and pathological states or screening potential new mitochondria-targeting drugs.
Experimental Section
Synthetic Materials and Methods
All reagents, including metal ions, thiols, H2O2, and other chemicals for synthesis, buffer solution preparation, and cell imaging, were purchased from Aldrich or TCI and used as received. All solvents were HPLC reagent grade, and deionized water was used throughout the analytical experiments. Silica gel 60 (Sorbent, 40–63 mm) was used for column chromatography. Analytical thin layer chromatography was performed using Silicycle 60 F254 silica gel (precoated sheets, 0.25 mm thick). 1H and 13C NMR spectra were collected in CDCl3 (Cambridge Isotope Laboratories, Cambridge, MA) on Varian 400 MHz spectrometers.
UV–Vis Absorption and Fluorescence Spectroscopy
Stock solutions of 1, 2, 11, and 13 were prepared in DMSO. The biologically relevant analytes, including chloride salts of metal ions (Na+, K+, Ca2+, Zn2+, Mg2+, Mn2+, Cu2+, Fe2+, Fe3+), thiols (GSH, Cys, Hcy), and H2O2, were prepared in triple-distilled water. pH buffer solutions of differing pH were prepared using 33 mM of potassium hydrogen phthalate (for pH 2–5), potassium dihydrogen phosphate (for pH 6–8), sodium tetraborate (for pH 9–10), and sodium bicarbonate (for pH 11). The actual pH was set by adding aliquots of 0.1 M NaOH or 0.1 M HCl to the initial buffer solutions. Absorption spectra were recorded on a Varian-5000 UV–vis–NIR spectrophotometer, and fluorescence spectra were recorded using a FL3–11T spectrofluorometer (Nanolog) equipped with a xenon lamp (FL 1039). Samples for absorption and emission measurements were contained in quartz cuvettes (3 mL volume). Excitation was effected at 407 (for 2), 450 (for 11), and 434 nm (for 13), with the excitation and emission slit widths both set at 5 nm.
Cell Culture and Imaging
A human cervical cancer cell line (HeLa) was cultured in Dulbecco’s modified Eagle’s medium (DMEM) supplemented with 10% FBS (WelGene), penicillin (100 units/mL), and streptomycin (100 μg/mL). Two days before imaging, the cells were passed and plated on glass-bottomed dishes (MatTek). All the cells were maintained at 37 °C in a humidified atmosphere consisting of 5/95 (v/v) CO2/air. For labeling, the growth medium was removed and replaced with DMEM without FBS. The cells were treated and incubated with 5.0 μM of 1 at 37 °C under 5% CO2 for the specific incubation time associated with a given experiment. The cells were washed three times with phosphate buffered saline (PBS, Gibco). Cell images were then recorded using a confocal microscope (Leica, model TCS SP2). Other information is available in the figure captions.
Acknowledgments
This work was supported by National Research Foundation (NRF) funded by the Ministry of Science, ICT & Future Planning in Korea (CRI Project No. 2009-0081566, J.S.K.), Basic Science Research Programs (No. 2012R1A6A3A03037981, M.H.L.), (2012R1A1A2006259 C.K.), Bio and Medical Technology Development Program (No. 2012M3A9B6055305, K.P.K.) and the U.S. National Institutes of Health (CA 68682, J.L.S.), and the Robert A. Welch Foundation (F-1018, J.L.S.).
Supporting Information Available
Synthetic and spectroscopic methods, additional spectra (UV–vis absorption, fluorescence, NMR, and ESI-MS) and imaging data and full reference information. This material is available free of charge via the Internet at http://pubs.acs.org.
The authors declare no competing financial interest.
Funding Statement
National Institutes of Health, United States
Supplementary Material
References
- Ernster L.; Schatz G. J. Cell Biol. 1981, 91, 227–255. [DOI] [PMC free article] [PubMed] [Google Scholar]
- Voet D.; Judith G. V.; Charlotte W. P.. Fundamentals of Biochemistry, 2nd ed.; John Wiley & Sons, Inc.: New York, 2006. [Google Scholar]
- Li X.; Fang P.; Mai J.; Choi E. T.; Wang H.; Yang X.-F. J. Hematol. Oncol. 2013, 6, 19. [DOI] [PMC free article] [PubMed] [Google Scholar]
- Hajnoczky G.; Csordás G.; Yi M. Cell Calcium 2002, 32, 363–377. [DOI] [PubMed] [Google Scholar]
- Hajnoczky G.; Csordas G.; Das S.; Garcia-Perez C.; Saotome M.; Sinha Roy S.; Yi M. Cell Calcium 2006, 40, 553–560. [DOI] [PMC free article] [PubMed] [Google Scholar]
- Green D. R. Cell 1998, 94, 695–698. [DOI] [PubMed] [Google Scholar]
- Abad M. F. C.; Di Benedetto G.; Magalhaes P. J.; Filippin L.; Pozzan T. J. Biol. Chem. 2004, 279, 11521–11529. [DOI] [PubMed] [Google Scholar]
- Llopis J.; McCaffery J. M.; Miyawaki A.; Farquhar M. G.; Tsien R. Y. Proc. Natl. Acad. Sci. U. S. A. 1998, 95, 6803–6808. [DOI] [PMC free article] [PubMed] [Google Scholar]
- Nomura K.; Imai H.; Koumura T.; Arai M.; Nakagawa Y. J. Biol. Chem. 1999, 274, 29294–29302. [DOI] [PubMed] [Google Scholar]
- Crompton M.; Heid I. Eur. J. Biochem. 1978, 91, 599–608. [DOI] [PubMed] [Google Scholar]
- Garlid K. D.; Sun X.; Paucek P.; Woldegiorgis G. Methods Enzymol. 1995, 260, 331–348. [DOI] [PubMed] [Google Scholar]
- McCormack J. G.; Halestrap A. P.; Denton R. M. Physiol. Rev. 1990, 70, 391–425. [DOI] [PubMed] [Google Scholar]
- Moreno-Sanchez R. Biochim. Biophys. Acta 1983, 724, 278–285. [DOI] [PubMed] [Google Scholar]
- Yamada E. W.; Huzel N. J. Biochemistry 1989, 28, 9714–9718. [DOI] [PubMed] [Google Scholar]
- Gursahani H. I.; Schaefer S. Am. J. Physiol.: Heart Circ. Physiol. 2004, 287, H2659–H2665. [DOI] [PubMed] [Google Scholar]
- Balut C.; vande Ven M.; Despa S.; Lambrichts I.; Ameloot M.; Steels P.; Smets I. Kidney Int. 2008, 73, 226–232. [DOI] [PubMed] [Google Scholar]
- Kristian T.; Bernardi P.; Siesjo B. K. J. Neurotrauma 2001, 18, 1059–1074. [DOI] [PubMed] [Google Scholar]
- Kim I.; Rodriguez-Enriquez S.; Lemasters J. J. Arch. Biochem. Biophys. 2007, 462, 245–253. [DOI] [PMC free article] [PubMed] [Google Scholar]
- Youle R. J.; Narendra D. P. Mol. Cell. Biol. 2011, 12, 9–14. [DOI] [PMC free article] [PubMed] [Google Scholar]
- Kubli D. A.; Gustafsson A. B. Circ. Res. 2012, 111, 1208–1221. [DOI] [PMC free article] [PubMed] [Google Scholar]
- Ding W.-X.; Yin X.-M. Biol. Chem. 2012, 393, 547–564. [DOI] [PMC free article] [PubMed] [Google Scholar]
- Partin J. C.; Schubert W. K.; Partin J. S. N. Engl. J. Med. 1971, 285, 1339–1343. [DOI] [PubMed] [Google Scholar]
- Han J.; Burgess K. Chem. Rev. 2010, 110, 2709–2728. [DOI] [PubMed] [Google Scholar]
- Jung D. W.; Davis M. H.; Brierley G. P. Anal. Biochem. 1989, 178, 348–354. [DOI] [PubMed] [Google Scholar]
- Chacon E.; Reece J. M.; Nieminen A.-L.; Zahrebelski G.; Herman B.; Lemasters J. J. Biophys. J. 1994, 66, 942–952. [DOI] [PMC free article] [PubMed] [Google Scholar]
- Porcelli A. M.; Ghelli A.; Zanna C.; Pinton P.; Rizzuto R.; Rugolo M. Biochem. Biophys. Res. Commun. 2005, 326, 799–804. [DOI] [PubMed] [Google Scholar]
- a Patterson G. H.; Knobel S. M.; Sharif W. D.; Kain S. R.; Piston D. W. Biophys. J. 1997, 73, 2782–2790. [DOI] [PMC free article] [PubMed] [Google Scholar]; b Zimmer M. Chem. Rev. 2002, 102, 759–781. [DOI] [PubMed] [Google Scholar]
- a Duke R. M.; Veale E. B.; Pfeffer F. M.; Kruger P. E.; Gunnlaugsson T. Chem. Soc. Rev. 2010, 39, 3936–3953. [DOI] [PubMed] [Google Scholar]; b Banerjee S.; Veale E. B.; Phelan C. M.; Murphy S. A.; Tocci G. M.; Gillespie L. J.; Frimannsson D. O.; Kelly J. M.; Gunnlaugsson T. Chem. Soc. Rev. 2013, 42, 1601–1618. [DOI] [PubMed] [Google Scholar]; c Lee M. H.; Jeon H. M.; Han J. H.; Park N.; Kang C.; Sessler J. L.; Kim J. S. J. Am. Chem. Soc. 2014, 136, 8430–8437. [DOI] [PMC free article] [PubMed] [Google Scholar]; d Lee M. H.; Han J. H.; Kwon P.-S.; Bhuniya S.; Kim J. Y.; Sessler J. L.; Kang C.; Kim J. S. J. Am. Chem. Soc. 2012, 134, 1316–1322. [DOI] [PubMed] [Google Scholar]
- Smith R. A. J.; Porteous C. M.; Gane A. M.; Murphy M. P. Proc. Natl. Acad. Sci. U. S. A. 2003, 100, 5407–5412. [DOI] [PMC free article] [PubMed] [Google Scholar]
- Presley A. D.; Fuller K. M.; Arriaga E. A. J. Chromatogr. B 2003, 793, 141–150. [DOI] [PubMed] [Google Scholar]
- Zheng S. P. L.; Lynch P. L. M.; Rice T. E.; Moody T. S.; Gunaratne H. Q. N.; de Silva A. P. Photochem. Photobiol. Sci. 2012, 11, 1675–1681. [DOI] [PubMed] [Google Scholar]
- de Silva A. P.; Moody T. S.; Wright G. D. Analyst 2009, 134, 2385–2393. [DOI] [PubMed] [Google Scholar]
- Lee M. H.; Han J. H.; Lee J.-H.; Choi H. G.; Kang C.; Kim J. S. J. Am. Chem. Soc. 2012, 134, 17314–17319. [DOI] [PubMed] [Google Scholar]
- Heytler P. G. Biochemistry 1963, 2, 357–361. [DOI] [PubMed] [Google Scholar]
- del Riego G.; Casano L. M.; Martín M.; Sabater B. Photosynth. Res. 2006, 89, 11–18. [DOI] [PubMed] [Google Scholar]
- Hansen J. J.; Bross P.; Westergaard M.; Nielsen M. N.; Eiberg H.; Borglum A. D.; Mogensen J.; Kristiansen K.; Bolund L.; Gregersen N. Hum. Genet. 2003, 112, 71–77. [DOI] [PubMed] [Google Scholar]
- Bright G. R.; Fisher G. W.; Rogowska J.; Taylor D. L. Methods Cell Biol. 1989, 30, 157–192. [DOI] [PubMed] [Google Scholar]
- Lee M. H.; Han J. H.; Lee J. H.; Park N.; Kumar R.; Kang C.; Kim J. S. Angew. Chem., Int. Ed. 2013, 52, 6206–6209. [DOI] [PubMed] [Google Scholar]
- Kuznetsov A. V.; Margreiter R. Int. J. Mol. Sci. 2009, 10, 1911–1929. [DOI] [PMC free article] [PubMed] [Google Scholar]
- Rodriguez-Enriquez S.; Kim I.; Currin R. T.; Lemasters J. J. Autophagy 2006, 2, 39–46. [DOI] [PMC free article] [PubMed] [Google Scholar]
Associated Data
This section collects any data citations, data availability statements, or supplementary materials included in this article.