

Abstract
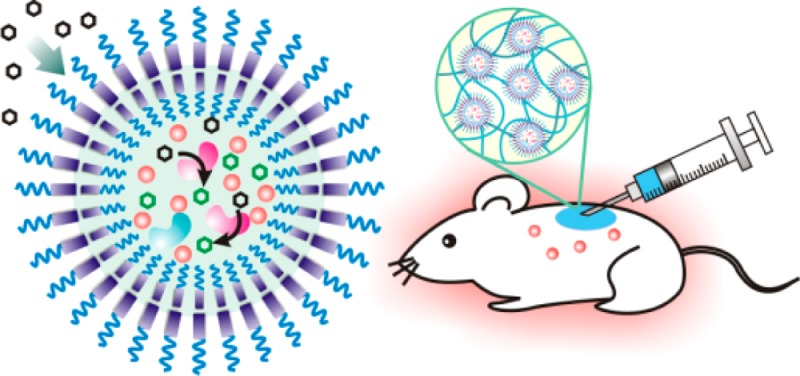
A new glucose-responsive formulation for self-regulated insulin delivery was constructed by packing insulin, glucose-specific enzymes into pH-sensitive polymersome-based nanovesicles assembled by a diblock copolymer. Glucose can passively transport across the bilayer membrane of the nanovesicle and be oxidized into gluconic acid by glucose oxidase, thereby causing a decrease in local pH. The acidic microenvironment causes the hydrolysis of the pH sensitive nanovesicle that in turn triggers the release of insulin in a glucose responsive fashion. In vitro studies validated that the release of insulin from nanovesicle was effectively correlated with the external glucose concentration. In vivo experiments, in which diabetic mice were subcutaneously administered with the nanovesicles, demonstrate that a single injection of the developed nanovesicle facilitated stabilization of the blood glucose levels in the normoglycemic state (<200 mg/dL) for up to 5 days.
Introduction
Diabetes mellitus is a type of common metabolic disease in which glucose is accumulated in the blood, caused either by pancreas’s failure to produce insulin (Type 1) or by insulin resistance from the body tissue (Type 2).1 As of 2012, diabetes affected an estimated 371 million people, which makes up around 4.9% of the global population.2,3 Long-term exposure to the high blood glucose (BG) level may cause many complications, including cardiovascular disease, retinopathy, chronic kidney disease, and even cancer.4−6 The traditional medical care for the Type 1 and advanced Type 2 diabetics requires continuous glucose monitoring and self-administration of insulin to maintain the normoglycemia. However, self-administration of insulin always associates with the risk of hypoglycemia that might cause unconsciousness, brain damage and death.7 Additionally, it is difficult to achieve a tight control of BG levels.
A practical approach to reduce the risk described above would create a closed-loop system that is able to mimic pancreatic function and automatically “secrete” insulin in response to the BG levels. One straightforward strategy is a sensor-augmented insulin pump that combines a continuous BG monitoring system with an insulin reservoir.8 This computer-aided device is designed to infuse insulin based on the feedback of BG level. However, challenges, such as guaranteeing accurate glucose feedback and preventing failures in insulin infusion, still persist today. In addition to electronic devices, chemically controlled closed-loop delivery platforms have also been explored.9,10 Typically, insulin is embedded in a matrix consisting of glucose-responsive elements, including enzymes (glucose oxidase/catalase (GOx/CAT), phenylboronic acid (PBA), or glucose binding proteins).11−25 The matrix can typically undergo structural fluctuations (shrink or swell) regulated by glucose concentration changes, subsequently leading to a glucose-stimulated insulin release. Despite these, the majority of existing synthetic closed-loop systems has been limited to in vitro studies, with relatively few showing applicability in vivo. Challenges remain in order to demonstrate a method which would combine (1) fast response; (2) ease of administration, possibly by simple long-lasting injections; and (3) biocompatibility without long-term side effects.26
We describe here a new glucose-mediated insulin delivery system using biomimetic polymersome-based nanovesicle. Polymersome is a self-assembled polymeric capsule, in which an aqueous core is surrounded by a well-organized amphiphilic polymeric bilayer.27−30 Composed by high molecular weight polymer, polymerosme has robust mechanical stability which can prevent premature loss of its cargo.31 The chemical feasibility in block copolymer synthesis also facilitates the possibility to tune the physical properties of polymersome.32 The boronic acid containing diblock copolymer has been well synthesized and assembled into a polymersome for sugar-responsive insulin delivery.22 This PBA-based formulation showed moderate responsiveness at a relatively high glucose concentration, which could be limited for in vivo studies. We have previously reported that GOx/CAT based enzymatic system exhibits promising improvement of diabetic conditions in vivo.3,15,16 Gordigo and co-workers also reported that the GOx/CAT associated membrane-based device with the capability of regulating the BG levels in vivo.11 However, a well-defined enzyme-based polymersome vesicle for glucose-responsive insulin delivery remains elusive.
As depicted in Figure 1A, assembled by the mildly acid-sensitive diblock copolymer consisting of poly(ethylene glycol) (PEG) and Ketal-modified polyserine (designated PEG-poly(Ser-Ketal); Figure 1B), the polymersome has a nanoscaled vesicle structure. Cargoes, including recombinant human insulin, GOx, and CAT, are faithfully encapsulated in the core with negligible release through the closely packed bilayer membrane. However, such a robust membrane can allow glucose to passively transport inside due to the small size and neutral property of glucose.33 Once its local concentration increases, glucose diffuses across the membrane and interacts with GOx in the core, which leads to the catalytic conversion of glucose to gluconic acid, thereby yielding the decrease of local pH value. Moreover, CAT assists GOx’s catalysis by breaking down an undesirable byproduct hydrogen peroxide (H2O2) and providing oxygen (O2) for further promoting GOx’s catalysis (Figure S1).15 As a result, the pendant acid-labile ketals on the polyserine segment of PEG-poly(Ser-Ketal) sheds upon acidic hydrolysis, which renders the resulting PEG-polyserine water-soluble. Accompanied by this structural change, the membrane dissociates, followed by the release of core-encapsulated insulin (Figure 1A). For the in vivo application, these vesicles can be integrated with a thermoresponsive and injectable hydrogel-based matrix for the subcutaneous administration. The final depot provides a porous but stable three-dimensional (3-D) scaffold for the long-term insulin delivery in a glucose-mediated fashion.
Figure 1.
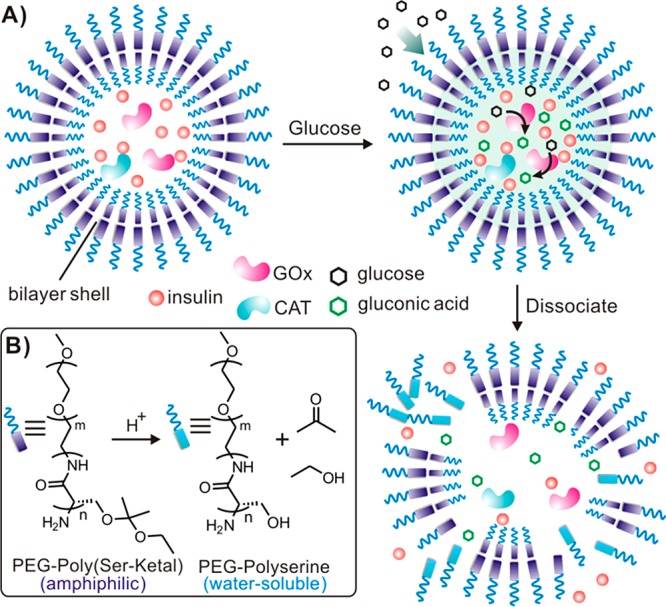
Schematic of the enzyme-based glucose-responsive nanovesicle. (A) GOx converts glucose into gluconic acid and acidifies the aqueous core of polymersome nanovesicle, leading to hydrolysis of the polymeric bilayer shell and subsequent dissociation of vesicles. (B) The chemical structure of the pH-sensitive diblock copolymer PEG-poly(Ser-Ketal), which can be hydrolyzed into water-soluble PEG-polyserine and acetone/ethanol in an acidic environment.
Experimental Section
Materials
All chemicals were obtained from commercial sources and used without further purification. Glucose oxidase (GOx) and bovine catalase (CAT) were purchased from Sigma-Aldrich. Poly(ethylene glycol) amine (PEG2000-NH2) was ordered from Laysan Bio, Inc. (U.S.A.). 2-Ethoxy-1-propene was obtained from Synthonix Inc. Recombinant human insulin (Zn salt, 27.5 IU/mg) was purchased from Life Technologies (U.S.A.). All the organic solvents for synthesis and analysis were ordered from Fisher Scientific Inc. and used as received.
1H NMR spectra were assayed on a Varian Gem2300 (300 MHz) spectrometer. The spectra were recorded by chemical shift (ppm) and referenced via the corresponding deuterated solvent. Molecular weight (Mw) of Oregon Green 488 labeled insulin was analyzed on the AB Sciex 5800 MALDI-TOF/TOF MS using the sinapic acid as matrix. As for transmission electron microscopy (TEM), the copper TEM grid (Ted Pella Inc.) was plasma glow-discharged for 20 s to create a hydrophilic surface on the carbon surface. A nanovesicle sample (20 μL) was absorbed onto the freshly plasma-discharged carbon membrane for 30 s and then blotted with filter paper to remove excess solution. The grid was examined with JEOL 2000FX at 100 kV. Gel permeation chromatography (GPC) was performed on Waters 2695 Alliance separation model equipped with RI 2414 (410) detector. The separation of polymers was achieved on Styrogel HR 4E column (Waters, 5 μm, 7.8 mm × 300 mm) at 50 °C using DMF containing 0.1 M LiBr as mobile phase. The molecular weight of polymers was calibrated against standard PEG ranging from 112k–0.4k Dalton. The particle size of polymersome vesicle was measured on the Malvern Zetasizer Nano ZS by dynamic light scattering (DLS).
Synthesis of O-Acetyl-l-Serine N-Carboxyanhydride (2)
The monomer AcO-l-serine-NCA (2) is synthesized from AcO-l-serine (1) according to reports.34,35 Briefly, O-acetyl-l-serine (5 g, 34 mmol) was suspended in 200 mL of dry THF, followed by adding triphosgene (3.92 g, 17 mmol). The reaction mixture was stirred at 48 °C for 2 h. The suspension gradually turned clear, which indicated that AcO-l-serine was consumed and reaction completed. After cooled to room temperature, the reaction mixture was concentrated under vacuum to give crude compound 2. The crude product was purified by silica gel chromatography (the silica gel was dried at 140 °C under vacuum for 8 h before use) using petroleum ether/EtOAc (v/v, 2/1 then 1/1) as eluent. Light yellow oil was obtained with yield of 83%. 1H NMR (300 MHz, CDCl3): δ 7.14 (s, 1H), 4.67 (s, 1H), 4.60 (d, J = 12 Hz, 1H), 4.32 (d, J = 12 Hz, 1H), 2.11 (s, 3H).
Synthesis of PEG-Poly(AcO-Ser) (3)
The diblock copolymer was synthesized by amine-initiated ring open polymerization.36,37 PEG2000-NH2 (0.925 g, 0.46 mmol) was added into 80 mL of dry DMSO. The mixture was stirred at room temperature until it was completely dissolved. The monomer (2) solution (4.8 g in 10 mL of dry DMSO) was then quickly added into the reaction. The polymerization was carried out under vacuum at room temperature for 48 h (vacuum can remove byproduct CO2 from viscous reaction mixture and facilitate polymerization). The viscosity of the reaction mixture gradually increased over reaction time. The product 3 was precipitated from the reaction by 400 mL of diethyl ether. The crude polymer 3 was dissolved in 100 mL of water and directly used for next-step reaction. For NMR characterization, a small portion of reaction mixture was subjected to dialysis (Spectra/Por, molecular weight cutoff: 1000 Da) against water for 24 h with frequent water change. The resulting suspension was lyophilized, dried and characterized by NMR. As for PEG-Poly(AcO-Serine)34, 1H NMR (300 MHz, DMSO-d6): δ 8.33 (s, 13H), 4.62 (s, 16H), 4.13 (s, 34H), 3.50 (s, 180H), 1.98 (s, 54H).
PEG-Polyserine (4)
Polymer 3 (crude product from last step) was suspended in 100 mL of distilled water. The viscous suspension was stirred at room temperature and blowed with nitrogen gas for 30 min to remove the trace diethyl ether (the diethyl ether can reduce the aqueous solubility of polymer 4 and decrease the hydrolysis rate). Lithium hydroxide (1.3 g, 31 mmol) was added into the reaction and the reaction was stirred at room temperature for 1.5 h. When the reaction mixture completely turned clear, 2 N HCl solution was added to neutralize the reaction solution. The reaction mixture was then transferred to a dialysis tubing (Spectra Lab, MWCO: 1000 Da) and dialysis against water for 40 h. The resulting solution was lyophilized and dried in the CaCl2 desiccators to give pure polymer 4 (1.74 g, two-step yield: 36%). Mw, 4980 g/mol; Mn, 4057; Mw/Mn, 1.22. 1H NMR (300 MHz, D2O): δ 4.50 (br s, 13H), 3.88 (br s, 30H), 3.67 (s, 180H).
Synthesis of PEG-Poly(Ser-ketal) (5)
In the 50 mL of flask, polymer 4 (400 mg), and pyridinium p-toluenesulfonate (PPTS, 50 mg, mmol) was added into 20 mL of dry chloroform. The suspension was sonicated in ultrasonic tank until the fine polymer powder is uniformly dispersed. 2-Ethoxy-1-propene (1.2 mL) was added into the reaction. The suspension gradually turned clear in 3 h (if it did not turn clear, resonicate the reaction on water tank for couple minutes). After stirred at room temperature for another 13 h, the reaction was stopped by adding 300 μL of triethylamine. The solvent was removed by the rotary evaporator. The residue was mixed with 50 mL of diethyl ether. The white precipitate was collected by centrifuge and washed with diethyl ether and water, respectively. The resulting polymer was dried in CaCl2 desiccators under vacuum for 3 days before use (yield: 60–80%). To prepare sample for 1H NMR analysis, the residue from reaction was mixed with 10 mL of water to form the polymersome which was then dialysis against water to remove impurities. The purified polymer was lyophilized and dried in CaCl2 desiccators overnight before 1H NMR analysis. 1H NMR (300 MHz, DMSO-d6): δ 8.12 (br s, 8H), 4.55 (br s, 5H), 3.5 (s, 180H), 1.23 (br s, 98H), 1.03 (br, 64H).
1H NMR Determination of Hydroxyl Coverage
A total of 7 mg of polymer 5 were placed in 1.5 mL of microcentrifuge tube and 0.5 mL of deuterated water (D2O) was added. The polymer was suspended into D2O by pipet up and down several times and then transferred into a NMR tube. DCl solution (37% in D2O, 100 or 50 μL) was added into the tube. After capping and sealing the tube with parafilm, the tube was vortexed for 1 min and kept at room temperature for 10 min before 1H NMR analysis. Hydroxyl coverage was determined by comparing the integration of acetone peaks, ethanol peaks, and PEG-polyserine peaks. All the chemical shifts were slightly moved to the upfield due to DCl (higher concentration, move further). The integrations were normalized to the number of protons on each molecule.
Preparation of Polymersome Nanovesicle
The polymersome vesicle was prepared by the solvent evaporation method modified from Marsden et al’s report.3 Briefly, 50 mg of PEG-poly(Ser-ketal) (dry in desiccators is essential for nanovesicle preparation and insulin encapsulation) was dissolved in 1.5 mL of THF (it takes couple hours). A total of 3 mL of aqueous insulin solution (60 mg/mL) containing GOx/CAT (6 mg/1.5 mg), were slowly added into the polymer solution during vortex. The mixture was then transferred to the flask and stirred at 750 rpm in a chemical fume, during which the nitrogen gas slowly flowed through the flask to accelerate THF evaporation. After the removal of THF (it takes around 5 min), the polymersome suspension in the flask was transferred to microcentrifuge tubes and centrifuged for 3 min at 12000g. The pellet was collected and washed several time with PBS buffer (NaCl, 137 mM; KCl, 2.7 mM; Na2HPO4, 10 mM; KH2PO4, 2 mM; pH 7.4). The resulting clean nanovesicle pellet was stored at 4 °C for later study. The insulin loading capacity of vesicles is determined as 2.5 wt %.
Turbidity Test
The turbidity test was performed according to the report.22 Briefly, nanovesicle solution (50 mM phosphate buffer, pH = 7.4, 5.0 or 3.0) was placed in the cuvettes. After capping, the cuvettes were kept at 37 °C and the absorbance at 580 nm was measured at the indicated time points. The optical transmittance (turbidity) was calculated using the following equation: Tλ = Iout/Iin = 10–A, Tλ is the transmittance, I is the transmitted light intensity, and A is the absorbance.
pH Titration of Nanovesicle Solution at Different Glucose Concentration
The insulin and enzymes encapsulated nanovesicles were suspended in PBS buffer (NaCl, 137 mM; KCl, 2.7 mM; Na2HPO4, 10 mM; KH2PO4, 2 mM; pH 7.4) at the concentration of 50 mg/mL. Glucose was added into the vesicle suspensions to reach the final concentrations of 0, 100, and 400 mg/dL, respectively. The nanovesicle solution was incubated at 37 °C for indicated time with gentle shaking. The pH of the nanovesicle suspension was monitored every hour using pH meter (Fisher Scientific, AB15).
In Vitro Release of Insulin from Nanovesicles
Nanovesicle was mixed with 1 mL of PBS solution with different glucose concentrations (0, 100, or 400 mg/dL). The mixture was incubated at 37 °C under gently stirring. At indicated time points, 30 μL of the nanovesicle mixture was taken out and centrifuged at 12000g for 10 min. A total of 10 μL of the supernatant was collected for analysis. The remaining mixture was reconstituted with 10 μL of fresh solution and returned into the incubator to maintain a constant volume. The insulin concentration was measured using Fluoraldehyde (OPA) Reagent Solution (Pierce, Rockford, IL). Excitation/emission wavelengths were set at 360/460 nm. The concentration was calibrated with an insulin standard curve. As of the pulsatile release study, nanovesicle was first incubated in 400 mg/dL glucose solution for 2 h. The nanovesicle was then spun down (12000g for 30 s) and washed once with PBS. The pellet was suspended in 100 mg/dL glucose solution and incubated at 37 °C for another 2 h. The cycles were repeated several times. The released insulin was measured using OPA Reagent Solution, as described above.
In Vivo Studies Using STZ-Induced Diabetic Mice
The in vivo efficacy of insulin-loaded nanovesicle was evaluated on STZ-induced adult diabetic mice (male C57B6, Jackson Lab, U.S.A.). The animal study protocol was approved by the Institutional Animal Care and Use Committee at North Carolina State University. The blood glucose (BG) level of mice was monitored using the Clarity GL2Plus glucose meter (Clarity Diagnostics, Boca Raton, Florida) 2 days before administration. Mice with stable hyperglycemic state were divided into three groups (seven mice per group) and subcutaneously administrated with PBS solution, vesicle with insulin (VS(I)) and vesicle with enzymes and insulin (VS(E+I)), respectively. In order to make it injectable, nanovesicle was suspended into 30% PF127 solution and subcutaneously injected into the dorsum of STZ-induced diabetic mice to form a thermogel. A total of 250 μL of vesicle/PF127 mixture (v/v, 1/1) was subcutaneously injected into the dorsum of mice with a dose of 50 mg/kg after anesthesia with isoflurane. The BG level of each mouse was continuously monitored until the stable hyperglycemia returned. To confirm the bioactivity of released insulin, insulin solution (0.1 mg of native insulin or insulin released from nanovesicle at 400 mg/dL glucose for 6 h) was subcutaneously injected into the dorsum of STZ-induced diabetes mice. The BG level was monitored using glucose meter every hour until the stable hyperglycemia returned. In order to monitor the plasma insulin level in vivo, 25 μL of blood was collected from the tail vein of mice every other day. The plasma was isolated and stored at −20 °C until assay. The plasma insulin concentration was measured using Human Insulin ELISA kit according to the manufacturer’s protocol (Calbiotech, U.S.A.).
Glucose Tolerance Test
In order to confirm the effective insulin secretion from nanovesicle in response to high glucose challenge, glucose tolerance test was performed at 3 days post injection of vesicle containing insulin and enzyme (VS(E+I)). Briefly, glucose solution in PBS was intraperitoneally injected into all mice at a dose of 1.5 g/kg. The BG level was closely monitored for 120 min after injection. Glucose tolerance test on healthy mice was used as control.
Cytotoxicity Study
The cytotoxicity of bare nanovesicle and its corresponding degradation products (PEG-polyserine, acetone, and ethanol) was examined on HeLa cells by MTT assay. Briefly, HeLa cells were seeded in 96-well plate at a density of 7000 cells per well. After 12 h, series dilutions of compounds (nanovesicle, PEG-polyserine, acetone, and ethanol) ranging from 1.2 to 0.1 mg/mL were added into wells. After 24 h incubation, thiazolyl blue solution (5 mg/mL, Sigma-Aldrich) was added into wells (final concentration: 0.5 mg/mL) and incubated with cells for 2 h. After removing the culture media, the purple formazan crystal was dissolved in 200 μL of DMSO plus 25 μL of Sorenson buffer as reported.38,39 The absorbance at 570 nm, which is directly proportional to the viable cell number, was measured on the Infinite 200 PRO multimode plate reader (Tecan Group Ltd., Switzerland).
Biocompatibility Evaluation
To evaluate the biocompatibility of nanovesicle, mice were euthanized via CO2 asphyxiation, and the injected materials and surrounding tissues were excised. The tissues were then fixed in 10% formalin, embedded in paraffin, cut into 5 μm sections, and stained using hematoxylin and eosin (H&E) for histological analysis.
Statistical Analysis
Student’s t-test or ANOVA were utilized to determine statistical significance between different groups. A p value <0.05 was considered to be statistically significant.
Results and Discussion
Synthesis and Characterization of the Ketal-Containing Diblock Copolymer
The ketal-containing diblock copolymer was obtained via the amine-initiated ring-open polymerization (ROP) in five steps with a moderate yield (Figure 2A). The hydroxyl groups of the serine residue were first protected by acetyl ester to prevent hydroxyl-mediated ring-opening of N-carboxy-α-amino acid anhydrides (NCA), followed by switching to ketal via an acid-catalyzed reaction with ethoxypropene. We synthesized a series of diblock copolymer PEG-poly(AcO-Ser)n in DMSO by ROP. As expected, under a standard reaction condition, the Poly(AcO-Ser) block showed a gradual growth over changes of the monomer/initiator ratio (M/I ratio), indicating the controllability of the polymerization (Figure S2). PEG-poly(AcO-Ser)34, obtained from M/I = 60/1 (the low degree of polymerization is due to the low activity of amine initiator), was selected for the further study due to its optimal hydrophobic/hydrophilic block ratio for achieving a high-quality of vesicle assembly.31 Hydroxyl groups of the serine residue were then deprotected to obtain PEG-polyserine34 (Mw= 4,980 g/mol; Mw/Mn = 1.22; Figure S3) and then conjugated with ketal groups, which are hydrophobic and acid-sensitive. The conversion of hydroxyl to ketal groups through reaction with ethoxypropene was gradually proceeded over the course of reaction time as determined by 1H NMR (Figure 2B). The maximal conversion was achieved at the reaction time of over 16 h where the hydoxyl coverage was determined as 84%. Instead of the cyclic acetal,40 the acyclic acetals dominated the ketal population of PEG-polyserine during the whole reaction course, as evidenced by approximately 1:1 ratio of acetone/ethanol generated from the deuterated hydrogen chloride (DCl)-induced ketal hydrolysis at all the reaction time points (Figure S4).
Figure 2.
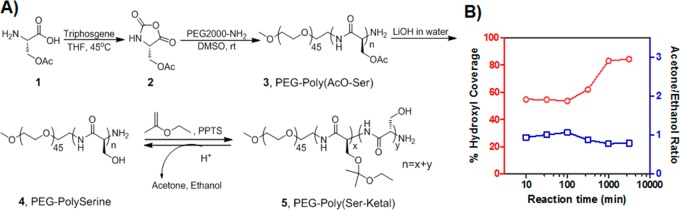
Synthesis of the novel acid-labile diblock copolymer for nanovesicle assembly. (A) The synthetic route of ketal-containing diblock copolymer. (B) Ketal substitution on PEG-polyserine changes over the course of reaction time, as determined by 1H NMR after DCl-induced hydrolysis of ketal groups.
Polymersome Vesicle Assembly and Characterization
To assemble the obtained amphiphilic PEG-poly(Ser-ketal) into the vesicles with encapsulated cargoes, a solvent evaporation method was applied.41 As displayed in Figure 3A, the transmission electron microscopy (TEM) image revealed that the resulting vesicles with insulin and enzymes have a spherical structure and a well-dispersed particle size. The average diameter determined by dynamic light scattering (DLS) was 324 nm (Figure 3B), which is consistent with the observation by TEM. The successful encapsulation of cargoes was further confirmed by the confocal laser scanning microscopy imaging of the vesicles with the Oregon Green 488 labeled insulin (Figure S5). The catalytic bioactivity of the encapsulated enzymes GOx/CAT was well preserved during the nanovesicle preparation (Figure S6). The insulin loading capacity was determined as 2.5 wt % (compared to the diblock copolymer weight). Higher loading capacity was attempted by increasing the insulin/enzyme concentration during polymersome assembly. However, significant insulin precipitation was observed during the nanovesicle preparation, indicating that 2.5 wt % might reach the maximum of the loading capacity. Interestingly, 1H NMR spectrum of nanovesicle in Figure S7 only showed the PEG peaks, while poly(Ser-ketal)’s signal was shielded off, suggesting that this nanovesicle has a “capsid” consisting of PEG, which screens signals.42,43 Such PEG-based corona serves as a passivating material for potentially reducing immune response due to PEG’s chemical inertness and resistance to protein.44 Furthermore, because the membrane is composed of a high molecular weight polymer, the vesicles have robust mechanical stability that can prevent from premature loss of their cargoes.31,45 No significant leakage of insulin or obvious morphological change was detected at 4 °C for one month.
Figure 3.
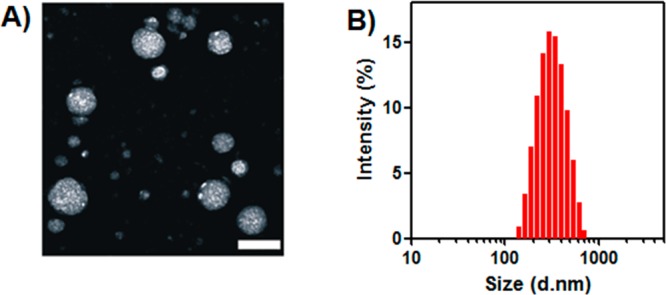
Characterization of polymersome nanovesicles. (A) TEM image of polymersome nanovesicle formed by PEG-poly(Ser-ketal). Scale bar: 500 nm. (B) Size distribution of vesicle encapsulated with insulin and enzymes examined by DLS.
To assess acid-responsive capability of the vesicles, the bare nanovesicle was first examined by measuring the turbidity of nanovesicle solution under different pH conditions at 37 °C (Figure 4A). The optical transmittance of the nanovesicle suspension at pH 7.4, 5.0, and 3.0 was monitored at the absorbance wavelength of 580 nm over time. The turbidity of the nanovesicle solution rapidly decreased at pH 3.0 and 5.0, a result of the hydrolysis of the diblock copolymer, followed by the dissociation of the nanovesicles. In contrast, the vesicle was stable at pH 7.4 and no noticeable turbidity change was observed over 30 h. To enable this pH-sensitive vesicle to respond toward glucose, GOx/CAT was incorporated to provide the enzyme-mediated pH stimulus. The cargo-loaded vesicles were tested in PBS buffer with different glucose concentrations, including a typical hyperglycemic level (400 mg/dL) and a normal level (100 mg/dL). As shown in Figure 4B, the vesicles exposed to the hyperglycemic level exhibited a remarkable pH stimulus. The pH value of the nanovesicle solution steadily decreases to 4.5 in 8 h, a result of the enzymatic conversion of glucose to gluconic acid. In contrast, an insignificant decline of pH value was recorded in the samples with no glucose or 100 mg/dL glucose, validating that the pH stimulus provided by enzymes was effectively correlated with the glucose concentration.
Figure 4.
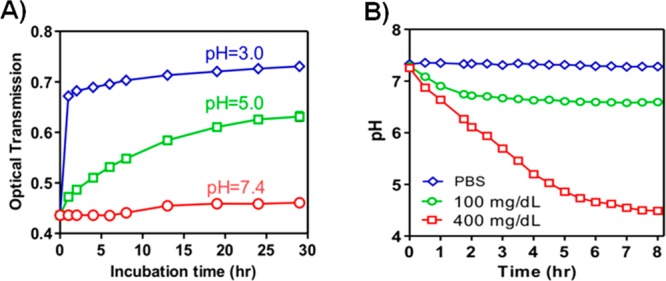
Acid sensitivity of the nanovesicles and its glucose responsiveness. (A) Optical transmittance profiles of the vesicle solution under different pH values over time, indicating the mild acid sensitivity of nanovesicle. (B) Relevant pH changes of the vesicles incubated with different glucose concentrations: 0, 100, and 400 mg/dL at 37 °C over time. Enzyme-encapsulated nanovesicle (nanoreactor) converts the glucose level signal into pH stimulus. Data points represent mean ± SD (n = 3).
In Vitro Glucose-Responsive Release of Insulin from the Nanovesicle Encapsulating Insulin and Enzymes
We next analyzed the in vitro insulin release profile of the vesicles in response to different glucose levels. As shown in Figure 5A, a rapid insulin release profile was achieved for the sample exposed to the hyperglycemic solution. In contrast, only a small amount of insulin was released from vesicles in either the 100 mg/dL glucose solution or the glucose-free PBS buffer over 12 h. Such a basal release rate of insulin at normoglycemic level is also desirable in insulin-dependent therapy to manage the blood-glucose fluctuations.11 The insulin release speed in Figure 5A is directly related to the ketal hydrolysis of the diblock copolymer, which is controlled by the pH stimulus of glucose metabolism. The proton accumulation in the initial state (0–1.5 h) is relatively low, resulting in a relatively flat release curve in the first 1.5 h. However, 3 h accumulation of proton dropped down the pH value of polymersome solution to ∼5.5, which was acidic enough to trigger bulk ketal hydrolysis with consequent fast insulin release. More importantly, a typical pulsatile insulin release pattern was observed when the vesicles were alternatively exposed between normoglycemic and hyperglycemic solutions every 2 h for several cycles (Figure 5B). The release rates responded to the change of glucose levels of the incubation solution. A maximum of 3-fold difference in insulin release rate was recorded when the glucose levels were switched. However, the release rates associated with hyperglycemic levels gradually decreased over time. The fading of the “pulsatile ability” can be attributed to the progressive dissociation of nanovesicle and the subsequent leakage of enzymes. Collectively, the results substantiated that the release of insulin from the cargo-encapsulated nanovesicle undergoes a glucose-mediated biomimetic process.
Figure 5.
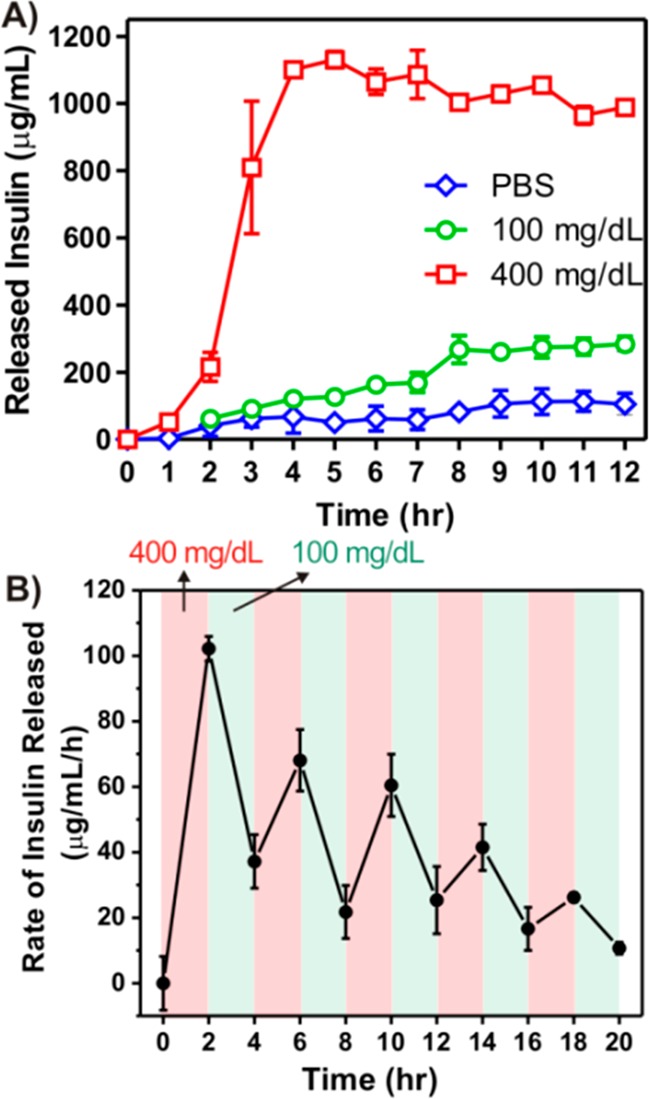
Glucose responsive insulin release of the nanovesicles in vitro. (A) In vitro accumulated insulin release from the vesicles incubated in the solutions with different glucose concentrations. (B) Pulsatile release profile of vesicles presents the rate of insulin release as a function of glucose concentrations (100 and 400 mg/dL). Data points represent mean ± SD (n = 3).
In Vivo Studies of the Polymersome Nanovesicle for Type 1 Diabetes Treatment
Utilizing the streptozotocin (STZ)-induced Type 1 diabetic mice as an animal model, we next assessed the in vivo efficacy of the insulin-loaded vesicles for diabetes treatment. We had first demonstrated that the native human insulin and the insulin released from nanovesicles upon 400 mg/dL glucose exposure showed similar bioactivity profiles after administration into diabetic mice at an equivalent dose (Figure S8), suggesting that the bioactivity of insulin was highly retained during the formulation preparation and release test. Mice were grouped and subcutaneously injected with the PBS solution, vesicles with insulin only (VS(I)) and vesicles with both insulin and enzymes (VS(E+I)), respectively. In order to (1) hold the formulation underneath the skin for the long-term release intention and (2) generate a catalysis center for synergistically enhanced conversion efficiency,15 30% Pluronic-127 (PF127), a thermoresponsive and biodegradable polymer, was mixed with the vesicle pellet to form a suspension (Figure 6A).46,47 Once subcutaneously injected, the suspension quickly formed a stable hydrogel, in which nanovesicle were evenly dispersed (Figures 6B and S9). The BG levels of mice in each group were monitored using a glucose meter over time. As summarized in Figure 7A, a rapid decrease of BG level in the first 12 h was observed in both VS(I) and VS(E+I) groups, which is likely due to the initial burst release of insulin outside the vesicles (Figure 7B). After that, the BG level in mice treated with VS(E+I) maintained in the normoglycemic range (<200 mg/dL for mouse) for up to 5 days. Moreover, the average BG level was significantly lower than that of the control group administrated with PBS only for up to 6 days. In contrast, the BG level of VS (I) group could only maintain in the normoglycemic state for 1 day, then steadily increased over time. In the absence of enzymes, VS(I) itself was unable to undergo acidic degradation for efficient insulin release, resulting in the noticeably higher BG levels of administrated mice than those treated with VS(E+I). Correspondingly, the plasma insulin concentration in the mice treated by VS(I) rapidly decreased on the next day after administration, while mice in VS(E+I) treated groups maintained a detectable plasma insulin level over the 10-day course (Figure 8). The calculated area under plasma insulin concentration–time curve in VS(E+I) group was much higher than that in VS(I) group, indicating a significant pharmacokinetic differences between these two formulations.
Figure 6.
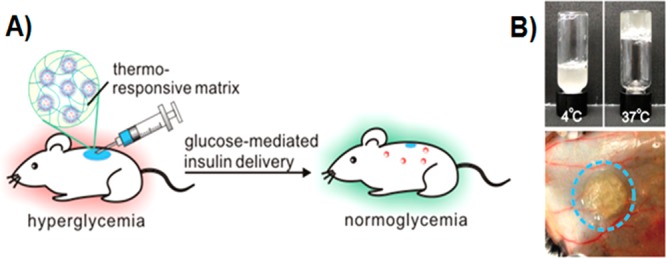
Injectable nanovesicle formulation made from the nanovesicle-embedded thermoresponsive matrix. (A) Schematic of in vivo studies of the glucose-responsive nanovesicle toward STZ-induced type 1 diabetic mice for regulation of the BG levels. (B) Nanovesicle integrated with thermoresponsive PF127 solution immediately formed a hydrogel at 37 °C (upper) in vitro and 3 min after subcutaneous injection (lower).
Figure 7.
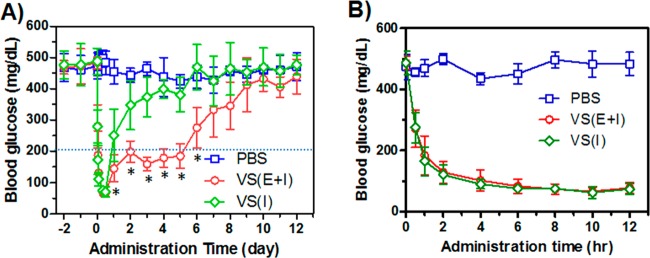
In vivo glucose regulation of nanovesicles on STZ-induced diabetic mice. (A) The BG levels of STZ-induced diabetic mice after treatment with PBS solution, vesicles encapsulating both enzyme and insulin (VS(E+I)) and vesicles encapsulating insulin only (VS(I)). *p < 0.01 compared to PBS group. (B) The BG level was continuously monitored in the first 12 h after administration of PBS solution, VS(E+I) and VS(I) in the STZ-induced diabetic mice. Data points represent mean ± SD (n = 7).
Figure 8.
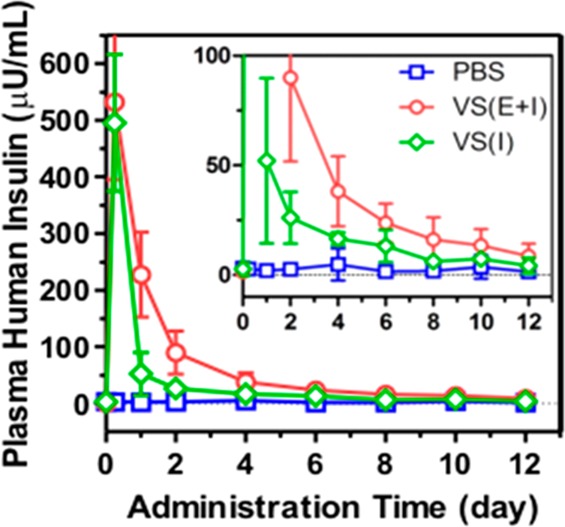
Changes of the plasma insulin concentration over time after administration. Data points represent mean ± SD (n = 7).
The in vivo glucose responsiveness of insulin/enzyme-loaded vesicles was verified by a glucose tolerance test at 3 days postadministration (Figure 9). Mice in VS(E+I) treated group showed an initial surge in BG concentration upon intraperitoneal glucose injection, followed by a quick decrease to normoglycemic level in 60 min. The glucose responsive profile in VS(E+I) group was comparable to that in the healthy mice control group. Moreover, the bare vesicles and their relevant degradation products (ethanol and acetone) did not show significant toxicity within all the studied concentrations (Figure 10A–D). The injected formulation including PF127 completely degraded in 4 weeks after administration, and no inflammatory region or fibrotic encapsulation was observed (Figure 10E,F).
Figure 9.
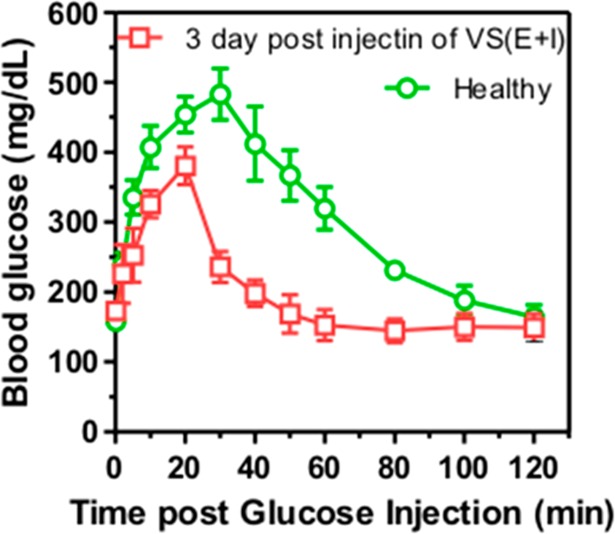
In vivo glucose tolerance test toward diabetic mice 3 days post injection of VS(E+I) in comparison with the healthy control mice. Data points represent mean ± SD (n = 3).
Figure 10.

Biocompatibility study of the nanovesicles in vitro and in vivo. Cytotoxicity assay of bare vesicle (A) and its degradation products, PEG-polyserine (B), acetone (C), and ethanol (D) toward HeLa cells for 24 h. H&E stained sections of subcutaneously injected PBS (E) or VS(E+I) (F) with surrounding tissue after 4 weeks, respectively. Scale bar: 200 μm.
Conclusion
In summary, a new biomimetic insulin delivery strategy has been developed using glucose-responsive polymersome nanovesicle. The enzymatic conversion of glucose into gluconic acid in the aqueous core of vesicles reduces the local pH, resulting in the hydrolysis of the mildly acidic-degradable components of assembled polymers and the dissociation of vesicles, therefore facilitating the release of encapsulated insulin. The in vivo studies demonstrated that this nanovesicle is highly biocompatible and effective in regulating blood glucose levels for a long period of time. Further study will be essential to optimize the glucose response sensitivity and achieve dynamic regulation of the BG levels under in vivo conditions. Additionally, we believe that this acid-sensitive formulation may be extended to allow delivery of other therapeutic agents, the release of which can be promoted under acidic environments, such as tumor sites or intracellular endosomes.48−50
Acknowledgments
This work was supported by a grant from the Junior Faculty Award of American Diabetes Association (ADA), Grant 550 KR51307 from NC TraCS, NIH’s Clinical and Translational Science Awards (CTSA, NIH Grant 1UL1TR001111) at UNC–CH, and the NC State Faculty Research and Professional Development Award to Z.G.
Supporting Information Available
Experimental details of the polymer synthesis, characterization, toxicity assay and histology test. This material is available free of charge via the Internet at http://pubs.acs.org.
The authors declare no competing financial interest.
Funding Statement
National Institutes of Health, United States
Supplementary Material
References
- Kasuga M. J. Clin. Invest. 2006, 116, 1756–1760. [DOI] [PMC free article] [PubMed] [Google Scholar]
- Tabak A. G.; Herder C.; Rathmann W.; Brunner E. J.; Kivimaki M. Lancet 2012, 379, 2279–2290. [DOI] [PMC free article] [PubMed] [Google Scholar]
- Mo R.; Jiang T.; Di J.; Tai W.; Gu Z. Chem. Soc. Rev. 2014, 43, 3595–3629. [DOI] [PubMed] [Google Scholar]
- Oulahiane A.; Anaddam S.; Ouleghzal H.; Elhaddad N.; Moussaoui S.; Yaagoubi N.; Boufares F.; Belmejdoub G. Nephrol. Ther. 2012, 8, 135–140. [DOI] [PubMed] [Google Scholar]
- Sowers J. R.; Lester M. A. Diabetes Care 1999, 22Suppl 3C14–20. [PubMed] [Google Scholar]
- Giovannucci E.; Harlan D. M.; Archer M. C.; Bergenstal R. M.; Gapstur S. M.; Habel L. A.; Pollak M.; Regensteiner J. G.; Yee D. Diabetes Care 2010, 33, 1674–1685. [DOI] [PMC free article] [PubMed] [Google Scholar]
- Cryer P. E. J. Clin. Invest. 2007, 117, 868–870. [DOI] [PMC free article] [PubMed] [Google Scholar]
- Cengiz E.; Sherr J. L.; Weinzimer S. A.; Tamborlane W. V. Exp. Rev. Med. Dev. 2011, 8, 449–458. [DOI] [PMC free article] [PubMed] [Google Scholar]
- Ravaine V.; Ancla C.; Catargi B. J. Controlled Release 2008, 132, 2–11. [DOI] [PubMed] [Google Scholar]
- Bratlie K. M.; York R. L.; Invernale M. A.; Langer R.; Anderson D. G. Adv. Healthcare Mater. 2012, 1, 267–284. [DOI] [PMC free article] [PubMed] [Google Scholar]
- Gordijo C. R.; Koulajian K.; Shuhendler A. J.; Bonifacio L. D.; Huang H. Y.; Chiang S.; Ozin G. A.; Giacca A.; Wu X. Y. Adv. Funct. Mater. 2011, 21173–82. [Google Scholar]
- Fischel-Ghodsian F.; Brown L.; Mathiowitz E.; Brandenburg D.; Langer R. Proc. Natl. Acad. Sci. U.S.A. 1988, 85, 2403–2406. [DOI] [PMC free article] [PubMed] [Google Scholar]
- Traitel T.; Cohen Y.; Kost J. Biomaterials 2000, 21, 1679–1687. [DOI] [PubMed] [Google Scholar]
- Podual K.; Doyle F. J. III; Peppas N. A. J. Controlled Release 2000, 67, 9–17. [DOI] [PubMed] [Google Scholar]
- Gu Z.; Aimetti A. A.; Wang Q.; Dang T. T.; Zhang Y.; Veiseh O.; Cheng H.; Langer R. S.; Anderson D. G. ACS Nano 2013, 7, 4194–4201. [DOI] [PMC free article] [PubMed] [Google Scholar]
- Gu Z.; Dang T. T.; Ma M.; Tang B. C.; Cheng H.; Jiang S.; Dong Y.; Zhang Y.; Anderson D. G. ACS Nano 2013, 7, 6758–6777. [DOI] [PubMed] [Google Scholar]
- Gordijo C. R.; Shuhendler A. J.; Wu X. Y. Adv. Funct. Mater. 2010, 20, 1404–1412. [Google Scholar]
- Kataoka K.; Miyazaki H.; Bunya M.; Okano T.; Sakurai Y. J. Am. Chem. Soc. 1998, 120, 12694–12695. [Google Scholar]
- Kataoka K.; Miyazaki H.; Okano T.; Sakurai Y. Macromolecules 1994, 27, 1061–1062. [Google Scholar]
- Wu W.; Mitra N.; Yan E. C.; Zhou S. ACS Nano 2010, 4, 4831–4839. [DOI] [PubMed] [Google Scholar]
- Matsumoto A.; Ishii T.; Nishida J.; Matsumoto H.; Kataoka K.; Miyahara Y. Angew. Chem., Int. Ed. 2012, 124, 2166–2170. [DOI] [PubMed] [Google Scholar]
- Kim H.; Kang Y. J.; Kang S.; Kim K. T. J. Am. Chem. Soc. 2012, 134, 4030–4033. [DOI] [PubMed] [Google Scholar]
- Zhao Y.; Trewyn B. G.; Slowing I. I.; Lin V. S. J. Am. Chem. Soc. 2009, 131, 8398–8400. [DOI] [PubMed] [Google Scholar]
- Dasgupta I.; Tanifum E. A.; Srivastava M.; Phatak S. S.; Cavasotto C. N.; Analoui M.; Annapragada A. PLoS One 2012, 7, 29585. [DOI] [PMC free article] [PubMed] [Google Scholar]
- Wu S.; Huang X.; Du X. Angew. Chem., Int. Ed. 2013, 52, 5580–5584. [DOI] [PubMed] [Google Scholar]
- Uchiyama T.; Watanabe J.; Ishihara K. J. Biomater. Sci., Polym. Ed. 2004, 15, 1237–1262. [DOI] [PubMed] [Google Scholar]
- Marsden H. R.; Quer C. B.; Sanchez E. Y.; Gabrielli L.; Jiskoot W.; Kros A. Biomacromolecules 2010, 11, 833–838. [DOI] [PubMed] [Google Scholar]
- Nallani M.; de Hoog H. P.; Cornelissen J. J.; Palmans A. R.; van Hest J. C.; Nolte R. J. Biomacromolecules 2007, 8, 3723–3728. [DOI] [PubMed] [Google Scholar]
- Meng F.; Zhong Z.; Feijen J. Biomacromolecules 2009, 10, 197–209. [DOI] [PubMed] [Google Scholar]
- Spulber M.; Baumann P.; Saxer S. S.; Pieles U.; Meier W.; Bruns N. Biomacromolecules 2014, 15, 1469–1475. [DOI] [PubMed] [Google Scholar]
- Discher D. E.; Ahmed F. Annu. Rev. Biomed. Eng. 2006, 8, 323–341. [DOI] [PubMed] [Google Scholar]
- Mabrouk E.; Cuvelier D.; Brochard-Wyart F.; Nassoy P.; Li M. H. Proc. Natl. Acad. Sci. U.S.A. 2009, 106, 7294–7298. [DOI] [PMC free article] [PubMed] [Google Scholar]
- Napoli A.; Boerakker M. J.; Tirelli N.; Nolte R. J.; Sommerdijk N. A.; Hubbell J. A. Langmuir 2004, 20, 3487–3491. [DOI] [PubMed] [Google Scholar]
- Wilchek M.; Patchornik A. J. Org. Chem. 1964, 29, 1629–1630. [Google Scholar]
- William H. Daly D. P. Tetrahedron Lett. 1988, 29, 5859–5862. [Google Scholar]
- Tang H.; Yin L.; Lu H.; Cheng J. Biomacromolecules 2012, 13, 2609–2615. [DOI] [PMC free article] [PubMed] [Google Scholar]
- Lu H.; Cheng J. J. Am. Chem. Soc. 2008, 130, 12562–12563. [DOI] [PubMed] [Google Scholar]
- Tai W.; Shukla R. S.; Qin B.; Li B.; Cheng K. Mol. Pharmaceutics 2011, 8, 901–912. [DOI] [PMC free article] [PubMed] [Google Scholar]
- Tai W.; Chen Z.; Cheng K. Mol. Pharmacol. 2013, 10, 477–487. [DOI] [PMC free article] [PubMed] [Google Scholar]
- Broaders K. E.; Cohen J. A.; Beaudette T. T.; Bachelder E. M.; Fréchet J. M. Proc. Natl. Acad. Sci. U.S.A. 2009, 106, 5497–5502. [DOI] [PMC free article] [PubMed] [Google Scholar]
- Marsden H. R.; Gabrielli L.; Kros A. Polym. Chem. 2010, 1, 1512–1518. [Google Scholar]
- Ding M.; Song N.; He X.; Li J.; Zhou L.; Tan H.; Fu Q.; Gu Q. ACS Nano 2013, 7, 1918–1928. [DOI] [PubMed] [Google Scholar]
- Cuong N.-V.; Li Y.-L.; Hsieh M.-F. J. Mater. Chem. 2012, 22, 1006–1020. [Google Scholar]
- Peer D.; Karp J. M.; Hong S.; Farokhzad O. C.; Margalit R.; Langer R. Nat. Nanotechnol. 2007, 2, 751–760. [DOI] [PubMed] [Google Scholar]
- Discher B. M.; Won Y.-Y.; Ege D. S.; Lee J. C.; Bates F. S.; Discher D. E.; Hammer D. A. Science 1999, 284, 1143–1146. [DOI] [PubMed] [Google Scholar]
- Jeong B.; Kim S. W.; Bae Y. H. Adv. Drug Delivery Rev. 2012, 64, 154–162. [Google Scholar]
- Morikawa K.; Okada F.; Hosokawa M.; Kobayashi H. Cancer Res. 1987, 47, 37–41. [PubMed] [Google Scholar]
- Gu Z.; Biswas A.; Zhao M.; Tang Y. Chem. Soc. Rev. 2011, 40, 3638–3655. [DOI] [PubMed] [Google Scholar]
- Tai W.; Mahato R.; Cheng K. J. Controlled Release 2010, 146, 264–275. [DOI] [PMC free article] [PubMed] [Google Scholar]
- Mo R.; Jiang T.; Gu Z. Angew. Chem., Int. Ed. 2014, 10.1002/anie.201400268. [DOI] [Google Scholar]
Associated Data
This section collects any data citations, data availability statements, or supplementary materials included in this article.