

Abstract
Repairing articular cartilage by combining microfracture and various scaffolds has been extensively performed in in vivo animal models. We previously described a novel extracellular matrix (ECM) scaffold for cartilage tissue engineering. The aim of this study was to investigate the effect of a bone marrow-derived mesenchymal stem cells-derived ECM (BMSC-dECM) scaffold on the chondrogenic differentiation of marrow clots following microfracture in vitro. In this study, we manufactured the BMSC-dECM scaffold using a freeze-drying method. To obtain the marrow clots, a full-thickness cartilage defect was established and microholes were created in the trochlear groove of New Zealand white rabbits. The samples were divided and cultured in vitro for 1, 2, 4, and 8 weeks. The samples included a culture of the marrow clot alone (Group 1), a culture of the marrow clot with transforming growth factor-beta 3 (TGF-β3) (Group 2), a culture of the composite of the BMSC-dECM scaffold and the marrow clot alone (Group 3), and a culture of the composite with TGF-β3 (Group 4). A smooth and glossy surface was observed in Group 2 and Group 4 over time, but the surface for Group 4 was larger from week 1 onward. Compressive strength gradually increased in Groups 2 and 4, and greater increases were observed in Group 4 during the 8-week culture period. Enhanced cartilage-like matrix deposition of glycosaminoglycan (GAG) and type II collagen were confirmed by Safranin O and immunohistochemistry staining, respectively, in Groups 2 and 4. The GAG and collagen contents also gradually increased over time in Groups 2 and 4; the increase was greater in Group 4. In addition, real-time-polymerase chain reaction demonstrated that the expression of chondrogenic genes, such as COL2, ACAN, and SOX9, was gradually upregulated in Groups 2 and 4. However, greater increases in the expression of these cartilage-like genes were observed in Group 4 from week 4 onward. Our results suggest that the BMSC-dECM scaffold may favor the chondrogenesis of marrow clots following microfracture in vitro. In conclusion, these tissue engineering-like constructs could be potential candidates for cartilage repair.
Introduction
Articular cartilage injuries have limited inherent regeneration capacity because of their avascular nature. Most defects progressively deteriorate over time and eventually develop into osteoarthritis. In general, cartilage repair techniques include microfracture, joint irrigation or debridement, osteochondral grafting, and autologous chondrocyte implantation.1–4 However, in clinical practice, microfracture technology is often used as a first-line therapy option because it is technically simple, minimally invasive, and inexpensive. An arthroscopic awl is used to make multiple microfracture holes in the subchondral bone plate until marrow blood bleeds from the marrow cavity during surgery. The marrow elements (bone marrow-derived mesenchymal stem cells [BMSCs], growth factors, etc.) form a surgically induced marrow clot on the surface of the lesion that provides an optimal environment for cartilaginous repair tissue formation. However, the repair tissue has limited strength and an appearance that resembles fibrocartilage,5–7 and it may ultimately develop into osteoarthritis. Although the factors involved in fibrocartilage formation are not clear, the instability of marrow clots and the loss of BMSCs may be the main barriers to fibrocartilage repair. Therefore, many researchers have attempted to develop novel methods for producing high-quality hyaline cartilage-like tissues.
With the rapid development of tissue engineering technology, a combination of microfracture and various scaffolds including both synthetic and natural polymers (e.g., polyglycolic acid, polylactic acid, polylactic-co-glycolic acid, collagen, chitosan, and hyaluronic acid8–12) have been introduced for repairing cartilage lesions. These scaffolds may provide a stable 3D structure that can sustain marrow clots, thus preserving the BMSCs. Although some satisfactory results have been obtained with these scaffolds, they have limited clinical applications because of their unstable degradation, their toxic biological metabolites, and the potential risks of pathogen transmission. Recently, many studies have focused on fabricating natural extracellular matrix (ECM) scaffolds. ECM scaffolds are highly biodegradable, biocompatible, and porous.13,14 Thus, they can play structural and functional roles in cell adhesion, proliferation, and differentiation. In our previous studies, we demonstrated that a chondrocyte-derived ECM scaffold had excellent capacity to support cartilage regeneration in vitro and cartilage repair in vivo.15–17 However, the applications for this ECM scaffold may be limited by its availability (it is derived using a two-step process with autologous chondrocytes) or by the potential for inflammatory reactions and pathogen transmission, which may occur if allogeneic chondrocytes are used.
To avoid these potential risks, autologous BMSCs were used for fabricating a novel ECM scaffold using a lyophilized method. The aim of the present study was to investigate the feasibility and validity of chondrogenesis from a BMSC-derived ECM (BMSC-dECM) scaffold combined with marrow clots after microfracture in vitro. Meanwhile, transforming growth factor-beta 3 (TGF-β3) was added to the culture medium because of its excellent potential to promote chondrogenic differentiation.18,19 To the best of our knowledge, there have been no previous studies showing the changes in marrow clots after microfracture in vitro. It was hypothesized that the BMSC-dECM scaffold would favor the chondrogenesis of marrow clots following microfracture in vitro.
Materials and Methods
Isolation and cultivation of BMSCs
Rabbit BMSCs were obtained from 20 skeletally mature (5–6 months old) female New Zealand white rabbits. The bone marrow was aseptically aspirated from the posterior superior iliac spine, and the mononuclear cells were isolated by density gradient centrifugation at 500 g for 5 min. The mononuclear cells were cultured in Dulbecco's modified Eagle's medium (DMEM; Gibco) supplemented with 10% fetal bovine serum (FBS; Gibco) and 1% antibiotics-antimycotics and incubated at 37°C in a 5% CO2 humidified incubator. The medium was exchanged every 2–3 days.
Preparation of BMSC-dECM scaffolds
When the BMSCs (passage 3) were ∼100% confluent, the culture medium was changed to DMEM containing 4 mM L-glutamine, 0.4 mM L-proline, 0.1 mM nonessential amino acids, 1 mM sodium pyruvate, 100 U/mL penicillin, 100 μg/mL streptomycin, 50 μg/mL ascorbic acid, 150 μg/mL ascorbic acid 2- phosphate, and 10% FBS to promote the secretion of ECM, as previously described in the literature.20 After 1 week, the ECM membranes were collected and stored at −80°C for 1 day, after which they were freeze-dried for 48 h to remove the moisture from the ECM. Next, the lyophilized ECM was mixed with deionized water at a ratio of 1:20 and ground using a grinding machine (A11; IKA). The grinding fluid was frozen at −80°C for 1 day and lyophilized for 48 h to obtain the ECM scaffolds. The BMSC-dECM scaffolds, which were 6 mm in diameter and 3 mm in thickness, were punched using a biopsy punch (6 mm in diameter; Corning). The cylindrical ECM scaffolds were sterilized using ethylene oxide. The microstructure of the BMSC-dECM scaffolds was assessed using a scanning electron microscope (SEM; JEOL).
Microfracture procedure in a rabbit model and grouping
All the animal experiments were approved by the local institutional ethics committee. A total of 40 skeletally mature rabbits were anesthetized by intramuscular administration of ketamine hydrochloride (15 mg/kg). A medial parapatellar skin incision was then made. Next, the joint capsule was opened, and the patella was laterally dislocated to expose the trochlear groove of the femur. A full-thickness cartilage defect (6×6 mm) was created in the center of the trochlear groove. Five microfracture holes (1 mm in diameter, 3 mm in depth, and 2 mm apart) were then made using a syringe needle, and visible bleeding was observed in all 40 rabbits.
Marrow clots were obtained from 20 of the rabbits by allocating samples of bone marrow after microfracture to individual wells in a 96-well plate with a syringe. The wells had a diameter of ∼6 mm, and the thickness of the marrow clots was ∼3 mm. The cultures of marrow clots alone were classified as Group 1, and the cultures of the marrow clots in chondrogenic differentiation medium (containing high-glucose DMEM, 10% FBS, 1% penicillin–streptomycin, 37.5 μg/mL l-ascorbic acid 2-phosphate, 40 μg/mL L-proline, 100 μg/mL sodium pyrevate, 6.25 μg/mL bovine insulin, 6.25 μg/mL transferrin, 6.25 μg/mL selenous acid, 5.33 μg/mL linoleic acid, 100 nM dexamethasone, and 10 ng/mL TGF-β3 [PeproTech]) were classified as Group 2. Meanwhile, the BMSC-dECM scaffolds were implanted into the cartilage defect to create a composite ECM scaffold and marrow clot in the remaining 20 rabbits, which were punctured to acquire the bone marrow used for fabricating the separate BMSC-dECM scaffolds. The cultures of the composite BMSC-dECM scaffold and marrow clot were designated as Group 3, and the composites cultured in chondrogenic differentiation medium were designated as Group 4 (Fig. 1). After collection of the tissues for culture, the rabbits were sacrificed using an overdose of sodium pentobarbital. Normal femoral condyles were also collected for subsequent in vitro evaluations.
FIG. 1.
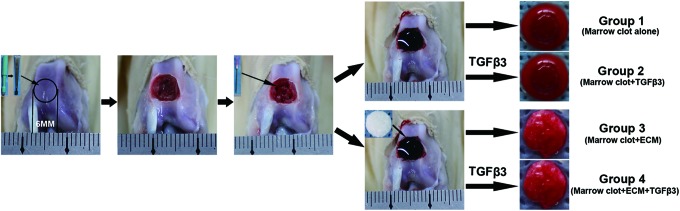
Microfracture in a rabbit model design and grouping. The experimental details are described in the Materials and Methods section. For the in vitro studies, the specimens were divided into four groups. Color images available online at www.liebertpub.com/tea
Cell viability, gross observation, and volume of culture tissues
The viability of the cells in the culture tissues on day 1 was assessed using the Live/Dead Reduced Biohazard Viability/Cytotoxicity Kit (Molecular Probes) according to the manufacturer's instructions. The specimens were washed with PBS and incubated in the dilute dye solution for 15 min at room temperature. Next, the samples were fixed with 4% glutaraldehyde for 1 h and viewed using a confocal microscope (Leica TCS SP2 Confocal Microscope; Leica). The live cells were stained green, and the dead cells appeared red. The gross morphology of the culture tissues (i.e., size, color, and shape) was observed after 1, 2, 4, and 8 weeks of chondrogenic differentiation in vitro. As a control, native cartilage was also assessed. The volume of the culture tissues was assessed using Adobe Photoshop 5.0 software (Adobe Systems). In brief, the surface area and the thickness of the samples were measured as accurately as possible using Photoshop software. The volume was calculated by multiplying the surface area by the thickness.
Mechanical testing
Specimens were collected from the culture medium at various time points (1, 2, 4, and 8 weeks) and subjected to a mechanical compressive strength test using an Instron universal testing machine (Instron Ltd.). Briefly, the samples were cut into uniform cylinders and placed on a metal plate, where stress tests were performed with a single compression at a speed of 1 mm/min until 10% strain was reached. The compressive strength was calculated at the moment of 10% strain.
Histological and immunohistochemical staining
The culture tissues were fixed in 10% formalin for at least 24 h, dehydrated with a graded ethanol series, and then embedded in paraffin. The sections, 4 μm in thickness, were stained with Safranin O/Fast Green stain. For the immunohistochemical staining of type II collagen, separate sections were incubated with proteinase K for 30 min to increase the tissue permeability and immersed in 3% H2O2-methanol for 10 min to block the endogenous peroxidase. The sections were then incubated with mouse anti-rabbit collagen type II monoclonal antibody (1:200 dilution; Novus Biologicals) at 37°C for 1 h. After the samples were washed thrice with PBS, they were incubated with anti-mouse secondary antibody (DakoCytomation) at 1:200 dilution at 37°C for 15 min. They were then incubated in 3,3′-diaminobenzidine tetrahydrochloride solution for 5 min at room temperature and counterstained with Mayer's hematoxylin (Sigma) for 10 min. Finally, the sections were mounted for microscopic observation. As a control, native cartilage was also stained.
Biochemical assay
For the glycosaminoglycan (GAG) analysis, papain (Sigma) was dissolved at 200 μg/mL in a buffer of 0.2 M sodium phosphate (pH 6.4), 0.1 M sodium acetate, 10 mM Na2EDTA, and 5 mM cysteine HCl. The samples were then digested in papain solution at 65°C for 12 h. The native cartilage (the control), which was 6 mm in diameter and 2–3 mm in thickness, was also digested with papain solution. The GAG content was quantified using a Blyscan™ sulfated GAG assay kit (Biocolor) according to the manufacturer's protocol. Briefly, the solution was mixed with Blyscan dye reagent and shaken for 30 min in a gentle mechanical shaker. Next, the sGAG-dye complex was centrifuged at 12,000 rpm for 10 min. After the non-sGAG dye was drained from the tube, the dissociation reagent was added to the remaining deposit. A 200-μL sample was then transferred to individual wells of a 96-well plate. The absorbance was measured at a wavelength of 656 nm using a microplate reader (Bio-Rad Laboratories). The GAG content and variation were calculated based on a standard curve supplied with the kit.
The collagen content was measured using a Sircol Collagen Assay Kit (Biocolor) according to a standardized protocol. In brief, the samples were digested for 12 h at 4°C in 0.5 M acetic acid containing 200 μg/mL pepsin (Sigma). Control samples of native cartilage were also digested with the pepsin solution. Sircol dye reagent was added to the solution, and the collagen-dye complex was allowed to precipitate out from the dye. After centrifugation at 12,000 rpm for 10 min, the deposit was washed with ice-cold acid-salt wash reagent to remove unbound dye and then dissolved in alkali reagent. A 200-μL sample of the solution was transferred to a 96-well plate, and the absorbance was measured at 555 nm within 2–3 h. The collagen content and the collagen variation were calculated using a standard curve supplied with the kit.
Real-time-polymerase chain reaction analysis
The samples were harvested and analyzed for gene expression after 1, 2, 4, and 8 weeks in culture. The culture tissue was rinsed twice with PBS buffer and lysed in TRIzol (Invitrogen) at room temperature for 10 min. The total RNA was extracted according to the manufacturer's protocol. Briefly, the total RNA was reverse transcribed to cDNA using a High-Capacity cDNA Reverse Transcription Kit (Applied Biosystems). Real-time-polymerase chain reaction (RT-PCR) was then performed for type I collagen (COL1), type II collagen (COL2), SOX9, aggrecan (ACAN), and glyceraldehyde-3-phosphate dehydrogenase (GAPDH) using an ABI Prism 7500 sequence detection system (Applied Biosystems) according to the manufacturer's instructions. GAPDH was used as the housekeeping gene for normalization. The system was programmed to run for 40 cycles. The primer sequences were designed using Primer 5 software and are listed in Table 1.
Table 1.
Detailed Information About the Primer Sequences Used for Real-Time-Polymerase Chain Reaction
| Gene | Primer nucleotide sequence |
|---|---|
| GAPDH | Forward: 5-ATGGGGAAGGTGAAGGTCG-3 |
| Reverse: 3-CCAGTGGTCCCGACGAAAAT-5 | |
| Type I collagen | Forward: 5-GCGGTGGTTACGACTTTGGTT-3 |
| Reverse: 3-AGTGAGGAGGGTCTCAATCTG-5 | |
| Type II collagen | Forward: 5-GGCAATAGCAGGTTCACGTACA-3 |
| Reverse: 3-TTCACCCCGTTCTGACAATAGC-5 | |
| SOX9 | Forward: 5-CACACAGCTCACTCGACCTTG-3 |
| Reverse: 3-GCTCTACTAGGATTTTATTGGCTT-5 | |
| aggrecan | Forward: 50-TCGAGGACAGCGAGGCC-3 |
| Reverse: 3-AGAGATGTGCGATGTGGGAGCT-5 |
Statistical analysis
The statistical analysis was performed with SPSS statistical software (version 13.0; SPSS, Inc.). All of the statistical analyses were performed using a one-way analysis of variance. Fisher's least significant difference post hoc test was used to compare the differences in volume, GAG and collagen content, and gene expression among Group 1, Group 2, Group 3, and Group 4. The level of statistical significance was set at p<0.05.
Results
Macrostructure and microstructure of the BMSC-dECM scaffold
The gross observation showed that the white, spongy ECM scaffold had a diameter of 6 mm and a thickness of ∼2–3 mm (Fig. 2A). Using SEM, we observed that the scaffold had a uniform 3D porous framework and that most of the pores were circular (Fig. 2B), which could favor cell growth, adhesion, and proliferation.
FIG. 2.
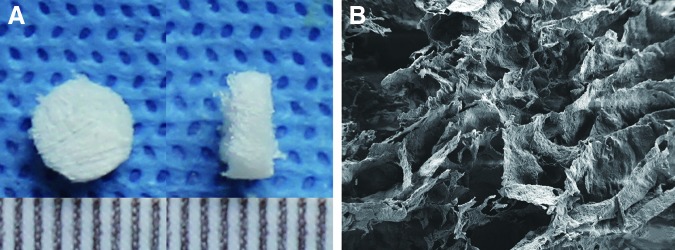
Gross and microscopic observation of the bone marrow-derived mesenchymal stem cells-derived extracellular matrix (BMSC-dECM) scaffold. (A) The white, spongy ECM scaffold had a diameter of 6 mm and a thickness of ∼2–3 mm. (B) The ECM scaffold had a uniform 3D porous framework, and most of the pores were circular. Magnification ×500. Color images available online at www.liebertpub.com/tea
Cell viability, gross morphology, and volume of culture tissues in vitro
After 1 day of culture, the viability of the cells was evaluated using the Live/Dead assay. The confocal images showed that in Groups 1 and 2, some cells were dead and stained red. However, more cells were alive and stained green in Groups 3 and 4 (Fig. 3A). After the samples had been cultured for 1, 2, 4, and 8 weeks in vitro, their general morphology was observed (Fig. 3B). There were no obvious changes in the appearance of Group 1. A smooth and glossy surface similar to the appearance of the native cartilage was observed in Groups 2 and 4. In Group 3, a rough and oblate surface was observed. The volume of Group 1 decreased with culture time and eventually disappeared by the 8-week observation. In Group 2, the volume gradually diminished after 1, 2, and 4 weeks but increased after 8 weeks. A slight reduction in the volume of Group 3 was observed during culturing. However, Group 3 had greater volume than Group 2 (p<0.001). In Group 4, a reduction in volume was observed after 1 and 2 weeks, but the volume increased gradually and was larger than that of Groups 1, 2, and 3 at both 4 and 8 weeks (p<0.001) (Fig. 3C).
FIG. 3.

Cell viability, gross morphology, and volume of the cultivated tissues in vitro. (A) The Live/Dead assay was performed to evaluate the viability of the cells. The confocal images showed that some cells in Groups 1 and 2 were stained red. However, in Groups 3 and 4, more cells were stained green. Magnification ×100. (B) The general morphology of the cultivated tissues was observed at 1, 2, 4, and 8 weeks. Groups 2 and 4 had a smooth, glossy surface similar to the appearance of the native cartilage, whereas Group 3 had a rough and oblate surface. The scale bar is in millimeters (mm). (C) The volume of each group was measured at 1, 2, 4, and 8 weeks, as described in the Materials and Methods section. Statistically significant differences were determined using a one-way analysis of variance (ANOVA) test. Fisher's least significant difference (LSD) post-hoc test was used to compare the differences among groups. Color images available online at www.liebertpub.com/tea
Mechanical testing
The cultured tissues were tested for compressive strength at the moment of 10% strain (Fig. 4). After 1 week, Groups 1 and 2 demonstrated greater strength than Groups 3 and 4 (p<0.05). However, after 2, 4, and 8 weeks, the compressive stress tolerated by Groups 2 and 4 was higher than Groups 1 and 3 (p<0.05). After 4 weeks, the value for Group 4 was higher than the value for Group 2 (p<0.05). After 8 weeks, the compressive strength of Group 2 (1.45±0.18 kPa) was ∼81% of the strength of Group 4 (1.78±0.28 kPa) (p<0.01). No obvious changes were observed in the strength of Group 3. The strength of Group 1 could not be tested after 4 weeks because the specimens were too small and soft.
FIG. 4.

The compressive strength of the culture tissues was tested at 1, 2, 4, and 8 weeks at the moment of 10% strain in each group, as described in the Materials and Methods section. The data are presented as mean values±SD. Statistically significant differences were determined using an ANOVA test. *p<0.05, **p<0.01.
Histology and immunohistochemistry
Safranin O staining of the specimens demonstrated the accumulation of sulfated proteoglycans. In Groups 2 and 4, the staining was primarily distributed around the periphery of the samples after 1 week. Many cartilage lacunas containing cells gradually accumulated and more GAG was synthesized throughout the tissues as the culture time increased. Meanwhile, Safranin O staining showed that the porous framework of the ECM scaffold gradually became uniformly filled. The thickness of the inner walls decreased with culture time in Group 4, most likely indicating the biodegradation of the ECM scaffold. In Groups 1 and 3, a few cells were observed, and no GAG accumulated (Fig. 5A).
FIG. 5.

The accumulation of sulfated proteoglycans and type II collagen in culture tissues. (A) Safranin O staining in the samples from each group at 1, 2, 4, and 8 weeks. Original magnification ×40, detailed magnification ×400. (B) Immunohistochemical staining for type II collagen at 1, 2, 4, and 8 weeks in each group. Original magnification ×40, detailed magnification ×400. Color images available online at www.liebertpub.com/tea
Immunohistochemical staining revealed the synthesis of type II collagen. Type II collagen was increasingly synthesized over time in Group 2. Similar to the sulfated proteoglycans, type II collagen was distributed throughout the ECM scaffold in Group 4. No obvious accumulation of type II collagen was observed in Groups 1 and 3 (Fig. 5B).
Biochemical analysis of culture tissues
The GAG content and collagen content were quantitatively measured using chemical assays during the culture period (Fig. 6). The amount of GAG increased gradually over time in Groups 2 and 4. After 8 weeks, the GAG content in Group 4 (271.73±4.1 μg) was significantly higher than that in Group 2 (187±4.77 μg) and equivalent to 76% of the GAG content in the native cartilage (358.56±14.33 μg). No evident GAG accumulated in Groups 1 and 3 (Fig. 6A). Meanwhile, an increase in GAG content was observed in Group 4 after 2 weeks (Fig. 6B). The collagen content was similar to the GAG content. The collagen content gradually increased with time in Groups 2 and 4; after 8 weeks, the collagen content in Groups 2 and 4 was 38% (905.05±87.57 μg) and 54% (1271.95±24.45 μg), respectively, of the native cartilage level (2356.3±27.08 μg). However, in Groups 1 and 3, no obvious collagen was synthesized at the various culture times tested (Fig. 6C). Remarkably, in Group 4, the accumulation of collagen was evident from week 1 (Fig. 6D).
FIG. 6.

Biochemical assays in culture tissues. The content and variation of GAG (A, C) and collagen (B, D) were quantitatively measured during the culture period as described in the Materials and Methods section. The data are presented as microgram/construct with standard deviation from three independent experiments. Statistically significant differences were determined using an ANOVA test. *p<0.05, **p<0.01, ***p<0.001.
Gene expression analysis of the cultured tissues
The RT-PCR analysis demonstrated that the expression of SOX9 gradually increased over time in Groups 2 and 4. The level of SOX9 in Group 2 was significantly higher than that in Group 4 after 1 week. However, Group 4 showed stronger expression of SOX9 than Group 2 at 4 and 8 weeks (Fig. 7A). The level of ACAN was much higher in Group 4 than in Group 2, though it increased with culture time in both groups (Fig. 7B). At 1 and 2 weeks, the expression of COL2 was significantly higher in Group 2 than in Group 4. However, there was a higher level of COL2 in Group 4 from week 4 onward (Fig. 7C). The expression of COL1 in Group 4 was higher than in Group 2 at 1, 2, and 4 weeks and significantly lower than in Group 2 at 8 weeks (Fig. 7D). No obvious changes in SOX9, ACAN, COL2, and COL1 were observed in Groups 1 and 3 over time (Fig. 7).
FIG. 7.

Gene expression in culture tissues. The expression of SOX9 (A), ACAN (B), COL2 (C), and COL1 (D) was assessed as described in the Materials and Methods section. The expression levels of the respective genes were normalized to the housekeeping gene GAPDH. Statistically significant differences were determined using an ANOVA test. **p<0.01, ***p<0.001.
Discussion
In our previous studies, ECM scaffolds derived from chondrocytes had excellent effects on the cartilage repair process.15–17 This study showed that the BMSC-dECM scaffold favored the chondrogenesis of marrow clots following microfracture in vitro, which is quite consistent with our previous observations. Some studies have shown that ECM scaffolds contain a variety of proteins and growth factors and are highly biodegradable.21,22 Meanwhile, in our study, a highly porous microstructure of the ECM scaffold was observed using SEM, suggesting that a microenvironment for cell adhesion, proliferation, and differentiation can be provided by a BMSC-dECM scaffold.
In recent years, much attention has been focused on achieving cartilage regeneration by combining microfracture and scaffold materials. Yang et al. demonstrated the effect of long-term delivery of bone morphogenetic protein (BMP)-2 and microfracture on cartilage defects. In their research, heparin-conjugated fibrin was used as a carrier for the delivery of BMP-2. Their results showed that the experimental group had the highest GAG and type II collagen content, which subsequently resulted in the regeneration of hyaline-like cartilage.23 Sharma et al. used a light-mediated adhesive-hydrogel technology to enhance cartilage repair. Significant improvements in cartilage filling, as assessed by MRI imaging, and patient pain scores were observed when the adhesive-hydrogel biomaterial was used with microfracture compared with the use of microfracture alone.24 Moreover, many studies have demonstrated satisfactory cartilage repair using scaffolds to augment microfracture treatment in vivo. However, there have been no reports on the changes in regeneration tissues following microfracture in vitro under different culture conditions.
Microfracture is commonly used as a first-line option for cartilage regeneration. However, Buschmann et al. showed that the volume of the clot that is lost during clot retraction can be significant. It is possible that more than half of the initial volume may be lost through serum exudation during this contractile phase.25 In our study, the volume of cultivated tissues in each group were all reduced at 1 and 2 weeks, suggesting that clot retraction could play an important role in this process. The volume of the Group 1 cultures gradually shrank over time and finally disappeared after 8 weeks. We assumed that the degradation of certain components of the marrow clots may have resulted in the lack of a suitable microenvironment for the adhesion, proliferation, and secretion of ECM. Some studies have shown that TGF-β3 has significant effects on the chondrogenic differentiation of stem cells.18,19 Moreover, Thorpe et al. demonstrated that treatment of MSCs with TGF-β3 led to enhanced synthesis of type II collagen and GAG.26 Moioli and coworkers showed that TGF-β3 had an inhibitory effect on alkaline phosphatase activity and mineral deposition, which may help reduce the incidence of ectopic bone formation during chondrogenesis.27 Furthermore, Wang et al. reported that cartilage-like gene expression were either very low or undetectable when MSCs were cultured in monolayers with TGF-β3 for 3 weeks. On the contrary, the expression level of cartilage-specific genes were significantly upregulated in both 3D scaffold and 3D pellet, which were induced by TGF-β3, suggesting that a 3D microenvironment is required and fit for the chondrogenic differentiation of MSCs in vitro.28 For this reason, TGF-β3 was added into the culture medium in Group 2 to promote the chondrogenic differentiation of MSCs and the secretion of ECM. The volume of the cultures in Group 2 decreased over time as a result of serum exudation and insufficient support from components of the marrow clot. Nevertheless, a modest increase in volume was observed after 8 weeks, most likely caused by the synthesis and accumulation of ECM components such as GAG and type II collagen. This explanation also addresses why the compressive strength gradually increased in Group 2 over time. We also found that in the early stage of the culture, the viability of the cells in Groups 3 and 4 was higher than that in Groups 1 and 2. Moreover, greater volume was observed in Groups 3 and 4 compared with Groups 1 and 2 at various culture times. Group 3 was mechanically soft, and the volume of its cultures slightly decreased over time. However, one noticeable finding was that in Group 4, the volume of the cultured tissues did not shrink gradually. Rather, the volume significantly increased from week 4 onward, indicating that more ECM components were synthesized. Meanwhile, a smooth appearance and greater compressive strength were detected in Group 4.
In the present study, the newly synthesized ECM was gradually distributed from the periphery of the tissues to the entire samples in Groups 2 and 4. Dexheimer et al. reported that cells were gradually pushed apart from each other because of increasing matrix deposition during chondrogenic differentiation.29 This phenomenon was also observed in our research and may have been the cause of the volume increases observed in Groups 2 and 4 during the late culture stages. Furthermore, in Group 4, the thickness of the inner walls of the ECM scaffold appeared to decrease with culture time, indicating the biodegradation of the scaffold. In contrast, no obvious accumulation of ECM was observed in Groups 1 and 3 at the various times. The biochemical assays showed that Group 4 had more GAG and collagen content from week 4 onward compared with Group 2. These differences between Groups 2 and 4 may have produced the differences in the size and biomechanical strength of the cultivated tissues. Lefebvre et al. demonstrated that SOX9 activated the COL2 and ACAN genes in cultured cells, thus playing an essential role in chondrogenic differentiation.30 Herlofsen et al. reported that COL2, ACAN, and SOX9 were greatly upregulated during chondrogenic differentiation in vitro, whereas COL1 was gradually downregulated.31 In our study, the SOX9, ACAN, COL2, and COL1 genes were all gradually upregulated over time in Groups 2 and 4. At 8 weeks, the expression of SOX9, ACAN, and COL2 in Group 4 was significantly higher than that in Group 2. In contrast, the expression of COL1 in Group 4 was lower than that in Group 2. Moreover, the level of COL2 was significantly higher than that of COL1 at various times, especially at 4 and 8 weeks. These results suggest that more type II collagen was synthesized in Group 4 than in Group 2. This finding also explains why larger volumes and greater compressive strength were detected in Group 4.
There are several limitations to our study. The cultivation process in vitro was only observed for 8 weeks. Optimal or longer culture times will be needed to ensure chondrogenic differentiation in vitro. Additionally, Group 3 did not demonstrate satisfactory results in our research. Thus, further investigation is needed to develop potential protocols to achieve excellent chondrogenic effects, even without the use of growth factors. Because of the various differences between in vivo and in vitro models, future studies need to focus on the repair of articular cartilage in an in vivo animal model.
As a whole, our data demonstrated that a BMSC-dECM scaffold favors the chondrogenic differentiation of marrow clots following microfracture in vitro. To the best of our knowledge, this study is the first to describe the chondrogenesis process of marrow clots derived from microfracture in vitro, which is most similar to the repair of tissues in vivo. These results may provide the experimental basis for further research on BMSC-dECM and suggest that BMSC-dECM is a potential candidate for cartilage repair.
Acknowledgments
This study was financially supported by the National Natural Science Foundation of China (31070861) and the National Natural Science Foundation of China (81171745).
Disclosure Statement
No competing financial interests exist.
References
- 1.Steadman J.R., Rodkey W.G., and Rodrigo J.J.Microfracture: surgical technique and rehabilitation to treat chondral defects. Clin Orthop Relat Res 391,362, 2001 [DOI] [PubMed] [Google Scholar]
- 2.Magnuson P.B.The classic: joint debridement: surgical treatment of degenerative arthritis. Clin Orthop Relat Res 101,4, 1974 [PubMed] [Google Scholar]
- 3.Matsusue Y., Yamamuro T., and Hama H.Arthroscopic multiple osteochondral transplantation to the chondral defect in the knee associated with anterior cruciate ligament disruption. Arthroscopy 9,318, 1993 [DOI] [PubMed] [Google Scholar]
- 4.Peterson L., Menche D., Grande D., Klein M., Burmester G., Pugh J., and Pitman M.Chondrocyte transplantation—an experimental model in the rabbit. Trans Orthop Res Soc 9,218, 1984 [Google Scholar]
- 5.Kaul G., Cucchiarini M., Remberger K., Kohn D., and Madry H.Failed cartilage repair for early osteoarthritis defects: a biochemical, histological and immunohistochemical analysis of the repair tissue after treatment with marrow-stimulation techniques. Knee Surg Sports Traumatol Arthrosc 20,2315, 2012 [DOI] [PubMed] [Google Scholar]
- 6.Rodríguez-Merchán E.C.The treatment of cartilage defects in the knee joint: microfracture, mosaicplasty, and autologouschondrocyte implantation. Am J Orthop (Belle Mead NJ) 41,236, 2012 [PubMed] [Google Scholar]
- 7.Bhosale A.M., and Richardson J.B.Articular cartilage: structure, injuries and review of management. Br Med Bull 87,77, 2008 [DOI] [PubMed] [Google Scholar]
- 8.Erggelet C., Endres M., Neumann K., Morawietz L., Ringe J., Haberstroh K., Sittinger M., and Kaps C.Formation of cartilage repair tissue in articular cartilage defects pretreated with microfracture and covered with cell-free polymer-based implants. J Orthop Res 27,1353, 2009 [DOI] [PubMed] [Google Scholar]
- 9.Christensen B.B., Foldager C.B., Hansen O.M., Kristiansen A.A., Le D.Q., Nielsen A.D., Nygaard J.V., Bünger C.E., and Lind M.A novel nano-structured porous polycaprolactone scaffold improves hyaline cartilage repair in a rabbit model compared to a collagen type I/III scaffold: in vitro and in vivo studies. Knee Surg Sports Traumatol Arthrosc 20,1192, 2012 [DOI] [PubMed] [Google Scholar]
- 10.Hoemann C.D., Hurtig M., Rossomacha E., Sun J., Chevrier A., Shive M.S., and Buschmann M.D.Chitosan-glycerol phosphate/blood implants improve hyaline cartilage repair in ovine microfracture defects. J Bone Joint Surg Am 87,2671, 2005 [DOI] [PubMed] [Google Scholar]
- 11.Kang S.W., Bada L.P., Kang C.S., Lee J.S., Kim C.H., Park J.H., and Kim B.S.Articular cartilage regeneration with microfracture and hyaluronic acid. Biotechnol Lett 30,435, 2008 [DOI] [PubMed] [Google Scholar]
- 12.Milano G., Sanna Passino E., Deriu L., Careddu G., Manunta L., Manunta A., Saccomanno M.F., and Fabbriciani C.The effect of platelet rich plasma combined with microfractures on the treatment of chondral defects: an experimental study in a sheep model. Osteoarthritis Cartilage 18,971, 2010 [DOI] [PubMed] [Google Scholar]
- 13.LeBaron R.G., and Athanasiou K.A.Extracellular matrix cell adhesion peptides: functional applications in orthopedic materials. Tissue Eng 6,85, 2000 [DOI] [PubMed] [Google Scholar]
- 14.Brown B.N., Barnes C.A., Kasick R.T., Michel R., Gilbert T.W., Beer-Stolz D., Castner D.G., Ratner B.D., and Badylak S.F.Surface characterization of extracellular matrix scaffolds. Biomaterials 31,428, 2010 [DOI] [PMC free article] [PubMed] [Google Scholar]
- 15.Jin C.Z., Park S.R., Choi B.H., Park K., and Min B.H.In vivo cartilage tissue engineering using a cell-derived extracellular matrix scaffold. Artif Organs 31,183, 2007 [DOI] [PubMed] [Google Scholar]
- 16.Jin C.Z., Choi B.H., Park S.R., and Min B.H.Cartilage engineering using cell-derived extracellular matrix scaffold in vitro. J Biomed Mater Res A 92,1567, 2010 [DOI] [PubMed] [Google Scholar]
- 17.Jin C.Z., Cho J.H., Choi B.H., Wang L.M., Kim M.S., Park S.R., Yoon J.H., Oh H.J., and Min B.H.The maturity of tissue-engineered cartilage in vitro affects the repairability for osteochondral defect. Tissue Eng Part A 17,3057, 2011 [DOI] [PMC free article] [PubMed] [Google Scholar]
- 18.Barry F., Boynton R.E., Liu B., and Murphy J.M.Chondrogenic differentiation of mesenchymal stem cells from bone marrow: differentiation-dependent gene expression of matrix components. Exp Cell Res 268,189, 2001 [DOI] [PubMed] [Google Scholar]
- 19.Tang QO, Shakib K, Heliotis M, Tsiridis E, Mantalaris A, Ripamonti U, and Tsiridis E.TGF-β3: a potential biological therapy for enhancing chondrogenesis. Expert Opin Biol Ther 9,689, 2009 [DOI] [PubMed] [Google Scholar]
- 20.Lu H., Hoshiba T., Kawazoe N., and Chen G.Autologous extracellular matrix scaffolds for tissue engineering. Biomaterials 32,2489, 2011 [DOI] [PubMed] [Google Scholar]
- 21.Lu H., Hoshiba T., Kawazoe N., Koda I., Song M., and Chen G.Cultured cell-derived extracellular matrix scaffolds for tissue engineering. Biomaterials 32,9658, 2011 [DOI] [PubMed] [Google Scholar]
- 22.Discher D.E., Mooney D.J., and Zandstra P.W.Growth factors, matrices, and forces combine and control stem cells. Science 324,1673, 2009 [DOI] [PMC free article] [PubMed] [Google Scholar]
- 23.Yang H.S., La W.G., Bhang S.H., Kim H.J., Im G.I., Lee H., Park J.H., and Kim B.S.Hyaline cartilage regeneration by combined therapy of microfracture and long-term bone morphogenetic protein-2delivery. Tissue Eng Part A 17,1809, 2011 [DOI] [PubMed] [Google Scholar]
- 24.Sharma B., Fermanian S., Gibson M., Unterman S., Herzka D.A., Cascio B., Coburn J., Hui A.Y., Marcus N., Gold G.E., and Elisseeff J.H.Human cartilage repair with a photoreactive adhesive-hydrogel composite. Sci Transl Med 5,167, 2013 [DOI] [PMC free article] [PubMed] [Google Scholar]
- 25.Buschmann M.D., Hoemann C.D., Hurtig M.B., and Shive M.S.Cartilage repair with chitosan-glycerol phosphate-stabilized blood clots. In: Williams R.J., ed. Cartilage Repair Strategies. Totowa, NJ: Humana Press, Inc., 2007, pp. 85–104 [Google Scholar]
- 26.Thorpe S.D., Buckley C.T., Vinardell T., O'Brien F.J., Campbell V.A., and Kelly D.J.The response of bone marrow-derived mesenchymal stem cells to dynamic compression following TGF-beta3 induced chondrogenic differentiation. Ann Biomed Eng 38,2896, 2010 [DOI] [PubMed] [Google Scholar]
- 27.Moioli E.K., Hong L., and Mao J.J.Inhibition of osteogenic differentiation of human mesenchymal stem cells. Wound Repair Regen 15,413, 2007 [DOI] [PMC free article] [PubMed] [Google Scholar]
- 28.Wang Y., Kim U.J., Blasioli D.J., Kim H.J., and Kaplan D.L.In vitro cartilage tissue engineering with 3D porous aqueous-derived silk scaffolds and mesenchymal stem cells. Biomaterials 26,7082, 2005 [DOI] [PubMed] [Google Scholar]
- 29.Dexheimer V., Frank S., and Richter W.Proliferation as a requirement for in vitro chondrogenesis of human mesenchymal stem cells. Stem Cells Dev 21,2160, 2012 [DOI] [PMC free article] [PubMed] [Google Scholar]
- 30.Lefebvre V., Behringer R.R., and de Crombrugghe B.L-Sox5, Sox6 and Sox9 control essential steps of the chondrocyte differentiation pathway. Osteoarthritis Cartilage 9,69, 2001 [DOI] [PubMed] [Google Scholar]
- 31.Herlofsen S.R., Küchler A.M., Melvik J.E., and Brinchmann J.E.Chondrogenic differentiation of human bone marrow-derived mesenchymal stem cells in self-gelling alginatediscs reveals novel chondrogenic signature gene clusters. Tissue Eng Part A 17,1003, 2011 [DOI] [PMC free article] [PubMed] [Google Scholar]