

SUMMARY
Allele-specific PCR (ASPCR) is a highly sensitive, and reproducible method for the study of minor HIV-1 variants harboring resistance mutations and is significantly less labor-intensive and time-consuming than other techniques used for similar purposes. Furthermore, ASPCR has multiple applications in HIV research: it provides earlier and more sensitive detection of evolving resistance mutations, a more accurate assessment of transmitted drug-resistant mutants and a better evaluation of resistance selection after post-exposure or mother-to-child-transmission prophylaxis programs. This article outline the principles of ASPCR and illustrates technical challenges in the design and application of ASPCR protocols by describing ASPCR assays developed for detecting resistance mutations in the protease (PR)- and reverse transcriptase (RT)–coding regions of pol and env. The assays achieved sensitivities of <1% for the D30N mutation in HIV-1 PR, M184V and I mutations in RT, and V38A in gp41. This method can be easily adapted to the quantitative detection of other mutations in HIV-1 or other viruses by introducing minor modifications to the methods described. In addition, ASPCR can be used to assess the dynamics of mutant populations in the viral quasispecies in response to changing selection pressures, allowing inferences on viral fitness in vivo through mathematical modeling.
Keywords: HIV-1, Antiretroviral Drug Resistance, Allele-Specific PCR, Real-time PCR, Minority Variants, Quasispecies
1. INTRODUCTION
Accurate detection of resistance mutations is important for the clinical management of HIV-infected persons and has important public health implications. (Johnson et al., 2005; Wensing et al., 2005) Antiretroviral drug resistance is associated with worse virological, immunological and clinical outcomes. (Boucher et al., 1992; Harrigan et al., 1999; Japour et al., 1995; Middleton et al., 2001; Ross et al., 2001) Conversely, use of resistance information for the design of treatment combinations significantly improves such outcomes. (Baxter et al., 2000; Cingolani et al., 2002; Cohen et al., 2002; Durant et al., 1999; Haubrich et al., 2005; Meynard et al., 2002; Tural et al., 2002)
As with other RNA viruses, (Cristina, 2005; Gonzalez-Lopez et al., 2005; Jerzak et al., 2005) the HIV population in an infected person constitutes a quasispecies (Coffin, 1995; Domingo and Holland, 1997). Standard genotypic tests only detect resistance mutations present in more than 20% of the viral population, (Brun-Vezinet et al., 2004; Grant et al., 2003; Halvas et al., 2006) likely underestimating the prevalence of drug resistance mutations at any given time point. Genotypic resistance tests performed by reference laboratories generally rely on population-based sequencing and report the consensus sequence at each nucleotide position. Although these tests can detect the presence of mixed populations, they provide only a rough estimate of the relative proportions of wild-type and mutant species in the population. Mathematical models estimate significant delays between the emergence of resistance and its detection partly because of the low sensitivity of current genotyping methods (D’Amato et al., 1998). More sensitive techniques to assess drug resistance in minor variants have been developed in the recent years, including single-genome sequencing, (Palmer et al., 2005) allele-specific PCR (ASPCR), (Bergroth et al., 2005; Metzner et al., 2003; Metzner et al., 2005) hybridization assays, (Flys et al., 2005; Shi et al., 2004) phenotypic analysis using S. cerevisiae (Nissley et al., 2005; Shi et al., 2004) and massively-parallel sequencing in microfabricated PicoTiterPlates (Leamon et al., 2003; Margulies et al., 2005).
The first use of allele-specific nested PCR (ASPCR) to detect resistance mutations in HIV-1 was reported in 1991. (Larder et al., 1991) The more recent application of real-time PCR technology to ASPCR has increased the sensitivity of this technique several-fold and permitted quantification of the PCR products. (Metzner et al., 2003; Metzner et al., 2005)
Here, an ASPCR protocol to detect resistance mutations in HIV-1 pol and in the gp41-coding region of env with high sensitivity, accuracy and reproducibility is described. The theoretical reasoning that supports this method is discussed and some practical guidance is offered to researchers interested in applying this technique to the detection of these and other mutations in HIV-1 and other viruses.
2. MATERIALS AND METHODS
2.1. Primers and probes
The design of all PCR primers and probes (Table 1) was based on the HIV-1Hxb2 pol and env sequences.
Table 1.
Oligonucleotide sequences of RT-PCR, ASPCR and TaqMan Probesa
| Primer Name | Length (bp) | Tm (°C) | Sequence (5′ −3) | Nucleotide Position (HXB2) | ||
|---|---|---|---|---|---|---|
|
|
||||||
| M184V ASPCR Assay | ||||||
| RT-PCR | OOPF | 22 | 64 | GAAGCAGGAGCCGATAGACAAG | 2211–2232 | |
| OOR2 | 23 | 63 | TTTTCTGCCAGTTCTAGCTCTGC | 3466–3444 | ||
| ASPCR | (NS) | VN | 21 | 52 | GACATAGTTATCTATCAATAC | 3078–3098 |
| (Sp) | V4 | 22 | 55 | GACATAGTTATCTATCAATICG* | 3078–3099 | |
| (R) | ASR2 | 20 | 56 | GGCTGTACTGTCCATTTATC | 3277–3258 | |
| M184I ASPCR Assay | ||||||
| RT-PCR | OOPF | 22 | 64 | GAAGCAGGAGCCGATAGACAAG | 2211–2232 | |
| OOR2 | 23 | 63 | TTTTCTGCCAGTTCTAGCTCTGC | 3466–3444 | ||
| ASPCR | (NS) | IN | 23 | 54 | GACATAGTTATCTATCAATACAT | 3078–3100 |
| (Sp) | I5 | 24 | 57 | GACATAGTTATCTATCAATACAIA* | 3078–3101 | |
| (R) | ASR2 | 20 | 56 | GGCTGTACTGTCCATTTATC | 3277–3258 | |
| D30N ASPCR Assay | ||||||
| RT-PCR | OOPF | 22 | 64 | GAAGCAGGAGCCGATAGACAAG | 2211–2232 | |
| OOR2 | 23 | 63 | TTTTCTGCCAGTTCTAGCTCTGC | 3466–3444 | ||
| ASPCR | (NS) | DN | 21 | 55 | CTATTAGATACAGGAGCAGAT | 2319–2339 |
| (Sp) | DS4 | 22 | 55 | CTATTAGATACAGGAGCAAATA* | 2319–2340 | |
| (R) | DR2 | 20 | 56 | CTGGCTTTAATTTTACTGGTAC | 2592–2571 | |
| V38A ASPCR Assay | ||||||
| RT-PCR | GP41OF | 24 | 62 | GAGGGACAATTGGAGAAGTGAATT | 7649–7672 | |
| GP41OR | 24 | 62 | GTGAATATCCCTGCCTAACTCTAT | 8364–8341 | ||
| ASPCR | (NS) | IFN8 | 21 | 53 | GACAATTATTGTCTGGTATAG | 7849–7869 |
| (Sp) | IFS3C2 | 22 | 58 | GACAATTATTGTCTGGTATCGC* | 7849–7870 | |
| (R) | IR4 | 18 | 56 | AATCCCCAGGAGCTGTTG | 8009–7992 | |
| TaqMan Probe | V38Probe | 27 | 68 | (6-FAM)-TCCTTTAGGTATCTTTCCACAGCCAGG-(TAMRA)(phosphate) | 7990–7964 | |
The target mutation is shown in boldface, underlined and next to an asterisk. Intentional mismatches in mutant-specific primers are shown in boldface italics and underlined. ASPCR means allele-specific polymerase chain reaction. RT-PCR means one-step reverse transcription and PCR amplification. NS means non-specific primer. Sp means specific primer. R means reverse (antiparallel) primer.
2.2. Construction of standards
Plasmids carrying wild-type HIV-1 pol and env were constructed by cloning the relevant segments of HIV-1 NL4-3 into a pGEM® T-Easy vector (pGEM® T-Easy Vector System, Promega Corporation, Madison, WI, USA) to create pPOL-W and pENV-W, respectively. For pPOL-W, the insert corresponded to a 1256-base pair amplicon obtained with primers OOPF and OOR2 (Table 1); for pENV-W, the insert corresponded to a 715-base pair amplicon derived from the gp41-coding region of env, obtained with primers GP41OF and GP41OR.
The following mutations were introduced individually by site-directed mutagenesis (Quick Change® XL Site Directed Mutagenesis Kit, Stratagene, La Jolla, USA) into pPOL-W to generate three different single-mutant plasmids (Figure 1): M184V (ATG → GTG, [pPOL-184V]), M184I (ATG → ATA, [pPOL-184I]) and D30N (GAT → AAT, [pPOL-30N]). Likewise, a plasmid (pENV-38A) carrying the V38A (GTG → GCG) mutation was obtained by introducing this mutation into pENV-W. Presence of the appropriate mutations was confirmed by sequencing the resulting plasmids.
Figure 1. Overview of ASPCR primer design.
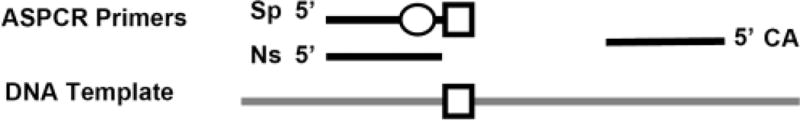
The mutant-specific primer (Sp) incorporates the target mutant sequence (square) in its 3′-end plus an intentional mismatch (circle) in the −1 to −3 position to increase the specificity of the mutant-specific amplification reaction (i.e. constraint the amplification of wild-type variants). The non-specific primer (NS) is identical to the Sp primer, except that ends right before the target codon and does not incorporate any intentional mismatch. Both specific and non-specific amplification reactions are performed in separate wells using a common antiparallel (CA) primer. Amplified DNA can be quantified in real-time using SYBR+™Green, a TaqMan™ Probe, molecular beacons or scorpions.
PCR products were purified (QIAquick® PCR Purification Kit, QIAGEN Sciences, Maryland, USA) and quantified by spectrophotometry. Equivalence between starting amounts of wild type and mutant plasmid DNA was verified by real-time PCR. Serial 10-fold dilutions of each amplicon were prepared ranging from 106 to 10 copies per reaction. Standards were always run in duplicate at the same time as test samples. Given that the non-selective amplification did not depend on the nucleotide composition of the target codon, only mutant amplicons were used to generate both specific and nonspecific standards curves for clinical specimen analysis. This ensured identical starting DNA copies for both standard reactions and enabled parallel, comparable curves. Wild type amplicons were used to prepare mixtures with mutant amplicons in order to test the properties of the technique.
2.3. HIV-1 RNA extraction from plasma
Plasma samples were obtained from subjects participating in clinical trials of antiretroviral therapy approved by the respective human subjects research committees, and were stored at −70°C. HIV-1 RNA was extracted from EDTA-anticoagulated plasma using the QIAamp® Viral RNA MiniKit (QIAGEN Sciences, Maryland, USA) according to the manufacturer’s instructions. Part of each RNA sample was used for cDNA synthesis immediately after extraction, and the remainder was stored at −80°C.
2.4. Reverse transcription and first-round DNA amplification
The extracted RNA was transcribed to cDNA and amplified by PCR in a one-step process (Superscript III One-step RT-PCR with Platinum Taq Kit, Invitrogen™, Carlsbad, CA, USA) following the manufacturer’s instructions. Pol and env fragments were amplified separately. Cycling conditions for pol-derived DNA included an initial cDNA synthesis step at 55°C during 25 min, followed by a denaturation step at 94°C during 2 min, 25 cycles of PCR amplification (94°C during 40 sec, 60°C during 40 sec, 68°C during 1 min and 20 sec), and a final 5 min extension step at 68°C. The PCR mix contained 25 μL of 2X Reaction Mix (including 0.4 mmol/L of each dNTP and 3.2 mmol/L of MgCl2), 0.2 mmol/L of each primer OOPF and OOR2, 15 μL of extracted RNA as template and nuclease-free H2O to a final volume of 50 μL. The same PCR mix was used for the env-derived DNA but with primers GP41OF and GP41OR. Thermal cycling conditions for env-derived DNA included 55°C for 25 min, followed by a denaturation step at 94°C for 2 min, 20 cycles of PCR amplification (94°C for 15 sec, 50°C for 30 sec, 68°C for 1 min), and a final 5 min extension step at 68°C. The PCR products were purified using the QIAquick® PCR Purification Kit (QIAquick® PCR Purification Kit, QIAGEN Sciences, Maryland, USA).
2.5. Quantification of viral populations using Real-Time PCR
Different fluorescence reporter molecules were used for each protocol, SYBRgreen for pol-derived samples and a TaqMan probe for env-derived samples, in order to illustrate different approaches to ASPCR design. To quantify the proportion of mutant sequences contained within each specimen, 5 μL of RT-PCR product were added to the real-time PCR together with selective or nonselective primers. Conditions for nonselective amplification of env-derived samples were 1×TaqMan® PCR Master Mix™ (Applied Biosystems, Warrington, UK), 1 μM of each primer IFN8 and IR4 (Figure 1, Table 1), 500 nM of V38A TaqMan® Probe, and deionized water to a final volume of 50 μL. Conditions for selective amplification of the V38A mutant sequence were identical except that primer IFN8 was replaced by IFS3C2. Conditions for nonselective amplification of pol-derived samples were 1×SYBR® green PCR Master Mix™ (Applied Biosystems, Warrington, UK), 900 nM of each non-specific and reverse primers, and deionized water to a final volume of 50 μL. Conditions for selective amplification of pol mutant sequences were identical except that the specific primer replaced the non-specific primer. Non-specific primers for the D30N, M184V and M184I ASPCR protocols were primers DN, VN and IN, respectively (Figure 1, Table 1). Specific primers for the D30N, M184V and M184I ASPCR reactions were, respectively, primers DS4, V4, and I5. Reverse primers for D30N and M184V/I ASPCR experiments were, respectively, primers DR2 and ASR2.
Each sample was evaluated by real-time PCR in an ABI 7000 Sequence Detection System thermocycler (Perkin Elmer Applied Biosystems, Foster City, CA, USA), using the following cycling parameters: 50°C for 2 min to activate the AmpErase® UNG included in the mastermix which prevents PCR product carryover, 95°C for 10 min to activate the AmpliTaq Gold® DNA Polymerase, followed by 50 cycles at 95°C for 15s and 50°C for 1 min. Amplicons prepared from the relevant plasmids using primers OOPF and OOR2, or GP41OF and GP41OR served as standards. The number of cycles required to reach threshold fluorescence (Ct) was determined and the quantity of sequences initially present calculated by interpolation onto the standard curve.
The three different ASPCR protocols (D30N, M184V/I and V38A) were performed separately, each with a corresponding set of standards. Nonselective and selective amplifications were always performed in parallel. All reactions were performed in duplicate, and the mean of the two values was used for calculation. The percentage of viral sequences containing each mutation was calculated as follows: % mutant sequences = [(quantity of mutant sequences in the sample)/(quantity of total viral sequences in the sample)] × 100.
3. RESULTS
3.1. Standard Curves and amplification efficiency
For each set of specific and non-specific primers, Ct was linearly correlated with input DNA copy number over the range of 101 – 106 copies (Figure 2). The specific (Sp) and non-specific (NS) amplification efficiencies (defined as: E=10(−1/slope)) were comparable within each ASPCR set. Correlation coefficients (r2) were higher than 99.6 % for all primer pairs on their respective target standards.
Figure 2. Mutant-specific (Sp, solid symbols) and non-specific (NS, open symbols) standard curves of M184V, M184I, D30N and V38A-allele-specific real-time PCR assays.

Specific and NS regression lines, defined as: y= slope*x + b, where b is the y-intercept, were derived from each standard dilution set. In clinical samples, Sp and NS input copy numbers were determined using this formula by interpolation of the Cts (x) into the corresponding standard curve. Correlation coefficients (r2) were higher than 99.6% in all cases.
3.2. Allelic discrimination
Allelic discrimination of mutant-specific primers was tested by determining the difference in Ct values (ΔCt) when identical amounts of mutant and wild-type DNA were amplified with the corresponding mutant-specific primer set (Figure 3, Panels A–D). Each experiment was conducted in triplicate; data shown represent the mean ± SD. The fold-decrease in amplification efficiency (AE) was derived from ΔCt. For the M184V-specific primer, ΔCt between the amplification of M184V and wild type or M184I was 10 (>700-fold decrease in AE for WT) and 11 (>750-fold decrease in AE for M184I), respectively. For the M184I-specific primer, the ΔCt between M184I and wild type was 12 (>2100-fold decrease in AE for M184V), whereas the ΔCt between M184I and M184V was 20 (>200,000-fold decrease in AE for WT). Similarly, the ΔCt for D30N versus WT was 12 (>5400-fold decrease in AE for WT); the ΔCt for V38A versus WT was also 12 (>4,000-fold decrease in AE for WT).
Figure 3. Allelic discrimination of M184V, M184I, D30N and V38A ASPCR assays.

Panels A–D: Identical amounts of mutant and wild-type DNA were amplified with the corresponding mutant-specific primer set [i.e. M184V (Panel A), M184I (Panel B), D30N (Panel C) and V38A (Panel D)]. ΔCt was >10 in all 4 assays. Panels E–H: The addition of 105 copies of a non-complementary allele (WT in all assays and M184I and M184V in M184V and M184I ASPCR assays, respectively) to each 10-fold dilution of the mutant standard did not significantly alter the standard curve until the mutant DNA was present at ≤103 copies. This illustrates that the discriminatory ability remained unaltered until the standard containing the target mutation was ≤0.1% of the total standard copies [e.g. (103 copies of M184V) / (103 copies of M184V + 105 copies of M184I) × 100]. Values in panels E–H correspond to the mean ± SD of triplicate measurements.
In a second experiment (Figure 3, Panels E–H), the discriminatory ability of each assay was tested in mixing experiments by adding 105 copies of wild-type DNA to serial dilutions (106−101 copies) of mutant DNA. The threshold cycle was compared to PCRs performed without the addition of wild-type DNA. In each case, Ct was linearly correlated to input copy number over a range of mutant/wild-type ratios until the mutant DNA was present at 0.1% or less of total DNA copies.
3.3. Sensitivity
The sensitivity of each ASPCR assay was defined as the mean plus 3 standard deviations (SD) above the copy number determined on wild-type template with mutant-selective primer in 12 to 15 independent determinations. The sensitivity of the ASPCR assays was 0.4% for M184V, 0.04 % for M184I, 0.1% for D30N and 0.8% for V38A.
3.4. Accuracy
Serial 10-fold dilutions of mutant amplicons were prepared in a background of WT amplicons and measured with the corresponding ASPCR assay (Figure 4). Measurements were accurate down to 1% (M184V), 0.1% (M184I), 0.1% (D30N), and 1% (V38A) in the various ASPCR assays, respectively. Measurements between these points and the limit of detection of each assay (e.g. between 1% and 0.4% in the M184V assay) tended to slightly overestimate the actual proportion of mutant variants.
Figure 4. Sensitivity and accuracy of M184V, M184I, D30N and V38A ASPCR assays.

The sensitivity of each assay was calculated as the mean plus 3 standard deviations of 12 to 15 replicate measurements of wild-type amplicons (negative controls) obtained from recombinant viral constructs. Accuracy was evaluated by measuring serial dilutions of mutant amplicons in a background of wild-type amplicons. The nominal proportion of mutants ranged from 100% to 0.01% or 0.001% mutants. The proportion of mutants was measured as: 100×(DNA copy number obtained by mutant-specific amplification)/(DNA copy number obtained by non-specific amplification). Horizontal solid line: mean proportion of 12 to 15 replicate measurements of wild-type amplicons. Horizontal dashed line: Limit of detection (attributed sensitivity) of the assay. Diagonal dashed line: theoretical perfect match between nominal and observed proportions.
3.5. Reproducibility
The coefficients of variation (CV) for quantifying samples with proportions of mutant DNA ranging from 100% to 1% of the population were measured in order to assess the reproducibility of the assay. Intra-assay variation was determined by triplicate determinations of each mixture containing a given proportion of mutant and wild-type sequences. The CVs were below 0.40 for each proportion analyzed, being lower than 0.20 for the nominal mutant proportions of 100% and 10%. Inter-assay variation was assessed by testing three different aliquots of each prepared mixture in three independent assays performed on different days. Results of different runs revealed CVs of around 0.20 for nominal mutant proportions of 100%, and around 0.60 for nominal proportions of 1% (Table 2)
Table 2.
Intra-assay and inter-assay coefficients of variation (CVs)
| CV Intra-assay | CV Inter-assay | |||||||
|---|---|---|---|---|---|---|---|---|
|
| ||||||||
| Nominal mutant Proportion | M184V | M184I | D30N | V38A | M184V | M184I | D30N | V38A |
|
|
||||||||
| 100 % | 0.14 | 0.01 | 0.19 | 0.06 | 0.21 | 0.23 | 0.14 | 0.13 |
| 10 % | 0.11 | 0.08 | 0.14 | 0.17 | 0.13 | 0.06 | 0.40 | 0.49 |
| 1 % | 0.18 | 0.09 | 0.39 | 0.21 | 0.60 | 0.11 | 0.64 | 0.50 |
3.6. Clinical negative controls
Stored plasma specimens from 6 different HIV-1-infected patients obtained in 1991 were tested for the presence of M184V/I and D30N mutations. Because neither lamivudine nor nelfinavir were approved for use at that time, the subjects studied should not have been exposed to these drugs. Population-based sequencing of these specimens demonstrated a wild type allele at both codons. Allele-specific PCR yielded M184V and D30N proportions below the limit of detection in all 6 specimens (data not shown). Of note, three of six specimens showed proportions of the M184I mutant that were slightly above the limit of detection (0.05% to 0.07%), suggesting that M184I mutants may have been present at very low levels in the virus populations of these subjects before any lamivudine exposure.
Plasma samples from 6 additional patients were tested as negative controls for V38A in env. These were six antiretroviral therapy-experienced but enfuvirtide-naïve patients with multidrug-resistant HIV-1 infection, but no evidence of enfuvirtide resistance by standard sequencing at the time of specimen sampling. In all six cases, the proportion of V38A mutations by ASPCR was below the limit of detection of the assay (data not shown).
3.7. Mutant dynamics in clinical samples
The ability of ASPCR to characterize the dynamics of mutants in vivo was investigated by measuring the proportion of M184V/I variants in serial plasma specimens from 4 subjects with multidrug resistant HIV-1 (MDR HIV) who selectively interrupted lamivudine therapy. (Campbell et al., 2005) Allele-specific PCR measurements were compared to genotypic data obtained at each time point by standard techniques (Figure 5).
Figure 5. M184V and/or M184I decay and subsequent re-selection among subjects with MDR HIV infection undergoing a transient interruption of lamivudine therapy: assessment by allele-specific PCR (ASPCR) and standard genotype (SG).

Four individuals infected with MDR HIV including the M184V mutation while on highly active antiretroviral therapy, transiently interrupted lamivudine therapy and continued the remaining antiretrovirals. The proportion of viral variants with the M184V or M184I mutations was investigated in serial samples before, during and after the lamivudine interruption period. Vertical shaded areas indicate periods “on” lamivudine; non-shaded areas indicate periods “off” lamivudine. Open squares: proportion of variants with the M184V mutation. Open circles: proportion of variants with the M184I mutation. Triangles: plasma HIV-1 RNA levels. Horizontal dashed line (----): Threshold of detection for M184V variants (0.4%). Horizontal dotted line (.....):Threshold of detection for M184I variants (0.04%). Standard genotypic data indicating the consensus sequence at codon 184 of the reverse transcriptase are annotated next to the corresponding M184V ASPCR results. No annotation indicates detection of M184V; “V / M” indicates the presence of M184V and WT variants; “WT” indicates detection of a wild-type sequence by standard genotype.
Allele-specific PCR measurements were concordant with the results of standard genotyping. As expected, M184V variants were predominant in patients 1, 2 and 3 before lamivudine interruption. In contrast, the proportion of M184V mutants was only slightly higher than 20% in Patient 4. Preinterruption levels of M184V variants remained stable during 6 to 8 weeks and decayed thereafter. Resumption of lamivudine therapy was associated with a rapid rebound of M184V variants. Samples with 10%–20% mutant sequences by ASPCR were consistently reported as mixtures of 184V and 184M by standard genotyping, whereas samples with less than 10% mutant were consistently negative.
Resumption of lamivudine treatment was consistently associated with the transient detection of M184I variants at very low levels (≤ 0.1%). Such transient increases were associated with parallel increases in the proportion of M184V variants in patients 1, 3 and 4 but not in patient 2. As well, M184I increments were associated with increases in HIV-1 RNA load in patients 2 and 3, but with HIV-1 RNA decreases in patients 1 and 4.
3.8. Effect of polymorphisms at primer sites on the accuracy of ASPCR
To investigate the influence of genetic polymorphisms at primer sites on the accuracy of ASPCR measurements, 12 clonal pol sequences were obtained per patient (HXB2 positions: 2218–3457) before lamivudine interruption. (Table 4) As expected, all clones exhibited an I→A mismatch in the −2 position relative to the 3′ end of the M184V-specific primer. The M184V mutation was present in all but one of 12 clones (92%) from the baseline sample of Patient 3. The existence of 1 or 2 polymorphisms near the 5′ end of the discriminative primer set did not have a major impact on ASPCR measurements in Patients 1, 2 and 3. However, presence of an A→G mismatch at the −4 position relative to the 3′ end of the M184V-specific primer was associated with an underestimation of the proportion of M184V variants by ASPCR in Patient 4 (Table 3, Figure 6). The incorporation of the A→ G mismatch in both specific (V4) and non-specific (NS) primers increased the accuracy of the pre-interruption values and subsequent measurements proportionally (Figure 6). Importantly, this mismatch also had to be incorporated into the standards. Otherwise, the amplification of standards lacking the mismatch using primers with the mismatch resulted in a decrease in the specific amplification of standards (not shown) and, therefore, an overestimation of the proportion of mutants.
Table 4.
Minimum HIV-1 RNA load needed to detect minor variants at a frequency (λ) of 0.1%, 1%, and 10%, assuming that the RNA is extracted from 1 mL of plasma.a
| Variant Frequency (λ) | Number of RNA molecules to be tested, according to the Poisson distribution (P>99%) | Fraction of elution volume used for cDNA synthesis (fe) | Minimum HIV-1 RNA load (copies/mL) |
|---|---|---|---|
| 0.1% | 5000 | 0.25 | 29 762 |
| 0.5 | 14 881 | ||
| 1 | 7 440 | ||
| 1% | 500 | 0.25 | 2 976 |
| 0.5 | 1 488 | ||
| 1 | 744 | ||
| 10% | 50 | 0.25 | 298 |
| 0.5 | 148 | ||
| 1 | 74 |
Calculations were derived from the formula: pVL= NRNA(λ) / (V × fe × ERNAX× EcDNA), where pVL is the plasma HIV-1 RNA copy number; NRNA(λ) is the number of RNA copies that need to be tested according to the Poisson distribution to detect at least 1 variant with a probability > 99% if this variant is present at a frequency λ; V is the volume of plasma used for the RNA extraction in milliliters; fe is the fraction of the RNA elution volume used for cDNA synthesis; ERNAX is the efficiency of the RNA extraction process ; and EcDNA is the efficiency of the cDNA synthesis.
HIV-1 RNA values were estimated using the following assumptions: V=1 mL, ERNAX=0.96 and EcDNA= 0.7, based on http://www1.qiagen.com/literature/qiagennews/0398/983hiv1.pdf and http://omrf.ouhsc.edu/~frank/CDNA.html. Importantly, ERNAX and particularly EcDNA are subject to significant variation in different conditions, and may need to be determined empirically. Therefore, HIV-1 RNA values would need to be adjusted if different plasma volumes were used for the RNA extraction or if ERNAX or EcDNA were different.
Note that the volume of plasma required for RNA extraction in order to detect a variant with frequency λ can be easily calculated as: V = NRNA(λ) / (p VL × fe × ERNAX× EcDNA).
Table 3.
Clonal sequences at primer sites a
| Sequences at discriminative forward prime rs site (5′ − 3′) | Sequences at common reverse prime r site (5′ − 3′) | ||
|---|---|---|---|
| Primer V4b (M184V-specific) | GACATAGTTATCTATCAATICG* | Primer ASR2 (common reverse primer) | GGCTGTACTGTCCATTTATC |
| Primer VNc (non-specific) | ...................A. | ||
| Laboratory reference strains | |||
| HXB2 | ...................A.A | .................... | |
| pNL4.3 | ........C..........A.A | .................... | |
| Patient 1 clones | |||
| 10/12 | ......A.C..........A.. | .................... | |
| 1/12 | ......A.C..........A.. | .C.................. | |
| 1/12 | ......A.C..........A.. | ...................T | |
| Patient 2 clones | |||
| 2/12 | ......A.C..........A.. | ..T................. | |
| 2/12 | ...................A.. | ..T................. | |
| 2/12 | ...................A.. | .................... | |
| 2/12 | ......A............A.. | .................... | |
| 1/12 | ......A............A.. | .................G.. | |
| 1/12 | ........C..........A.. | .................... | |
| 1/12 | .....G.............A.. | .................... | |
| 1/12 | ......A............A.. | ..T................. | |
| Patient 3 clones | |||
| 9/12 | ..GC...............A.. | .................... | |
| 2/12 | ..GC...............A.. | ..T................. | |
| 1/12 | ...C...............A.A | .................... | |
| Patient 4 clones | |||
| 12/12 | .................G.A.. | .................... | |
Amplicons encompassing the 2218–3457 positions relative to the HXB2 laboratory reference strain, were obtained from patient plasma specimens, PCR-purified (QIAquick® PCR Purification Kit, QIAGEN Sciences, Maryland, USA), and cloned into a pGEM® T-Easy Vector (pGEM® T-Easy Vector System, Promega Corporation, Madison, WI, USA), as directed by the manufacturer. Twelve clonal pol sequences were obtained per patient before lamivudine interruption. Here, clonal sequences at the site of the discriminative primer set (left) and at the site of the common reverse primer (right) are presented. Respectively, the M184V-specific primer (V4) sequence and the ASR2 primer sequence are used as the reference sequence for patients’ clones.
In the M184V-specific primer (V4), the target mutation is shown in boldface, underlined and next to an asterisk, while the intentional A→I mismatch in the −2 position of the 3′ end is shown in boldface, italics and underlined.
The non-specific (VN) primer is one base pair shorter than the M184V-specific primer (V4) and does not incorporate an intentional mismatch.
Figure 6. Effect of pre-existing polymorphisms on the accuracy of ASPCR measurements ‘in vivo’.

As shown in Table 4, 12/12 HIV-1 pol clones in patient 4 contained a pre-existing A→G polymorphism in the −4 position, relative to the 3′-end of the M184V-specific primer (V4). Vertical shaded areas indicate periods “on” lamivudine; non-shaded areas indicate periods “off” lamivudine. Open squares: proportion of variants with the M184V mutation. Horizontal dashed line (----): Threshold of detection for M184V variants (0.4%). Standard genotypic data indicating the consensus sequence at codon 184 of the reverse transcriptase are annotated next to the corresponding week. No annotation indicates detection of M184V; “V / M” indicates the presence of M184V and WT variants; “WT” indicates detection of a wild-type sequence by standard genotype.
4. DISCUSSION
The study of minor viral variants in HIV-1 infection is relevant to understanding the mechanisms of viral persistence, escape from pharmacologic and immunologic pressure, and coreceptor usage. Detection of drug-resistant minority variants may help predict virological failure in patients with HIV-1 that appears to be wild-type by standard sequencing methods. Among the several techniques available to study minor viral variants, (Bergroth et al., 2005; Leamon et al., 2003; Margulies et al., 2005; Metzner et al., 2003; Metzner et al., 2005; Palmer et al., 2005) ASPCR is one of the most sensitive, accurate and reproducible, being less expensive and time-consuming than single-genome sequencing or clonal sequence analysis. (Halvas et al., 2006) Due to its high throughput, this technique can also be used as a way to rapidly screen very large pooled populations.
This article presents a systematic evaluation of ASPCR assays targeted to four important drug resistance mutations in RT (M184V and I), PR (D30N), and env (V38A in gp41). Each assay could detect the presence of mutant species with a limit of detection of <1%, but assays for certain mutant codons were more sensitive than others. Sensitivity was directly proportional to the discrimination ability of the primers, which was, in turn, strongly influenced by the particular base sequence of the codon being interrogated. For example, the M184I-specific primer was better able to discriminate M184I (ATA) from WT (ATG) and M184V (GTG) than was the M184V-specific primer.
A number of factors, however, were important to enable adequate performance of the assay, both in laboratory constructs and in clinical specimens. To ensure equal amplification efficiencies, both the specific and non-specific primers should anneal to the same DNA region. ASPCR assays using Sp and NS primers that annealed to different sites yielded inaccurate results, often overestimating the proportion of mutants (not shown). In this study, the NS primer was identical to the Sp except that it ended one base pair before the target locus and did not incorporate intentional mismatches. The antiparallel primer was common to both primer pairs. To maximize the discrimination ability of the assay, it was also important to use relatively short primers. Because the cycling conditions were the same for all four ASPCR sets, several assays could be run at the same time, increasing overall efficiency.
Based on a modification of the amplification refractory mutation system (ARMS) (Newton et al., 1989), the Sp primer in this assay contained the target nucleotide substitution at its 3′ end plus an intentional nucleotide mismatch at positions −1 to −3 from the 3′ end to increase its specificity for the target mutation. (Metzner et al., 2003; Newton et al., 1989) When several different nucleotide substitutions within a codon can give rise to the same mutation, it may be necessary to use degenerate Sp primers (e.g. K103N in RT). (Loubser et al., 2006) Annealing temperature (Ta) adjustments including primer dissociation curves were also important to attain optimal discrimination and lack of non-specific amplification. In general, the Ta should be as high as possible for each given primer set without compromising the amplification efficacy of the real-time PCR reactions. The optimal Ta could be determined empirically by repeating the experiments shown in Figure 3, panels A–D, in different thermal conditions.
The ASPCR assays described had good reproducibility. Because inter-assay CVs were higher than intra-assay CVs, serial specimens from an individual patient should be run in a single batch. As expected, CVs were greatest for samples with a low nominal proportion of mutant species. However, the magnitude of variation was small relative to the proportion of mutant species detected. For example, the intra-assay CV of the M184V ASPCR when the mutant species constituted 1% of the population was 0.18, which corresponded to a 99 % confidence interval of [0.5% – 2%]. (Reed et al., 2002).
In reconstruction experiments, the four ASPCR assays were highly accurate in quantifying the proportion of mutant species over the range 100%–1%, but overestimated the proportion of mutant species at proportions below 1%. The total input DNA copy number did not affect the accuracy of measurements provided that the Ct values fell within the linear range of amplification for the respective primer pairs (106–7−101). However, a minimum input of 104 DNA copies in the real-time PCR step was required to ensure a sensitivity of at least 0.1% (101 mutants / 104 total variants = 0.1%).
As with any method for assessing minor HIV-1 variants, true assay sensitivity depends on the number of RNA molecules in the original sample. According to the Poisson distribution, to detect at least 1 mutant variant present in 0.1% of the total population with a 99% probability, at least 5000 variants need to be tested. Therefore, the template RNA for the RT-PCR step had to include at least 5000 RNA molecules to permit a sensitivity of 0.1%, regardless any other characteristic of the ASPCR assay. The RNA copy in the assay depends on plasma HIV-1 RNA concentration, the volume of plasma used and the efficiency of the RNA extraction process (Table 4). The efficiency of the reverse transcriptase step also must be taken into account. Large volumes of plasma are required for the RNA extraction in specimens with low viral loads in order to preserve the ability of any assay to detect minor variants (Table 4).
Another limitation of ASPCR is that polymorphisms that occur in the primer or probe binding sites can significantly impair the accuracy of ASPCR measurements. In accordance with prior data, (Palmer S, 2006) whereas polymorphisms near the 5′ end of the discriminative primer set had little effect on the accuracy of proportions, those occurring near the 3′ end could result in the underestimation of the proportion of mutant variants. The incorporation of polymorphisms detected by prior population-based sequencing into the discriminatory primer set has been suggested to overcome this problem. (Palmer S, 2006) Moreover, relevant polymorphisms also had to be incorporated into the standards (not shown). Otherwise, the presence of an additional mismatch between the discriminative primer set (with the polymorphism) and the standard sequence (without the polymorphism) preferentially constrained the amplification of the mutant-specific standard curve, relative to the nonspecific standard curve. In some situations, substituting SYBR™green or molecular beacons for TaqMan™ probes may also help to overcome problems caused by sequence polymorphisms.
In summary, ASPCR is a valuable technique for studying point mutations in viral genomes. The high sensitivity, accuracy and reproducibility of this technique make it a particularly useful tool for resistance surveillance. Other possible applications include studying the kinetics of selection and decay of point resistance mutations, in vivo turnover of cell populations and viral fitness estimations (Marconi et al., 2006; Paredes et al., 2006). The approach described herein easily be adapted to study other mutations in the HIV-1 genome or in other viruses, in plasma, peripheral blood mononuclear cells (Loubser et al., 2006), and other tissues. Allele-specific PCR will remain highly relevant in elucidating the importance of minor variants to the clinical outcomes of patients infected with drug-resistant HIV.
Acknowledgments
This work was supported by the following sources: Harvard University Center for AIDS Research (P30 AI60354), a Virology Specialty Laboratory subcontract from the AIDS Clinical Trials Group (U01 AI 38858 and AI68636), and K24 RR16482 (to D.R.K.). R.P. is a recipient of the “La Caixa” Fellowship Grant for Post-Graduate Studies, Caixa d’Estalvis i Pensions de Barcelona, Catalonia, Spain.
Footnotes
Publisher's Disclaimer: This is a PDF file of an unedited manuscript that has been accepted for publication. As a service to our customers we are providing this early version of the manuscript. The manuscript will undergo copyediting, typesetting, and review of the resulting proof before it is published in its final citable form. Please note that during the production process errors may be discovered which could affect the content, and all legal disclaimers that apply to the journal pertain.
References
- Baxter JD, Mayers DL, Wentworth DN, Neaton JD, Hoover ML, Winters MA, Mannheimer SB, Thompson MA, Abrams DI, Brizz BJ, Ioannidis JP, Merigan TC. A randomized study of antiretroviral management based on plasma genotypic antiretroviral resistance testing in patients failing therapy. CPCRA 046 Study Team for the Terry Beirn Community Programs for Clinical Research on AIDS. Aids. 2000;14:F83–93. doi: 10.1097/00002030-200006160-00001. [DOI] [PubMed] [Google Scholar]
- Bergroth T, Sonnerborg A, Yun Z. Discrimination of lamivudine resistant minor HIV-1 variants by selective real-time PCR. J Virol Methods. 2005;127:100–7. doi: 10.1016/j.jviromet.2005.03.007. [DOI] [PubMed] [Google Scholar]
- Boucher CA, Lange JM, Miedema FF, Weverling GJ, Koot M, Mulder JW, Goudsmit J, Kellam P, Larder BA, Tersmette M. HIV-1 biological phenotype and the development of zidovudine resistance in relation to disease progression in asymptomatic individuals during treatment. Aids. 1992;6:1259–64. doi: 10.1097/00002030-199211000-00003. [DOI] [PubMed] [Google Scholar]
- Brun-Vezinet F, Costagliola D, Khaled MA, Calvez V, Clavel F, Clotet B, Haubrich R, Kempf D, King M, Kuritzkes D, Lanier R, Miller M, Miller V, Phillips A, Pillay D, Schapiro J, Scott J, Shafer R, Zazzi M, Zolopa A, DeGruttola V. Clinically validated genotype analysis: guiding principles and statistical concerns. Antivir Ther. 2004;9:465–78. [PubMed] [Google Scholar]
- Campbell TB, Shulman NS, Johnson SC, Zolopa AR, Young RK, Bushman L, Fletcher CV, Lanier ER, Merigan TC, Kuritzkes DR. Antiviral activity of lamivudine in salvage therapy for multidrug-resistant HIV-1 infection. Clin Infect Dis. 2005;41:236–42. doi: 10.1086/430709. [DOI] [PubMed] [Google Scholar]
- Cingolani A, Antinori A, Rizzo MG, Murri R, Ammassari A, Baldini F, Di Giambenedetto S, Cauda R, De Luca A. Usefulness of monitoring HIV drug resistance and adherence in individuals failing highly active antiretroviral therapy: a randomized study (ARGENTA) Aids. 2002;16:369–79. doi: 10.1097/00002030-200202150-00008. [DOI] [PubMed] [Google Scholar]
- Coffin JM. HIV population dynamics in vivo: implications for genetic variation, pathogenesis, and therapy. Science. 1995;267:483–9. doi: 10.1126/science.7824947. [DOI] [PubMed] [Google Scholar]
- Cohen CJ, Hunt S, Sension M, Farthing C, Conant M, Jacobson S, Nadler J, Verbiest W, Hertogs K, Ames M, Rinehart AR, Graham NM. A randomized trial assessing the impact of phenotypic resistance testing on antiretroviral therapy. Aids. 2002;16:579–88. doi: 10.1097/00002030-200203080-00009. [DOI] [PubMed] [Google Scholar]
- Cristina J. Genetic diversity and evolution of hepatitis C virus in the Latin American region. J Clin Virol. 2005;34(Suppl 2):S1–7. doi: 10.1016/s1386-6532(05)00393-8. [DOI] [PubMed] [Google Scholar]
- D’Amato RM, D’Aquila RT, Wein LM. Management of antiretroviral therapy for HIV infection: modelling when to change therapy. Antivir Ther. 1998;3:147–58. [PubMed] [Google Scholar]
- Domingo E, Holland JJ. RNA virus mutations and fitness for survival. Annu Rev Microbiol. 1997;51:151–78. doi: 10.1146/annurev.micro.51.1.151. [DOI] [PubMed] [Google Scholar]
- Durant J, Clevenbergh P, Halfon P, Delgiudice P, Porsin S, Simonet P, Montagne N, Boucher CA, Schapiro JM, Dellamonica P. Drug-resistance genotyping in HIV-1 therapy: the VIRADAPT randomised controlled trial. Lancet. 1999;353:2195–9. doi: 10.1016/s0140-6736(98)12291-2. [DOI] [PubMed] [Google Scholar]
- Flys T, Nissley DV, Claasen CW, Jones D, Shi C, Guay LA, Musoke P, Mmiro F, Strathern JN, Jackson JB, Eshleman JR, Eshleman SH. Sensitive drug-resistance assays reveal long-term persistence of HIV-1 variants with the K103N nevirapine (NVP) resistance mutation in some women and infants after the administration of single-dose NVP: HIVNET 012. J Infect Dis. 2005;192:24–9. doi: 10.1086/430742. [DOI] [PubMed] [Google Scholar]
- Gonzalez-Lopez C, Gomez-Mariano G, Escarmis C, Domingo E. Invariant aphthovirus consensus nucleotide sequence in the transition to error catastrophe. Infect Genet Evol. 2005;5:366–74. doi: 10.1016/j.meegid.2005.05.001. [DOI] [PubMed] [Google Scholar]
- Grant RM, Kuritzkes DR, Johnson VA, Mellors JW, Sullivan JL, Swanstrom R, D’Aquila RT, Van Gorder M, Holodniy M, Lloyd RM, Jr, Reid C, Morgan GF, Winslow DL. Accuracy of the TRUGENE HIV-1 genotyping kit. J Clin Microbiol. 2003;41:1586–93. doi: 10.1128/JCM.41.4.1586-1593.2003. [DOI] [PMC free article] [PubMed] [Google Scholar]
- Halvas EK, Aldrovandi GM, Balfe P, Beck IA, Boltz VF, Coffin JM, Frenkel LM, Hazelwood JD, Johnson VA, Kearney M, Kovacs A, Kuritzkes DR, Metzner KJ, Nissley DV, Nowicki M, Palmer S, Ziermann R, Zhao RY, Jennings CL, Bremer J, Brambilla D, Mellors JW. Blinded, multicenter comparison of methods to detect a drug-resistant mutant of human immunodeficiency virus type 1 at low frequency. J Clin Microbiol. 2006;44:2612–4. doi: 10.1128/JCM.00449-06. [DOI] [PMC free article] [PubMed] [Google Scholar]
- Harrigan PR, Hertogs K, Verbiest W, Pauwels R, Larder B, Kemp S, Bloor S, Yip B, Hogg R, Alexander C, Montaner JS. Baseline HIV drug resistance profile predicts response to ritonavir-saquinavir protease inhibitor therapy in a community setting. Aids. 1999;13:1863–71. doi: 10.1097/00002030-199910010-00008. [DOI] [PubMed] [Google Scholar]
- Haubrich RH, Kemper CA, Hellmann NS, Keiser PH, Witt MD, Tilles JG, Forthal DN, Leedom J, Leibowitz M, McCutchan JA, Richman DD. A randomized, prospective study of phenotype susceptibility testing versus standard of care to manage antiretroviral therapy: CCTG 575. Aids. 2005;19:295–302. [PubMed] [Google Scholar]
- Japour AJ, Welles S, D’Aquila RT, Johnson VA, Richman DD, Coombs RW, Reichelderfer PS, Kahn JO, Crumpacker CS, Kuritzkes DR. Prevalence and clinical significance of zidovudine resistance mutations in human immunodeficiency virus isolated from patients after long-term zidovudine treatment. AIDS Clinical Trials Group 116B/117 Study Team and the Virology Committee Resistance Working Group. J Infect Dis. 1995;171:1172–9. doi: 10.1093/infdis/171.5.1172. [DOI] [PubMed] [Google Scholar]
- Jerzak G, Bernard KA, Kramer LD, Ebel GD. Genetic variation in West Nile virus from naturally infected mosquitoes and birds suggests quasispecies structure and strong purifying selection. J Gen Virol. 2005;86:2175–83. doi: 10.1099/vir.0.81015-0. [DOI] [PMC free article] [PubMed] [Google Scholar]
- Johnson VA, Brun-Vezinet F, Clotet B, Conway B, Kuritzkes DR, Pillay D, Schapiro J, Telenti A, Richman D. Update of the Drug Resistance Mutations in HIV-1: 2005. Top HIV Med. 2005;13:51–7. [PubMed] [Google Scholar]
- Larder BA, Kellam P, Kemp SD. Zidovudine resistance predicted by direct detection of mutations in DNA from HIV-infected lymphocytes. Aids. 1991;5:137–44. doi: 10.1097/00002030-199102000-00002. [DOI] [PubMed] [Google Scholar]
- Leamon JH, Lee WL, Tartaro KR, Lanza JR, Sarkis GJ, deWinter AD, Berka J, Weiner M, Rothberg JM, Lohman KL. A massively parallel PicoTiterPlate based platform for discrete picoliter-scale polymerase chain reactions. Electrophoresis. 2003;24:3769–77. doi: 10.1002/elps.200305646. [DOI] [PubMed] [Google Scholar]
- Loubser S, Balfe P, Sherman G, Hammer S, Kuhn L, Morris L. Decay of K103N mutants in cellular DNA and plasma RNA after single-dose nevirapine to reduce mother-to-child HIV transmission. Aids. 2006;20:995–1002. doi: 10.1097/01.aids.0000222071.60620.1d. [DOI] [PMC free article] [PubMed] [Google Scholar]
- Marconi V, Bonhoeffer S, Paredes R, Lu J, Hoh R, Martin J, Deeks S, Kuritzkes D. in vivo Fitness of Enfuvirtide-resistant HIV-1 Estimated by Allele-specific PCR during Partial Treatment Interruption and Pulse Intensification; 13th Conference on Retroviruses and Opportunistic Infections; February 5th–8th, 2006; Denver, CO. 2006. [Abstract 629] [Google Scholar]
- Margulies M, Egholm M, Altman WE, Attiya S, Bader JS, Bemben LA, Berka J, Braverman MS, Chen YJ, Chen Z, Dewell SB, Du L, Fierro JM, Gomes XV, Godwin BC, He W, Helgesen S, Ho CH, Irzyk GP, Jando SC, Alenquer ML, Jarvie TP, Jirage KB, Kim JB, Knight JR, Lanza JR, Leamon JH, Lefkowitz SM, Lei M, Li J, Lohman KL, Lu H, Makhijani VB, McDade KE, McKenna MP, Myers EW, Nickerson E, Nobile JR, Plant R, Puc BP, Ronan MT, Roth GT, Sarkis GJ, Simons JF, Simpson JW, Srinivasan M, Tartaro KR, Tomasz A, Vogt KA, Volkmer GA, Wang SH, Wang Y, Weiner MP, Yu P, Begley RF, Rothberg JM. Genome sequencing in microfabricated high-density picolitre reactors. Nature. 2005;437:376–80. doi: 10.1038/nature03959. [DOI] [PMC free article] [PubMed] [Google Scholar]
- Metzner KJ, Bonhoeffer S, Fischer M, Karanicolas R, Allers K, Joos B, Weber R, Hirschel B, Kostrikis LG, Gunthard HF. Emergence of minor populations of human immunodeficiency virus type 1 carrying the M184V and L90M mutations in subjects undergoing structured treatment interruptions. J Infect Dis. 2003;188:1433–43. doi: 10.1086/379215. [DOI] [PubMed] [Google Scholar]
- Metzner KJ, Rauch P, Walter H, Boesecke C, Zollner B, Jessen H, Schewe K, Fenske S, Gellermann H, Stellbrink HJ. Detection of minor populations of drug-resistant HIV-1 in acute seroconverters. Aids. 2005;19:1819–25. doi: 10.1097/01.aids.0000189878.97480.ed. [DOI] [PubMed] [Google Scholar]
- Meynard JL, Vray M, Morand-Joubert L, Race E, Descamps D, Peytavin G, Matheron S, Lamotte C, Guiramand S, Costagliola D, Brun-Vezinet F, Clavel F, Girard PM. Phenotypic or genotypic resistance testing for choosing antiretroviral therapy after treatment failure: a randomized trial. Aids. 2002;16:727–36. doi: 10.1097/00002030-200203290-00008. [DOI] [PubMed] [Google Scholar]
- Middleton T, Smith D, Larder B, Law M, Birch C. Baseline antiretroviral drug susceptibility influences treatment response in patients receiving saquinavir-enhancing therapy. HIV Clin Trials. 2001;2:445–52. doi: 10.1310/YHGE-07Y8-T3XF-F6VT. [DOI] [PubMed] [Google Scholar]
- Newton CR, Graham A, Heptinstall LE, Powell SJ, Summers C, Kalsheker N, Smith JC, Markham AF. Analysis of any point mutation in DNA. The amplification refractory mutation system (ARMS) Nucleic Acids Res. 1989;17:2503–16. doi: 10.1093/nar/17.7.2503. [DOI] [PMC free article] [PubMed] [Google Scholar]
- Nissley DV, Halvas EK, Hoppman NL, Garfinkel DJ, Mellors JW, Strathern JN. Sensitive phenotypic detection of minor drug-resistant human immunodeficiency virus type 1 reverse transcriptase variants. J Clin Microbiol. 2005;43:5696–704. doi: 10.1128/JCM.43.11.5696-5704.2005. [DOI] [PMC free article] [PubMed] [Google Scholar]
- Palmer S, B V, Maldarelli F, McIntyre J, Morris L, Hopley M, Mayers D, Robinson P, Mellors J, Coffin J. Optimization of Allele-specific PCR for Drug-resistant HIV Variants using Patient-specific Consensus Sequences for Primer Design; 13th Conference on Retroviruses and Opportunistic Infections; February 5–8; Denver, CO. 2006. [Google Scholar]
- Palmer S, Kearney M, Maldarelli F, Halvas EK, Bixby CJ, Bazmi H, Rock D, Falloon J, Davey RT, Jr, Dewar RL, Metcalf JA, Hammer S, Mellors JW, Coffin JM. Multiple, linked human immunodeficiency virus type 1 drug resistance mutations in treatment-experienced patients are missed by standard genotype analysis. J Clin Microbiol. 2005;43:406–13. doi: 10.1128/JCM.43.1.406-413.2005. [DOI] [PMC free article] [PubMed] [Google Scholar]
- Paredes R, Marconi V, Hoh R, Martin J, Petropoulos C, Deeks S, Kuritzkes D. Prolonged Persistence of M184V Mutation and Phenotypic Resistance to Lamivudine in Adults with Multi-drug-resistant HIV-1 Infection Interrupting Treatment with Reverse Transcriptase Inhibitors; 13th Conference on Retroviruses and Opportunistic Infections; February 5th–8th, 2006; Denver, CO. 2006. [Abstract 628] [Google Scholar]
- Reed GF, Lynn F, Meade BD. Use of Coefficient of Variation in Assessing Variability of Quantitative Assays. Clin Diagn Lab Immunol. 2002;9:1235–1239. doi: 10.1128/CDLI.9.6.1235-1239.2002. [DOI] [PMC free article] [PubMed] [Google Scholar]
- Ross L, Liao Q, Gao H, Pham S, Tolson J, Hertogs K, Larder B, Saag MS. Impact of HIV type 1 drug resistance mutations and phenotypic resistance profile on virologic response to salvage therapy. AIDS Res Hum Retroviruses. 2001;17:1379–85. doi: 10.1089/088922201753197042. [DOI] [PubMed] [Google Scholar]
- Shi C, Eshleman SH, Jones D, Fukushima N, Hua L, Parker AR, Yeo CJ, Hruban RH, Goggins MG, Eshleman JR. LigAmp for sensitive detection of single-nucleotide differences. Nat Methods. 2004;1:141–7. doi: 10.1038/nmeth713. [DOI] [PubMed] [Google Scholar]
- Tural C, Ruiz L, Holtzer C, Schapiro J, Viciana P, Gonzalez J, Domingo P, Boucher C, Rey-Joly C, Clotet B. Clinical utility of HIV-1 genotyping and expert advice: the Havana trial. Aids. 2002;16:209–18. doi: 10.1097/00002030-200201250-00010. [DOI] [PubMed] [Google Scholar]
- Wensing AM, van de Vijver DA, Angarano G, Asjo B, Balotta C, Boeri E, Camacho R, Chaix ML, Costagliola D, De Luca A, Derdelinckx I, Grossman Z, Hamouda O, Hatzakis A, Hemmer R, Hoepelman A, Horban A, Korn K, Kucherer C, Leitner T, Loveday C, MacRae E, Maljkovic I, de Mendoza C, Meyer L, Nielsen C, Op de Coul EL, Ormaasen V, Paraskevis D, Perrin L, Puchhammer-Stockl E, Ruiz L, Salminen M, Schmit JC, Schneider F, Schuurman R, Soriano V, Stanczak G, Stanojevic M, Vandamme AM, Van Laethem K, Violin M, Wilbe K, Yerly S, Zazzi M, Boucher CA. Prevalence of drug-resistant HIV-1 variants in untreated individuals in Europe: implications for clinical management. J Infect Dis. 2005;192:958–66. doi: 10.1086/432916. [DOI] [PubMed] [Google Scholar]