

Abstract
Association between clinical factors and high-risk plaque features such as thin or ruptured cap, intra-plaque hemorrhage (IPH), presence of Lipid Rich Necrotic Core (LRNC) and increased LRNC volume as assessed by Magnetic Resonance Imaging (MRI) was examined in patients with established vascular disease in AIM-HIGH. A total of 214 subjects underwent carotid MRI and had acceptable image quality for assessment of plaque burden, tissue contents and MRI-modified AHA lesion type by a Core Lab. We found that 77% of subjects had carotid plaques, 52% had lipid-containing plaques, and 11% had advanced, AHA type-VI lesions with possible surface defect, IPH or mural thrombus. Type-VI lesions were associated with older age (OR=2.6 per 5 years increase, p<0.001). After adjusting for age, these lesions were associated with history of cerebrovascular disease (OR=4.1, p=0.01), higher levels of Lipoprotein(a) (OR=2.0 per 1 SD increase, p=0.02) and larger %wall volume (%WV; OR=4.6 per 1 SD increase, p<0.001), but, were negatively associated with metabolic syndrome (OR=0.2, p=0.02). Presence of LRNC was associated with male gender (OR=3.2, p=0.02) and %WV (OR=3.8 per 1 SD, p<0.001), but, was negatively associated with diabetes (OR=0.4, p=0.02) and HDL-C levels (OR=0.7 per 1 SD, p=0.02). Increased %LRNC was associated with %WV (regression coefficient=0.36, p<0.001) and negatively associated with ApoA1 levels (regression coefficient=−0.20, p=0.03). In conclusions, older age, male gender, history of cerebrovascular disease, larger plaque burden, higher Lp(a), and lower HDL-C or ApoA1 have statistically significant associations with high-risk plaque features. Metabolic syndrome and diabetes showed negative associations in this population.
Keywords: risk factors, atherosclerotic plaques, MRI, cardiovascular disease
Introduction
Development of high-resolution magnetic resonance imaging (MRI) techniques in recent years has made it possible to directly assess plaque burden and composition [1-9]. Prospective MRI studies of carotid lesions [10-13] offer compelling evidence that high-risk plaque features, such as thin or ruptured cap, intraplaque hemorrhage (IPH), presence of lipid-rich necrotic core (LRNC) and increased LRNC volume, strongly associate with clinical cerebrovascular events as well as coronary heart disease events. We designed a multi-center carotid MRI study in the AIM-HIGH trial (Atherothrombosis Intervention in Metabolic Syndrome With Low HDL/High Triglycerides: Impact on Global Health Outcomes) [14, 15] to directly assess atherosclerotic plaque burden and tissue contents in patients with established vascular disease and well-controlled LDL-C and blood pressure, but, with elevated triglycerides and low level of HDL-C. This report examines the association of clinical factors with presence of baseline high-risk carotid plaque features as assessed by MRI in AIM-HIGH.
Methods
Amongst a total of 3414 AIM-HIGH participants, 447 were potentially available to be enrolled in the carotid MRI sub-study at 21 clinical sites based on the recruitment dates of each subject and the start of enrollment for the MRI sub-study. The AIM-HIGH study enrolled men and women, aged 45 years or older, with atherogenic dyslipidemia consisting of low HDL-C (if off statin ≤40 mg/dL for men or ≤50 mg/dL for women), high triglycerides (if off statin 150-400 mg/dL), and untreated LDL-C ≤180 mg/dL and documented clinically established atherosclerotic cardivascular disease. Of these 447, there were 232 who met the inclusion/exclusion criteria-eGFR ≥60 ml/min/1.73m2, no contraindication to MRI, no history of claustrophobia, and consented to participate in the sub-study. These subjects underwent the baseline carotid scan between February 2008 and May 2010 at 10 MRI centers. Details of site location, PI and coordinator information are listed in the Appendix. Two hundred and fourteen subjects had acceptable image quality for assessment at baseline as shown in Figure 1. This study was approved by the AIM-HIGH Executive Committee and local IRB/RECs at each participating clinical site. Separate signed informed consent was obtained from participants in this sub-study.
Figure 1.

Study flow and carotid MRI sub-study population.
The carotid MRI sub-study in AIM-HIGH was a large multicenter investigation using either GE or Philips 3T whole body scanners. A standardized carotid MRI scan protocol with multi-contrast sequences as listed in Table 1 was developed by the University of Washington Vascular Imaging Lab to achieve clear identification of carotid outer wall and lumen boundaries as well as plaque tissue contents. Subjects were placed in the supine position in the MR scanner with the neck extended to bring the carotid arteries into a more superficial location relative to the skin. A custom-designed head holder was used to minimize movement. Two separate phased-array carotid coils were used to obtain a simultaneous bilateral scan. As shown in Table 1, following the oblique scans, cross-sectional images with 2 mm thickness and a total coverage of 3.2 cm were obtained, centered at the common carotid bifurcation. A 20 ml (0.1mmol/kg) bolus of gadolinium contrast material was administrated intravenously though a power injector for the dynamic contrast enhanced MRI (DCE-MRI) and post-contrast imaging. The T1W sequence was repeated 5-7 minutes after contrast administration. The total scan time for each subject was less than 45 minutes per scan. The carotid artery with the thicker wall or larger plaque with less calcification on the baseline scan was assigned as the index side.
Table 1.
Standardized carotid magnetic resonance imaging (MRI) scan protocol
| Parameters | T1 Weighted |
T2 Weighted |
3D Time-of-Flight (TOF) |
3D Magnetization Prepared Rapid Gradient Echo (MP-RAGE) |
Dynamic contrast- enhanced |
|---|---|---|---|---|---|
| Gadolinium contrast |
No/Yes | No | No | No | Yes |
| Scan plane | Axial | Axial | Axial | Axial | Axial |
| Repetition time (msec) |
800 | 4800 | 24 | 13 | 125 |
| Echo time (msec) | 10 | 50 | Min | Min | 4.6 |
| Field-of-view (cm2) |
16×16 | 16×16 | 16×16 | 16×16 | 16×16 |
| Resolution (mm2) | 0.63×0.63 | 0.63×0.63 | 0.63×0.63 | 0.63×0.63 | 0.63×0.63 |
| Slice thickness (mm) |
2 | 2 | 1* | 1* | 2 |
| Coverage (mm) | 32 | 32 | 48 | 48 | 16 |
| Blood suppression |
Quadruple Inversion Recovery |
Multi-slice Double Inversion Recovery |
Saturation - veins |
No | Saturation arteries/ veins |
| Fat suppression | Yes | Yes | No | Yes | Yes |
| Averages | 1 | 1 | 1 | 1 | 1 |
After two-fold zero interpolation.
MR personnel from all imaging sites participated in an MR imaging training session held by the Core Lab. They were instructed on study design, MR protocol design, image acquisition and identification and correction of imaging artifacts. Following the training, each imaging site was required to perform a phantom scan as well as a scan of a volunteer using the study protocol. Adherence to protocol parameters, image quality and presence of artifacts were assessed. Immediate feedback and technical support were provided to the site to remedy any protocol deviations and image quality issues.
All study scans were transferred to the core lab and reviewed for image quality and protocol deviations within 48 hours of the scan. Vessel Wall image quality was assessed based on a previous described four-point scale (16). Scans of inadequate quality were repeated. If the repeat scan did not qualify by image quality, then the subject was excluded from the study. Reviewers trained in carotid MRI analysis interpreted all images, blinded to subject information, therapy, and lab results. All images from TOF, T1, PD, T2, MPRAGE, and post-contrast T1 weightings were co-registered, using the common carotid bifurcation as a physical landmark. For each case, two reviewers reached consensus for the measurements made. Plaque components (LRNC, fibrous tissue, loose matrix and calcification) were identified using previously published MRI criteria [5].
CASCADE [17], a custom-designed image analysis tool, was used to contour boundaries of the lumen, outer-wall and plaque components (Figure 2). Volumes were derived by summing the contour areas across slices from the same vessel and multiplying the sum by the slice thickness (2 mm). The primary measure of plaque burden was Percent Wall Volume (%WV), calculated using the following formula: (wall volume/total vessel volume) × 100%. %WV adjusts for variation in artery size, and is similar to percent atheroma volume described in the intravascular ultrasound literature. The percent volume of each component was calculated using the formula: (component volume/wall volume) × 100%. In particular, %LRNC volume was calculated using only the slices with LRNC present.
Figure 2.
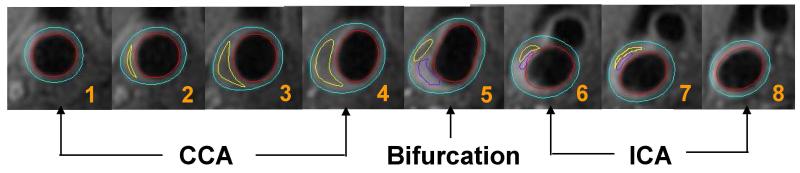
MRI example of 8 consecutive images on post-contrast T1 weighting from common carotid through bifurcation to the internal carotid arteries (from #1-#8). The lumen in red and outer wall boundary in blue of the carotid artery are identified and outlined. Plaque tissue component within the arterial wall is identified and quantified shown as loose matrix in purple and lipid content in yellow.
AHA lesion types were evaluated using previously published MRI-based criteria [7]: type I-II = near-normal wall thickness; type III = diffuse wall thickening or small eccentric plaque; type IV-V = plaque with a necrotic core; type VI = complex plaque with a possible surface defect, intraplaque hemorrhage, or mural thrombus; type VII = calcified plaque; and type VIII = fibrotic plaque without a necrotic core. The Carotid Atherosclerosis Score (CAS) for each plaque was computed with an adjustment to include AHA type-VI lesions in the highest risk category as previously described [18,19]: CAS 1 (low risk) = plaque with max wall thickness ≤ 2 mm; CAS 2 (medium-low risk) = plaque with max %LRNC (LRNC area/wall area) ≤ 20%; CAS 3 (medium-high risk) = plaque with max %LRNC 20-40%; CAS 4 (high risk) = plaque with max %LRNC > 40% or AHA type-VI lesion.
Clinical characteristics of subjects in the MRI sub-study were compared with those of the remainder of the AIM-HIGH cohort using Fisher’s exact test and the Mann-Whitney test. Linear and logistic regression models were used to evaluate associations with continuous and binary plaque outcomes, respectively. Continuous variables were visually inspected using histograms and QQ-plots to determine whether the distributional assumptions were appropriate. Highly right-skewed variables were log-transformed prior to inclusion in regression models. Throughout the regression analyses, continuous variables (outcome and independent variables) were standardized to have SD = 1. For multivariate analysis, adjustments were made for age, gender and %WV and variables statistically significant after these adjustments were included in the final multivariate models. All statistical calculations were conducted with the R statistical software package [20]. Throughout, two-tailed tests were used with p<0.05 denoting statistical significance.
Results
As described in Table 2, compared to the rest of AIM-HIGH cohort (n=3200), the 214 subjects in the MRI sub-study had the following statistically significant differences: they were younger (mean: 61 vs. 64 years, p<0.001), more likely to be non-white (12% vs. 7%, p=0.02), more likely to have hypertension (83% vs. 71%, p<0.001), less likely to be treated with statin for one year or longer (72% vs. 82%, p=0.001), and less likely to have diabetes (25% vs. 35%, p=0.004). They also had smaller BMI (mean: 30 vs. 31 kg/m2, p=0.009) and lower triglycerides (median: 158 vs. 165 mg/dl, p=0.03).
Table 2.
Summary of patient demographics and clinical factors for those included the magnetic resonance imaging (MRI) sub-study (N=214) and the remainder of the AIM-HIGH cohort (N=3200).
| Variable | In MRI Study (N=214) |
Not in MRI Study (N=3200) |
p-Value* | Tot. N | ||||
|---|---|---|---|---|---|---|---|---|
| Male | 175 (82%) | 2735 (85%) | 0.16 | 3414 | ||||
| Female | 39 (18%) | 465 (15%) | ||||||
|
| ||||||||
| Age (years) | 61 ± 9 | 61 | (45 - 80) | 64 ± 9 | 64 | (44 - 89) | <0.001 | 3414 |
|
| ||||||||
| White | 187 (88%) | 2961 (93%) | 0.017 | 3413 | ||||
| Non-white/Other | 26 (12%) | 239 (7%) | ||||||
|
| ||||||||
| Hispanic or Latino | 10 (5%) | 130 (4%) | 0.59 | 3413 | ||||
| Not Hispanic or Latino | 203 (95%) | 3070 (96%) | ||||||
|
| ||||||||
| Statin therapy ≥ 1 year | 151 (72%) | 2458 (82%) | 0.001 | 3210 | ||||
|
| ||||||||
| Coronary artery disease | 203 (95%) | 2944 (92%) | 0.15 | 3414 | ||||
|
| ||||||||
| Prior cerebrovascular disease | 34 (16%) | 686 (21%) | 0.057 | 3414 | ||||
| Stroke or transient ischemic attack | 21 (10%) | 325 (10%) | >0.99 | 3414 | ||||
| Carotid disease | 23 (11%) | 475 (15%) | 0.11 | 3414 | ||||
|
| ||||||||
| Hypertension | 178 (83%) | 2261 (71%) | <0.001 | 3414 | ||||
| Smoker | 151 (71%) | 2388 (75%) | 0.14 | 3388 | ||||
| Diabetes mellitus | 53 (25%) | 1105 (35%) | 0.004 | 3414 | ||||
| Metabolic syndrome (+) | 175 (82%) | 2592 (81%) | 0.79 | 3403 | ||||
|
| ||||||||
| Body mass Index (kg / m2) | 30 ± 5 | 30 | (17 - 47) | 31 ± 5 | 30 | (14 - 64) | 0.009 | 3409 |
| Systolic blood pressure (mmHg) | 128 ± 17 | 128 | (84 - 180) | 128 ± 16 | 128 | (85 - 215) | 0.85 | 3412 |
| Diastolic blood pressure (mmHg) | 75 ± 10 | 74 | (47 - 116) | 74 ± 10 | 74 | (35 - 128) | 0.59 | 3411 |
| Total cholesterol (mg/dl) | 146 ± 31 | 144 | (70 - 262) | 145 ± 27 | 143 | (74 - 290) | 0.92 | 3414 |
| Non-HDL cholesterol (mg/dl) | 111 ± 30 | 107 | (48 - 222) | 111 ± 27 | 108 | (47 - 252) | 0.86 | 3414 |
| LDL cholesterol (mg/dl) | 77 ± 27 | 73 | (19 - 180) | 74 ± 23 | 72 | (20 - 180) | 0.22 | 3414 |
| HDL cholesterol (mg/dl) | 35 ± 6 | 35 | (18 - 52) | 35 ± 6 | 35 | (16 - 53) | 0.88 | 3414 |
| Triglycerides (mg/dl) | 174 ± 66 | 158 | (100 - 400) | 183 ± 67 | 165 | (93 - 399) | 0.031 | 3414 |
| Lipoprotein(a) (mg/dl) | 81 ± 93 | 32 | (0.3 - 341) | 76 ± 88 | 34 | (0.1 - 620) | 0.63 | 3359 |
| ApoB (mg/dl) | 86 ± 23 | 84 | (32 - 175) | 83 ± 20 | 81 | (30 - 329) | 0.077 | 3353 |
| ApoA1 (mg/dl) | 121 ± 16 | 122 | (59 - 168) | 123 ± 16 | 123 | (61 - 194) | 0.35 | 3353 |
Continuous data are presented as mean ± standard, median and (range);
Categorical data are presented as n (%);
Fisher’s exact test (categorical variables) or the Mann-Whitney test (continuous variables).
From examination of the carotid MRI of the 214 subjects, mean %WV was 42±7%, 77% had carotid plaques, 52% were found to have lipid-containing plaques as shown in Figure 3A and 11% had advanced, AHA type-VI lesions (Table 3). Similarly, 26 subjects (12%) showed high-risk plaques with CAS = 4. Figure 3B shows an MRI example of IPH with noticeable increased signal intensity on T1 and MPRAGE.
Figure 3A.
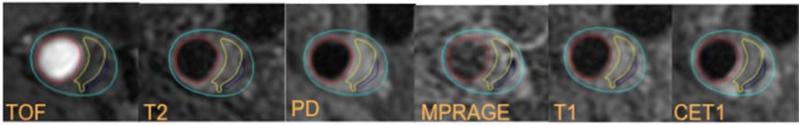
Example of LRNC on multi-contrast MRI. Plaque lipid content in yellow appears isointense on the TOF and pre-contrast T1W images and hypointensity on PDW, T2W and MPRAGE images, has no contrast enhancement compared with the surrounding tissue on post-contrast T1W images.
Table 3.
Summary of carotid plaque variables from all subjects (N=214) and from those with lipid-rich necrotic core present (N=112).
| All subjects | Value | ||
|---|---|---|---|
| AHA lesion type (any) | |||
| III | 124 (58%) | ||
| IV-V | 110 (51%) | ||
| VI | 23 (11%) | ||
| VII | 76 (36%) | ||
|
| |||
| AHA lesion type (most severe*) | |||
| I-II (no detectable plaque) | 49 (23%) | ||
| III | 21 (10%) | ||
| IV-V | 91 (43%) | ||
| VI | 23 (11%) | ||
| VII | 30 (14%) | ||
|
| |||
| Carotid Atherosclerosis Score (CAS) | |||
| 1 (low risk) | 75 (35%) | ||
| 2 (medium-low risk) | 91 (43%) | ||
| 3 (medium-high risk) | 22 (10%) | ||
| 4 (high risk) | 26 (12%) | ||
|
| |||
| Presence of lipid-rich necrotic core | 112 (52%) | ||
| Presence of calcification | 103 (48%) | ||
| Presence of loose matrix | 21 (10%) | ||
| Presence of intraplaque hemorrhage | 18 (8.4%) | ||
| Presence of surface defect | 17 (7.9%) | ||
| Presence of mural thrombus | 1 (0.5%) | ||
|
| |||
| Wall volume (mm3) | 788 ± 232 | 741 | (387 - 1965) |
| % wall volume (%) | 42 ± 7 | 41 | (27 - 69) |
| Mean wall thickness (mm) | 1.1 ± 0.2 | 1.1 | (0.8 - 2.4) |
| Max wall thickness (mm) | 2.7 ± 1.4 | 2.5 | (0.9 - 8.0) |
|
| |||
| Subjects with lipid-rich necrotic core | |||
|
| |||
| Lipid-rich necrotic core volume (mm3) | 76 ± 126 | 31 | (4 - 735) |
| % wall volume (%) | 45 ± 7 | 44 | (29 - 69) |
| % lipid-rich necrotic core volume (%)† | 14 ± 10 | 10 | (3 - 51) |
| % calcification volume (%)† | 1.6 ± 2.6 | 0 | (0 - 12) |
| % loose matrix volume (%)† | 0.4 ± 1.3 | 0 | (0 - 9.0) |
| % fibrous tissue volume (%)† | 84 ± 11 | 88 | (43 - 97) |
Continuous data are presented as mean ± standard, median and (range);
Categorical data are presented as n (%);
AHA lesion types in order of increasing severity: I-II, III, VII, IV-V, VI;
As a percentage of the wall volume from locations with lipid-rich necrotic core present.
Figure 3B.
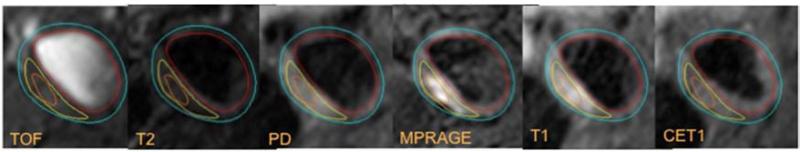
MRI example of IPH. intra-plaque hemorrhage in orange appears isointense on the TOF, T2, PDW and hyperintensity on MPRAGE and T1W images.
Logistic regression analysis of AHA type-VI lesions are shown in Table 4. Type-VI lesions were significantly associated with older age, a longer duration of statin treatment, cerebrovascular disease, and increased %WV in the univariate analysis. After adjusting for age, Lp(a) level and %WV were significantly associated with increased likelihood of type-VI lesions while metabolic syndrome showed a negative association. Further multivariate adjustments beyond age were not made due to the small number of type-VI lesions (n=23).
Table 4.
Associations between clinical factors and AHA type-VI lesions (N=214).
| AHA type-VI lesion |
Model 1 (Univariate) |
Model 2 (Age-adjusted) |
||||||
|---|---|---|---|---|---|---|---|---|
| Variable | Present (N=23) |
Absent (N=191) |
Odds Ratio* | (95% CI) | p-Value | Adjusted Odds Ratio* |
(95% CI) | p-Value |
| Age (years) | 71 ± 6 | 60 ± 8 | 2.6 | (1.8, 3.9) | <0.001 | - | - | |
|
| ||||||||
| Male | 20 (87%) | 155 (81%) | 1.5 | (0.4, 5.5) | 0.50 | 3.5 | (0.9, 14.3) | 0.081 |
| Female | 3 (13%) | 36 (19%) | (ref) | (ref) | ||||
|
| ||||||||
| White | 23 (100%) | 164 (86%) | ∞ | - | 0.085‡ | - | - | |
| Non-white/Other | 0 (0%) | 26 (14%) | (ref) | |||||
|
| ||||||||
| Hispanic or Latino | 0 (0%) | 10 (5%) | 0 | - | 0.61‡ | - | - | |
| Not Hispanic or Latino | 23 (100%) | 180 (95%) | (ref) | |||||
|
| ||||||||
| Duration of statin therapy | 0.016 | 0.19 | ||||||
| None or <1 year | 1 (5%) | 57 (30%) | (ref) | (ref) | ||||
| 1 - 5 years | 6 (29%) | 70 (37%) | 4.9 | (0.6, 42) | 3.3 | (0.3, 31.5) | ||
| >5 years | 14 (67%) | 61 (32%) | 13 | (1.7, 103) | 6.1 | (0.7, 53.1) | ||
|
| ||||||||
| Prior cerebrovascular disease | 9 (39%) | 25 (13%) | 4.3 | (1.7, 11) | 0.002 | 4.1 | (1.4, 12.4) | 0.011 |
| Stroke or transient ischemic attack | 5 (22%) | 16 (8%) | 3.0 | (1.0, 9.3) | 0.051 | 2.2 | (0.6, 7.8) | 0.21 |
| Carotid disease | 8 (35%) | 15 (8%) | 6.3 | (2.3, 17) | <0.001 | 7.2 | (2.1, 24.9) | 0.002 |
|
| ||||||||
| Hypertension | 21 (91%) | 157 (82%) | 2.3 | (0.5, 10) | 0.28 | 2.2 | (0.4, 11.0) | 0.34 |
| Smoker | 18 (78%) | 133 (70%) | 1.6 | (0.6, 4.4) | 0.39 | 2.6 | (0.8, 8.3) | 0.12 |
| Diabetes mellitus | 5 (22%) | 48 (25%) | 0.8 | (0.3, 2.3) | 0.72 | 0.6 | (0.2, 1.9) | 0.36 |
| Metabolic syndrome (+) | 15 (68%) | 160 (84%) | 0.4 | (0.2, 1.1) | 0.078 | 0.2 | (0.1, 0.8) | 0.019 |
|
| ||||||||
| Body mass index (kg / m2) | 29 ± 4 | 30 ± 5 | 0.7 | (0.4, 1.1) | 0.13 | 0.8 | (0.5, 1.4) | 0.47 |
| Systolic blood pressure (mmHg) | 134 ± 17 | 127 ± 17 | 1.4 | (0.9, 2.2) | 0.099 | 1.1 | (0.7, 1.9) | 0.70 |
| Diastolic blood pressure (mmHg) | 74 ± 10 | 75 ± 10 | 0.9 | (0.6, 1.5) | 0.78 | 1.2 | (0.7, 2.1) | 0.42 |
| Total cholesterol (mg/dl)† | 147 | 143 | 1.2 | (0.8, 1.8) | 0.42 | 1.0 | (0.6, 1.7) | 0.95 |
| Non-HDL cholesterol (mg/dl)† | 107 | 107 | 1.2 | (0.8, 1.8) | 0.49 | 1.0 | (0.6, 1.7) | 0.94 |
| LDL cholesterol (mg/dl)† | 74 | 73 | 1.5 | (0.9, 2.3) | 0.096 | 1.3 | (0.8, 2.3) | 0.31 |
| HDL cholesterol (mg/dl) | 36 ± 5 | 35 ± 6 | 1.2 | (0.8, 1.9) | 0.42 | 0.9 | (0.5, 1.4) | 0.55 |
| Triglycerides (mg/dl)† | 133 | 162 | 0.7 | (0.4, 1.1) | 0.11 | 0.6 | (0.3, 1.1) | 0.079 |
| Lipoprotein(a) (mg/dl)† | 116 | 32 | 1.5 | (0.9, 2.4) | 0.13 | 2.0 | (1.1, 3.6) | 0.019 |
| ApoB (mg/dl) | 92 ± 22 | 85 ± 23 | 1.3 | (0.9, 1.9) | 0.23 | 1.1 | (0.7, 1.8) | 0.58 |
| ApoA1 (mg/dl) | 123 ± 14 | 121 ± 17 | 1.1 | (0.7, 1.7) | 0.64 | 0.8 | (0.5, 1.4) | 0.50 |
| %Wall volume (%)† | 52 | 40 | 5.4 | (2.8, 10) | <0.001 | 4.6 | (2.3, 9.1) | <0.001 |
Data for AHA type-IV lesion present and absent groups are presented as mean ± standard deviation, median or n (%);
Model 2: each variable adjusted for age. Other covariates were not included due to small number of AHA type VI lesions;
(ref) = reference category;
For continuous variables, the odds ratio is scaled to correspond to the effect of a 1 standard deviation increase, except age which is presented per a 5 year increase;
Log-transformed in models 1 and 2 to reduce right-skewness;
Fisher’s exact test because of a zero or infinite odds ratio estimate.
Table 5a shows that presence of LRNC was significantly positively associated with male gender, white race and %WV, but significantly negatively associated with diabetes, BMI, HDL-C and ApoA1 levels in the univariate models (Model 1) that included all the variables listed in Table 4. After adjusting for age, gender and %WV, diabetes and HDL-C remained statistically significant (Model 2). The final multivariate model (Model 3) showed that the risk of having LRNC was increased by 3.2 fold (odds ratio) in males, and by 3.8-fold with each 1 SD increase in %WV. The risk of having LRNC was 60% less in subjects with diabetes and 30% less with each 1 SD increase in HDL-C level.
Table 5.
Clinical factors significantly associated with (a) presence of lipid-rich necrotic core (LRNC) (N=214) and (b) increased %LRNC in those with LRNC present (N=112).
| (a) Presence of LRNC |
LRNC |
Model 1 (Univariate) |
Model 2 (Adjusted) |
Model 3 (Multivariate) |
|||||||
|---|---|---|---|---|---|---|---|---|---|---|---|
| Variable | Present (N=112) |
Absent (N=102) |
Odds Ratio* |
(95% CI) | p- Value |
Adjusted Odds Ratio* |
(95% CI) | p- Value |
Adjusted Odds Ratio* |
(95% CI) | p- Value |
| Age (years) | 62 ± 9 | 61 ± 8 | 1.1 | (0.9, 1.3) | 0.39 | 1.0 | (0.8, 1.2) | 0.83 | 1.1 | (0.9, 1.3) | 0.45 |
|
| |||||||||||
| Male | 101 (90%) |
74 (73%) | 3.5 | (1.6, 7.4) | 0.001 | 5.0 | (2.0, 12) | <0.001 | 3.2 | (1.2, 8.1) | 0.017 |
| Female | 11 (10%) | 28 (27%) | (ref) | (ref) | (ref) | ||||||
|
| |||||||||||
| White | 105 (94%) |
82 (81%) | 3.5 | (1.4, 8.7) | 0.008 | 2.6 | (0.9, 7.7) | 0.074 | |||
| Non-white/Other | 7 (6%) | 19 (19%) | (ref) | (ref) | |||||||
|
| |||||||||||
| Duration of statin therapy |
0.56 | 0.22 | |||||||||
| <1 year | 31 (28%) | 27 (27%) | (ref) | (ref) | |||||||
| 1 - 5 years | 36 (33%) | 40 (40%) | 0.8 | (0.4, 1.6) | 0.6 | (0.3, 1.4) | |||||
| >5 years | 42 (39%) | 33 (33%) | 1.1 | (0.6, 2.2) | 0.4 | (0.2, 1.1) | |||||
|
| |||||||||||
| Diabetes mellitus | 20 (18%) | 33 (32%) | 0.5 | (0.2, 0.9) | 0.015 | 0.5 | (0.2, 1.0) | 0.041 | 0.4 | (0.2, 0.9) | 0.022 |
| Body mass Index (kg / m2) |
29 ± 4 | 31 ± 5 | 0.7 | (0.5, 0.9) | 0.005 | 0.8 | (0.5, 1.1) | 0.11 | |||
| HDL cholesterol (mg/dl) |
34 ± 5 | 36 ± 6 | 0.7 | (0.5, 0.9) | 0.015 | 0.7 | (0.5, 1.0) | 0.037 | 0.7 | (0.5, 0.9) | 0.020 |
| ApoA1 (mg/dl) | 119 ± 16 | 124 ± 17 | 0.7 | (0.6, 1.0) | 0.039 | 0.8 | (0.6, 1.1) | 0.18 | |||
| %Wall volume (%)† | 44 | 37 | 3.4 | (2.3, 5.1) | <0.001 | 3.6 | (2.4, 5.5) | <0.001 | 3.8 | (2.5, 5.9) | <0.001 |
|
| |||||||||||
|
(b) Increased
%LRNC† |
Model 1
(Univariate) |
Model 2
(Adjusted) |
Model 3
(Multivariate) |
||||||||
| Variable | β * | (95% CI) |
p-
Value |
Adj. β* | (95% CI) |
p-
Value |
Adj. β* | (95% CI) |
p-
Value |
||
|
| |||||||||||
| Age | 0.11 | (0.01, 0.21) |
0.038 | 0.06 | (−0.03, 0.16) |
0.20 | 0.10 | (0.00, 0.20) | 0.051 | ||
| Male gender | 0.43 | (−0.20, 1.05) |
0.18 | 0.48 | (−0.10, 1.06) |
0.10 | 0.49 | (−0.07, 1.05) | 0.088 | ||
| Smoker | 0.34 | (−0.07, 0.76) |
0.11 | 0.38 | (0.00, 0.76) |
0.049 | 0.28 | (−0.10, 0.67) | 0.15 | ||
| Triglycerides† | −0.20 | (−0.39, − 0.02) |
0.032 | −0.14 | (−0.32, 0.03) |
0.11 | |||||
| ApoA1 | −0.17 | (−0.35, 0.02) |
0.084 | −0.22 | (−0.40, − 0.05) |
0.012 | −0.20 | (−0.38, −0.02) | 0.032 | ||
| %Wall volume† | 0.38 | (0.21, 0.56) |
<0.001 | 0.36 | (0.18, 0.54) |
<0.001 | 0.36 | (0.19, 0.53) | <0.001 | ||
Data for LRNC present and absent groups are presented as mean ± standard deviation, median or n (%);
Model 2: each variable adjusted for age, gender and log(%wall volume);
Model 3: final multivariate model with age, gender, log(%wall volume) and significant model 2 variables;
(ref) = reference category.
For continuous independent variables, the OR or β (linear regression coefficient) is scaled to correspond to the effect of a 1 standard deviation increase, except age which is presented per a 5 year increase; the log(%LRNC) outcome variable was also rescaled to have standard deviation = 1;
Log-transformed in each model to reduce right-skewness.
Percent LRNC was log-transformed for the regression analysis. In the 112 (52%) subjects with measurable LRNC, increased %LRNC was significantly associated with older age, history of smoking, lower level of triglycerides and ApoA1 and larger %WV (Models 1 & 2) as shown in Table 5b. In the final multivariate model (Model 3) which included adjustments for age, gender and %WV, only ApoA1 (regression coefficient=−0.20 per 1 SD increase, p=0.03) and %WV (regression coefficient=0.36 per 1 SD increase, p<0.001) remained significant.
Discussion
Among patients with established vascular disease and well treated for LDL-C and blood pressure in AIM-HIGH, 77% had carotid plaques, 52% of subjects had lipid-containing plaques, 11% had advanced, AHA type VI lesions with IPH, surface defect or thrombus, and 12% showed high-risk plaques using CAS. However, the mean %WV was 42±7% indicating the carotid stenosis was not severe. Subjects qualified for this study if they had a history of dyslipidemia and major vascular disease, not exclusively carotid atherosclerosis, and yet a significant proportion were found to have advanced carotid plaque features despite the prior use of statin and well-controlled LDL-C at baseline. These observations in plaque morphology suggest the study population was at increased residual CV risk and are consistent with significant CV event rate in AIM-HIGH [15]. These are also consistent with previous findings that high-risk plaque features are often seen in less severe stenosis. In an MR angiography study [21] of carotid arteries with 0% stenosis, LRNC was present in 67.4% and IPH in 8.7% of non-occlusive lesions.
Histopathology studies demonstrate that women’s atherosclerotic plaques are more prone to plaque erosion than frank rupture compared to men. Furthermore, women more often have less calcification, less severe stenosis and fewer inflammatory cells, but more smooth muscle cells and more eccentric coronary plaque than men [22,23]. Gender difference in plaque characteristics was reported in a carotid MRI study of 131 patients (67 men, 64 women) with ≥50% asymptomatic carotid stenosis on duplex ultrasound [24]. That study showed that men had significantly higher frequency of LRNC compared to women (73% vs. 50%, adjusted OR=3.66, p=0.01) and higher incidence of thin/ruptured fibrous cap (48% vs. 17%, adjusted OR=4.41, p<0.01). Our study in subjects with less severe carotid stenosis also showed that male gender was significantly and independently associated with increased risk for presence of LRNC (OR=3.2, p=0.017).
The current study identified Lp(a), HDL-C or ApoA1 as independent factors associated with high-risk plaque features. The AIM-HIGH main trial demonstrated that Lp(a) predicted residual cardiovascular events in subjects treated with statin alone or statin plus extended-release niacin [25]. These findings together indicate that Lp(a) can be used for identification of high-risk populations and be a potential therapeutic target. Total cholesterol and LDL-C levels which were correlated with presence of a lipid core and with greater lipid core volume in the Multi-Ethnic Study of Atherosclerosis (MESA) [26] and the Atherosclerosis Risk in Communities Study (ARIC) [27] were not identified as factors associated with adverse plaque characteristics in the current study in subjects with established clinical vascular disease and well-treated LDL-C to a mean level <80 mg/dl. On the other hand, lower HDL-C or ApoA1 are associated with presence of high-risk plaque features which were also reported previously [28,29], however, whether HDL-C or ApoA1 increase lead to more stable plaques contributing to reduced cardiovascular events remains as a subject of interest.
Surprisingly, metabolic syndrome and diabetes appear to be negatively associated with high-risk plaque features in this analysis. Among the published studies, only ARIC [27] showed that the measured glucose and body mass index were inversely associated fibrous cap thickness. This unexpected result in the current study could be due to a combination of the following reasons, which could not be thoroughly investigated due to the small number of patients with high-risk features: (1) there were more females with metabolic syndrome or diabetes than males in the MRI sub-study; the negative association may have been influenced by the gender difference in plaque features. (2) It is likely that high-risk diabetic or metabolic syndrome subjects with the greatest unstable plaque had an event that excluded them from participation in the study due to subject enrollment bias. (3) By chance, fewer diabetic subjects were enrolled in the MRI sub-study compared to the main trial, which raises concern whether the negative association with diabetes and high-risk plaque features observed in the MRI sub-study can be generalized to the larger study population. Furthermore, the eGFR requirement and willingness and ability to participate in the sub-study might have self-selected the population with bias towards to a healthier group of subjects who were younger, with lower BMI and fewer diabetics as described in Table 2. A larger sample size might not make the sub-study population more similar to the entire AIM-HIGH cohort due to the sub-study selection bias.
Finally, high-resolution MRI can accurately assess plaque burden and tissue contents [7-9] and can identify high-risk plaque features that are associated with CV events [10-13]. In order to utilize MRI in multi-center investigation of atherosclerosis, critical elements are required: establishing a standardized scan protocol, technical training, image quality control, protocol adherence, and image analysis by a core Lab. These were achieved in the AIM-HIGH carotid MRI sub-study. A network with 21 clinical sites and 10 MRI scan facilities with GE or Philips 3T whole body scanners was successfully established through this sub-study in the US and Canada and is ready to be utilized for future clinical investigations in atherosclerosis.
Supplementary Material
Highlights.
This study found that among patients with established vascular disease and well treated for LDL-C and blood pressure in AIM-HIGH, 77% had carotid plaques, 52% of subjects had lipid-containing plaques, and 11% had advanced, AHA type VI lesions with intraplaque hemorrhage, surface defect or thrombus. Subjects qualified for this study if they had a history of dyslipidemia and major vascular disease, not exclusively carotid atherosclerosis, and yet a significant proportion were found to have advanced carotid plaque features despite the prior use of statin and well-controlled LDL-C at baseline. These observations in plaque morphology suggest the study population was at increased residual cardiovascular (CV) risk and are consistent with significant CV event rate in AIM-HIGH.
Acknowledgments
The carotid MRI sub-study was funded by R01 HL088214. MR imaging coils were provided by GE Healthcare and Philips Healthcare.
We appreciate support from the AIM-HIGH Study, Principal Investigators: B. Gregory Brown, MD, PhD (retired); Jeffrey L. Probstfield, MD; William E. Boden, MD.
We would like to thank the investigators who were instrumental in recruiting subjects and obtaining the MR images. Participating institutions, investigators and coordinators are listed in Appendix.
Appendix. Site location, PI and coordinator information
21 AIM-HIGH Sites (by site #)
9 - Duke University - John Guyton, Shubi Khan; 10 - University of Calgary - Todd Anderson, Bev Madden; 14/30 - University of Pennsylvania / Philadelphia VA - Richard Dunbar, Dalia Roberts, Monica Williams; 15 - University of Southern California - Colletti, Andrea Contreras; 21 - University of Western Ontario - William Kostuk, Cathy Bone; 43 - University of Maryland - Michael Miller, Abby Roberts; 47 - University of Washington Cardiology - Xue-Qiao Zhao, Kevin O'Brien, Suzanne Williams; 48 - University of Washington NW Lipid Research Center - Robert Knopp, Pathmaja Paramsothy, Alice Dowdy, Barbara Twaddell; 49 - Long Beach VA - Moti Kahyap, Olaf Fallye, Sunil Kakadia; 51 - Puget Sound VA - Kenneth Lehmann, Julie LaGuire; 53 - Vancouver General Hospital - Anthony Fung, Rebecca Fox, Linda Axen; 55 - Wake Forest University Endocrinology - Robin Crouse, Donna Davis; 56 - Wake Forest University Geriatrics - Jamehl Demons, Tricia Wittmer; 58 - Wake Forest University Cardiology - David Herrington, Vickie Wayne, Lynda Doomy; 62 - Baylor College of Medicine - Peter Jones, Terry Techmanski, Diane Tanksley; 71 - Cardiovascular Consultants - Chris Geohas, Rose Prasad, Annie Laborin; 74 - Mayo Clinic - Stephen Kopecky, Cindy Woltman, Dawn Shelstad; 77 - Johns Hopkins University - Peter Kwiterovich, Kathleen Byrne; 78 - Heart Health Institute - Patrick Ma, Maureen McRae, Donna Louch; 79 - Methodist Hospital - Alan Hoffman, Mary Rangel; 86 - Kelsey Research Foundation - Haroon-Ur Harry Rashid, Stacy Meadows.
10 MRI Centers (alphabetical)
BAR - Barrows Neurological Institute - Jim Pipe, Sharmeen Joomun; BAY - Baylor School of Medicine - Joel Morrisett, Karima Ghazzaly; CAL - University of Calgary - Richard Frayne, Brian O'Brien, Frances Raymond; JHU - Johns Hopkins University - Bruce Wasserman, Rena Geckle; MAY - Mayo Clinic - John Huston, Mandie Maroney-Smith; ROB - Robarts Research Institute - Brian Rutt, Cyndi Harper Little; UBC - University of British Columbia - Alex MacKay, Linda Chandler; UOW - University of Washington - Chun Yuan, Baocheng Chu, Niranjan Balu; USC - University of Southern California - Patrick Colletti, Samuel Valencerina; WFU - Wake Forest University - J. Robin Crouse, J. Greg Terry.
Footnotes
Publisher's Disclaimer: This is a PDF file of an unedited manuscript that has been accepted for publication. As a service to our customers we are providing this early version of the manuscript. The manuscript will undergo copyediting, typesetting, and review of the resulting proof before it is published in its final citable form. Please note that during the production process errors may be discovered which could affect the content, and all legal disclaimers that apply to the journal pertain.
References
- 1.Shinnar M, Fallon JT, Wehrli S, Levin M, Dalmacy D, Fayad ZA, Badimon JJ, Harrington M, Harrington E, Fuster V. The diagnostic accuracy of ex vivo MRI for human atherosclerotic plaque characterization. Arterioscler Thromb Vasc Biol. 1999;19:2756–2761. doi: 10.1161/01.atv.19.11.2756. [DOI] [PubMed] [Google Scholar]
- 2.Yuan C, Mitsumori LM, Ferguson MS, Polissar NL, Echelard D, Ortiz G, Small R, Davies JW, Kerwin WS, Hatsukami TS. In vivo accuracy of multispectral magnetic resonance imaging for identifying lipid-rich necrotic cores and intraplaque hemorrhage in advanced human carotid plaques. Circulation. 2001;104:2051–2056. doi: 10.1161/hc4201.097839. [DOI] [PubMed] [Google Scholar]
- 3.Mitsumori LM, Hatsukami TS, Ferguson MS, Kerwin WS, Cai J, Yuan C. In vivo accuracy of multisequence MR imaging for identifying unstable fibrous caps in advanced human carotid plaques. J Magn Reson Imaging. 2003;17:410–420. doi: 10.1002/jmri.10264. [DOI] [PubMed] [Google Scholar]
- 4.Cappendijk VC, Cleutjens KB, Kessels AG, Heeneman S, Schurink GW, Welten RJ, Mess WH, Daemen MJ, van Engelshoven JM, Kooi ME. Assessment of human atherosclerotic carotid plaque components with multisequence MR imaging: initial experience. Radiology. 2005;234:487–492. doi: 10.1148/radiol.2342032101. [DOI] [PubMed] [Google Scholar]
- 5.Saam T, Cai JM, Cai YQ, An NY, Kampschulte A, Xu D, Kerwin WS, Takaya N, Polissar NL, Hatsukami TS, Yuan C. Carotid plaque composition differs between ethno-racial groups: an MRI pilot study comparing mainland Chinese and American Caucasian patients. Arterioscler Thromb Vasc Biol. 2005;25:611–616. doi: 10.1161/01.ATV.0000155965.54679.79. [DOI] [PubMed] [Google Scholar]
- 6.Clarke SE, Hammond RR, Mitchell JR, Rutt BK. Quantitative assessment of carotid plaque composition using multicontrast MRI and registered histology. Magn Reson Med. 2003;50:1199–1208. doi: 10.1002/mrm.10618. [DOI] [PubMed] [Google Scholar]
- 7.Cai JM, Hatsukami TS, Ferguson MS, Small R, Polissar NL, Yuan C. Classification of human carotid atherosclerotic lesions with in vivo multicontrast magnetic resonance imaging. Circulation. 2002;106:1368–1373. doi: 10.1161/01.cir.0000028591.44554.f9. [DOI] [PubMed] [Google Scholar]
- 8.Takaya N, Cai J, Ferguson MS, Yarnykh VL, Chu B, Saam T, Polissar NL, Sherwood J, Cury RC, Anders RJ, Broschat KO, Hinton D, Furie KL, Hatsukami TS, Yuan C. Intra- and interreader reproducibility of magnetic resonance imaging for quantifying the lipid-rich necrotic core is improved with gadolinium contrast enhancement. J Magn Reson Imaging. 2006;24:203–210. doi: 10.1002/jmri.20599. [DOI] [PubMed] [Google Scholar]
- 9.Cai J, Hatsukami TS, Ferguson MS, Kerwin WS, Saam T, Chu B, Takaya N, Polissar NL, Yuan C. In Vivo Quantitative Measurement of Intact Fibrous Cap and Lipid Rich Necrotic Core Size in Atherosclerotic Carotid Plaque: A Comparison of High Resolution Contrast Enhanced MRI and Histology. Circulation. 2005;112:3437–3444. doi: 10.1161/CIRCULATIONAHA.104.528174. [DOI] [PubMed] [Google Scholar]
- 10.Takaya N, Yuan C, Chu B, Saam T, Underhill H, Cai J, Tran N, Polissar NL, Isaac C, Ferguson MS, Garden GA, Cramer SC, Maravilla KR, Hashimoto B, Hatsukami TS. Association between carotid plaque characteristics and subsequent ischemic cerebrovascular events: a prospective assessment with MRI – initial results. Stroke. 2006;37:818–823. doi: 10.1161/01.STR.0000204638.91099.91. [DOI] [PubMed] [Google Scholar]
- 11.Singh N, Moody AR, Gladstone DJ, Leung G, Ravikumar R, Zhan J, Maggisano R. Moderate carotid artery stenosis: MRI depicted intraplaque hemorrhage predicts risk of cerebrovascular ischemic events in asymptomatic men. Radiology. 2009;252:502–508. doi: 10.1148/radiol.2522080792. [DOI] [PubMed] [Google Scholar]
- 12.Altaf N, Daniels L, Morgan PS, Auer D, MacSweeney ST, Moody AR, Gladman JR. Detection of intraplaque hemorrhage by magnetic resonance imaging in symptomatic patients with mild to moderate carotid stenosis predicts recurrent neurological events. J Vasc Surg. 2008;47:337–342. doi: 10.1016/j.jvs.2007.09.064. [DOI] [PubMed] [Google Scholar]
- 13.Virani SS, Sun W, Dodge R, Nambi V, Coresh J, Mosley TH, Sharrett A, Boerwinkle E, Ballantyne CM, Wasserman BA. Carotid Artery Plaque Burden and Characteristics and Subsequent Risk of Incident Cardiovascular Events: The Atherosclerosis Risk in Communities (ARIC) Carotid Magnetic Resonance Imaging Study. Reported at AHA 2013.
- 14.The AIM-HIGH Investigators The role of niacin in raising high-density lipoprotein cholesterol to reduce cardiovascular events in patients with atherosclerotic cardiovascular disease and optimally treated low-density lipoprotein cholesterol Rationale and study design. The Atherothrombosis Intervention in Metabolic syndrome with low HDL/high triglycerides: Impact on Global Health outcomes (AIM-HIGH) Am Heart J. 2011;161:471–477. doi: 10.1016/j.ahj.2010.11.017. [DOI] [PMC free article] [PubMed] [Google Scholar]
- 15.The AIM-HIGH Investigators Niacin in Patients with Low HDL Cholesterol Levels Receiving Intensive Statin Therapy. N Engl J Med. 2011;365:2255–2267. doi: 10.1056/NEJMoa1107579. [DOI] [PubMed] [Google Scholar]
- 16.Underhill H, Yarnykh V, Hatsukami T, Wang J, Balu N, Hayes C, Oikawa M, Yu W, Xu D, Chu B, Wyman BT, Polissar NL, Yuan C. Carotid plaque morphology and composition: Initial comparison between 1.5- and 3.0-T magnetic field strengths. Radiology. 2008;248:550–560. doi: 10.1148/radiol.2482071114. [DOI] [PMC free article] [PubMed] [Google Scholar]
- 17.Kerwin WS, Han C, Chu B, Xu D, Luo Y, Hwang JN, Hatsukami TS, Yuan C. Medical Image Computing and Computer-Assisted Intervention-MICCAI 2001. Springer; Berlin, Germany: 2001. A quantitative vascular analysis system for evaluation of atherosclerotic lesions by MRI; pp. 786–794. [Google Scholar]
- 18.Underhill HR, Hatsukami TS, Cai J, Yu W, DeMarco JK, Polissar NL, Ota H, Zhao X, Dong L, Oikawa M, Yuan C. A noninvasive imaging approach to assess plaque severity: the Carotid Atherosclerosis Score. AJNR Am J Neuroradiol. 2010;31:1068–1075. doi: 10.3174/ajnr.A2007. [DOI] [PMC free article] [PubMed] [Google Scholar]
- 19.Xu D, Hippe DS, Underhill HR, Oikawa-Wakayama M, Dong L, Yamada K, Yuan C, Hatsukami TS. Prediction of high-risk plaque development and plaque progression with the carotid atherosclerosis score. JACC Cardiovasc Img. 2014;7:366–373. doi: 10.1016/j.jcmg.2013.09.022. [DOI] [PMC free article] [PubMed] [Google Scholar]
- 20.R: A language and environment for statistical computing. R Foundation for Statistical Computing; Vienna, Austria: R Core Team version 2.14.1. [Google Scholar]
- 21.Dong L, Underhill HR, Yu W, Ota H, Hatsukami TS, Gao TL, Zhang Z, Oikawa M, Zhao X, Yuan C. Geometric and compositional appearance of atheroma in an angiographically normal carotid artery in patients with atherosclerosis. AJNR Am J Neuroradiol. 2010;31:311–316. doi: 10.3174/ajnr.A1793. [DOI] [PMC free article] [PubMed] [Google Scholar]
- 22.Arbustini E, Dal Bello B, Morbini P, Burke AP, Bocciarelli M, Specchia G, Virmani R. Plaque erosion is a major substrate for coronary thrombosis in acute myocardial infarction. Heart. 1999;82:269–272. doi: 10.1136/hrt.82.3.269. [DOI] [PMC free article] [PubMed] [Google Scholar]
- 23.Farb A, Burke AP, Tang AL, Liang TY, Mannan P, Smialek J, Virmani R. Coronary plaque erosion without rupture into a lipid core. A frequent cause of coronary thrombosis in sudden coronary death. Circulation. 1996;93:1354–1363. doi: 10.1161/01.cir.93.7.1354. [DOI] [PubMed] [Google Scholar]
- 24.Ota H, Reeves MJ, Zhu DC, Majid A, Collar A, Yuan C, DeMarco JK. Sex differences in patients with asymptomatic carotid atherosclerotic plaque: in vivo 3.0-T magnetic resonance study. Stroke. 2010;41:1630–1635. doi: 10.1161/STROKEAHA.110.581306. [DOI] [PubMed] [Google Scholar]
- 25.Albers JJ, Slee A, O'Brien KD, Robinson JG, Kashyap ML, Kwiterovich PO, Jr, Xu P, Marcovina SM. Relationship of apolipoproteins A-1 and B, and lipoprotein(a) to cardiovascular outcomes: the AIM-HIGH Trial (Atherothrombosis Intervention in Metabolic Syndrome with Low HDL/High Triglyceride and Impact on Global Health Outcomes) J Am Coll Cardiol. 2013;62:1575–1579. doi: 10.1016/j.jacc.2013.06.051. [DOI] [PMC free article] [PubMed] [Google Scholar]
- 26.Wasserman BA, Sharrett AR, Lai S, Gomes AS, Cushman M, Folsom AR, Bild DE, Kronmal RA, Sinha S, Bluemke DA. Risk factor associations with the presence of a lipid core in carotid plaque of asymptomatic individuals using high-resolution MRI: the Multi-Ethnic Study of Atherosclerosis (MESA) Stroke. 2008;39:329–335. doi: 10.1161/STROKEAHA.107.498634. [DOI] [PubMed] [Google Scholar]
- 27.Wagenknecht L, Wasserman BA, Chambless L, Coresh J, Folsom A, Mosley T, Ballantyne C, Sharrett R, Boerwinkle E. Correlates of Carotid Plaque Presence and Composition as Measured by MRI: The Atherosclerosis Risk in Communities Study. Circ Cardiovasc Imaging. 2009;2:314–322. doi: 10.1161/CIRCIMAGING.108.823922. [DOI] [PMC free article] [PubMed] [Google Scholar]
- 28.Desai MY, Rodriguez A, Wasserman BA, Gerstenblith G, Agarwal S, Kennedy M, Bluemke DA, Lima JA. Association of cholesterol subfractions and carotid lipid core measured by MRI. Arterioscler Thromb Vasc Biol. 2005;25:e110–111. doi: 10.1161/01.ATV.0000166599.78182.6c. [DOI] [PubMed] [Google Scholar]
- 29.Phan BA, Chu B, Polissar N, Hatsukami TS, Yuan C, Zhao XQ. Association of high-density lipoprotein levels and carotid atherosclerotic plaque characteristics by magnetic resonance imaging. Int J Cardiovasc Imaging. 2007;23:337–342. doi: 10.1007/s10554-006-9175-7. [DOI] [PubMed] [Google Scholar]
Associated Data
This section collects any data citations, data availability statements, or supplementary materials included in this article.