

Abstract
Purpose
Optimizing evidence-based care to improve quality is a critical priority in the United States. We sought to examine adherence to imaging guideline recommendations for staging in patients with locally advanced lung cancer in a national cohort.
Methods
We identified 3,808 patients with stage IIB, IIIA, or IIIB lung cancer by using the national Department of Veterans Affairs (VA) Central Cancer Registry (2004-2007) and linked these patients to VA and Medicare databases to examine receipt of guideline-recommended imaging based on National Comprehensive Cancer Network and American College of Radiology Appropriateness Criteria. Our primary outcomes were receipt of guideline-recommended brain imaging and positron emission tomography (PET) imaging. We also examined rates of overuse defined as combined use of bone scintigraphy (BS) and PET, which current guidelines recommend against. All imaging was assessed during the period 180 days before and 180 days after diagnosis.
Results
Nearly 75% of patients received recommended brain imaging, and 60% received recommended PET imaging. Overuse of BS and PET occurred in 25% of patients. More advanced clinical stage and later year of diagnosis were the only clinical or demographic factors associated with higher rates of guideline-recommended imaging after adjusting for covariates. We observed considerable regional variation in recommended PET imaging and overuse of combined BS and PET.
Conclusion
Receipt of guideline-recommended imaging is not universal. PET appears to be underused overall, whereas BS demonstrates continued overuse. Wide regional variation suggests that these findings could be the result of local practice patterns, which may be amenable to provider education efforts such as Choosing Wisely.
INTRODUCTION
Health care costs in the United States continue to increase at an alarming rate, prompting increased emphasis on cost containment, guideline-driven care, and quality metrics. Cancer-related imaging has received significant attention as a source of inappropriate use and as a potential target for reducing expenditures.1–5 Inefficiencies in imaging include overuse and underuse of recommended tests and test duplication, which vary significantly by region.6,7
Lung cancer diagnosis and staging includes multiple imaging modalities. Many of the peridiagnostic examinations being performed may be inconsistent with national guideline recommendations, which contributes to inappropriate care and overspending as a burden to the health care system. Several national organizations and multidisciplinary panels have outlined appropriate diagnostic, staging, and treatment algorithms in an attempt to standardize care. National Comprehensive Cancer Network (NCCN) guidelines8 and American College of Radiology (ACR) Appropriateness Criteria 9 are examples of two such guidelines that have the intention of enhancing quality and efficacy of health care delivery. The guidelines are evidence based and emphasize appropriate use of testing for accurate staging and tailoring of therapeutic interventions with an aim of reducing unnecessary treatments.10 Little is known about the level of adherence to these published guidelines within routine clinical practice. We sought to assess rates of guideline-recommended imaging for patients with lung cancer in a universal access health care system.
METHODS
Study Population
Data were obtained from a national cohort of patients with lung cancer identified through the Department of Veterans Affairs (VA) Central Cancer Registry from 2004 to 2007 from all VA centers. We identified all imaging performed in VA facilities as well as care received in community imaging centers paid for by the VA through the VA's Fee Basis program. In addition, we obtained Medicare claims to capture health care use in non-VA facilities paid for by Medicare for veterans who were dually eligible for VA and Medicare services. A total of 23,425 patients diagnosed with lung cancer between October 1, 2004, and September 30, 2007, in a VA medical center were identified. Patients were excluded if their diagnosis during this period was a recurrence or secondary lung malignancy (n = 4,473), the diagnosis was identified by autopsy or death certificate only (n = 274), the patient had uncommon histology (n = 1,353), or data were incomplete for the patient or the facility (n = 1,826). We restricted the analysis to patients with stage IIB, IIIA, and IIIB (n = 11,691 patients excluded). Finally, we excluded patients who died within 6 months of diagnosis, which resulted in the final analytic cohort of 3,808 patients.
Guidelines and Definition of Appropriateness Criteria
We examined three components of imaging related to the ACR Appropriateness Criteria9 and the NCCN Clinical Practice Guidelines in Oncology.11
First, we defined appropriate use of brain imaging as receipt of brain magnetic resonance imaging or brain computed tomography (CT) scan within the peridiagnostic study window. Both ACR and NCCN recommend brain imaging for patients with lung cancer with clinical stage IIB, IIIA, or IIIB disease. Second, we defined receipt of recommended positron emission tomography (PET) imaging if a patient received any PET or combined PET-CT imaging during the study window. Both national guidelines recommend that PET be performed for routine clinical staging of patients with lung cancer within our stage groups. Third, we defined overuse as receipt of bone scintigraphy (BS) in addition to PET imaging having been performed within the study window. Both agencies recommend against BS if a PET scan was also being performed, given the superior performance of PET for the detection of occult bone metastases and the enhanced ability of PET to provide information regarding nonosteogenic occult metastatic disease. Receipt of imaging was assessed for the observation period of 180 days before and 180 days after the date of diagnosis.
Patient Characteristics
We assessed patient demographic characteristics, including age at diagnosis, race, and marital status. Women, who made up less than 2% of the sample were combined with men to preserve anonymity of data. Sociodemographic information was included and was based on VA enrollment priority data. Veterans with a service-connected disability of greater than 50% or household income below geographic means test thresholds are exempt from copay. Comorbidity was assessed by using a set of eight conditions most relevant to the veteran population and patients with lung cancer modified from Charlson and Elixhauser comorbidity algorithms.12–14 International Classification of Diseases, 9th revision, codes were assessed for the 12-month period before diagnosis, as well as the VA problem list of chronic conditions maintained in the VA electronic medical record. An indicator for dual VA and Medicare enrollment before diagnosis was ascertained by identifying claims covered by Medicare of at least $50 in the 12-month period before diagnosis.
Facility Characteristics
Although patients can receive care at multiple VA facilities, we identified the facility in which the patient was diagnosed and included characteristics of that facility (n = 116). These included facility complexity, whether the facility was affiliated with a medical school, annual lung cancer case volume, geographic region, and the presence of a multidisciplinary tumor board. The VA defines facility complexity on the basis of population characteristics, clinical services offered, educational and research missions, and administrative complexity. Level 1 represents the most complex facilities (further subdivided into categories 1a to 1c), Level 2 is moderately complex, and Level 3 is the least complex.
Analysis
We examined imaging rates across patient demographic and clinical characteristics as well as across facility characteristics. Unadjusted comparisons across patient demographic and facility characteristic groups were performed by using the χ2 test. Multivariable logistic regression models estimate adjustments were used to assess the receipt of our three main imaging outcome variables across patient and facility covariates. Because the data involved clustering within 116 facilities, we used robust variance estimators to account for within-cluster correlation.
By using the adjusted logistic regression model, we calculated summary expected rates of imaging for each of the nine geographic regions (Appendix Table A1, online only) and compared these to observed rates (O:E ratio). This measure provides an assessment of whether use in an area is higher or lower than overall average. Values greater than 1.0 indicate higher-than-expected use rates of imaging based on the standard population. Values less than 1.0 indicate lower-than-expected use referenced to the standard population. We calculated 95% CIs for the O:E ratio based on 500 bootstrap replications. All analyses were performed in STATA 12.0 (STATA, College Station, TX).
RESULTS
The main study cohort consisted of 3,808 patients with stage IIB, IIIA, or IIIB lung cancer. The majority of patients were white (79%), with hypertension (64%) and chronic obstructive pulmonary disease (44%) as the most common comorbidities. Most facilities were affiliated with a medical school (93%; Table 1). Overall, guideline-recommended imaging was performed in 75% of patients for brain imaging and 60% of patients for PET imaging.
Table 1.
Patient Characteristics and Demographics for Overall Study Population
| Patient Characteristics | No. | % |
|---|---|---|
| Age, years | ||
| < 60 | 1,150 | 30.2 |
| 60-64 | 745 | 19.6 |
| 65-69 | 548 | 14.4 |
| 70-74 | 546 | 14.3 |
| ≥ 75 | 819 | 21.5 |
| Race/ethnicity | ||
| White | 2,995 | 78.7 |
| Black | 715 | 18.8 |
| Other | 41 | 1.0 |
| Unknown | 57 | 1.5 |
| Currently married | ||
| Yes | 1,763 | 46.3 |
| No | 2,045 | 53.7 |
| Comorbidities | ||
| Dementia | 128 | 3.4 |
| Depression | 803 | 21.1 |
| COPD | 1,689 | 44.4 |
| CHF | 333 | 8.7 |
| Diabetes | 910 | 23.9 |
| Hypertension | 2,449 | 64.3 |
| IHD | 1,299 | 34.1 |
| Other cancer | 799 | 21.0 |
| Clinical stage | ||
| IIB | 676 | 17.8 |
| IIIA | 1,329 | 34.9 |
| IIIB | 1,803 | 47.3 |
| Histology | ||
| Adenocarcinoma | 827 | 21.7 |
| Squamous cell | 1,377 | 36.2 |
| NSCLC, NOS | 1,059 | 27.8 |
| Bronchoalveolar | 43 | 1.1 |
| Small cell | 502 | 13.2 |
| Year of diagnosis | ||
| 2004 | 304 | 8.0 |
| 2005 | 1,247 | 32.8 |
| 2006 | 1,276 | 33.5 |
| 2007 | 980 | 25.7 |
| Hospital volume (cases per year) | ||
| < 30 | 391 | 10.3 |
| 30-60 | 1,249 | 32.8 |
| ≥ 60 | 2,168 | 56.9 |
| Medical school affiliation | ||
| Yes | 3,557 | 93.4 |
| No | 251 | 6.6 |
| Urban facility | 3,344 | 87.8 |
| Facility complexity | ||
| 1a | 1,584 | 41.6 |
| 1b | 776 | 20.4 |
| 1c | 621 | 16.3 |
| 2 | 634 | 16.7 |
| 3 | 193 | 5.0 |
| Region | ||
| New England | 137 | 3.6 |
| Mid-Atlantic | 324 | 8.5 |
| Great Lakes | 470 | 12.3 |
| North Plains | 278 | 7.3 |
| South Atlantic | 914 | 24.0 |
| Mississippi | 403 | 10.6 |
| South Plains | 604 | 15.9 |
| Great Basin | 247 | 6.5 |
| Pacific | 431 | 11.3 |
Abbreviations: CHF, congestive heart failure; COPD, chronic obstructive pulmonary disease; IHD, ischemic heart disease; NOS, not otherwise specified; NSCLC, non–small-cell lung cancer.
In unadjusted analyses, guideline adherence varied from 68% to 77% (P < .001) for brain imaging and from 48% to 70% (P < .001) for PET imaging between 2004 and 2007. Rates of overuse with combined BS and PET also varied over time ranging between 21% and 24%; however, this change was not statistically significant (P = .21; Table 2; Appendix Fig A1, online only). Patient characteristics associated with increased use of brain imaging were younger age (P = .02) and white race (P = .03), which were also associated with increased use of PET imaging (P < .01). Earlier clinical stage was associated with increased PET imaging (P < .01) and overuse of BS and PET (P < .01). White race was also associated with increased rates of overuse of BS and PET (P = .02; Table 2). The majority of patients seen at facilities with a medical school affiliation had lower rates of PET imaging compared with patients seen at other nonaffiliated facilities (50% v 65% P < .001; Table 2).
Table 2.
Unadjusted Imaging Frequency by Patient and Facility Characteristics
| Characteristic | Appropriate Imaging |
Overuse of BS-PET Imaging |
||||
|---|---|---|---|---|---|---|
| Brain Imaging |
PET Scan |
|||||
| Proportion | P | Proportion | P | Proportion | P | |
| Total No. of Patients (N = 3,808) | 74.5 | 59.5 | 24.7 | |||
| Age, years | .019 | < .001 | .096 | |||
| < 60 | 76.4 | 55.9 | 24.4 | |||
| 60-64 | 77.5 | 62.4 | 25.8 | |||
| 65-69 | 73.7 | 65.3 | 27.9 | |||
| 70-74 | 72.0 | 63.2 | 25.3 | |||
| ≥ 75 | 74.5 | 55.6 | 21.6 | |||
| Race/ethnicity | .030 | < .001 | .016 | |||
| White | 75.1 | 61.3 | 25.6 | |||
| Black | 73.9 | 51.9 | 22.1 | |||
| Other | 65.9 | 63.4 | 22.0 | |||
| Unknown | 59.7 | 59.7 | 10.5 | |||
| Currently married | .329 | .890 | .016 | |||
| Yes | 75.3 | 59.4 | 25.9 | |||
| No | 73.9 | 59.6 | 23.7 | |||
| Comorbidities | ||||||
| Dementia | 85.2 | .005 | 57.0 | .562 | 15.6 | .016 |
| Depression | 81.6 | < .001 | 59.0 | .756 | 26.4 | .204 |
| COPD | 74.0 | .465 | 61.4 | .034 | 25.0 | .646 |
| CHF | 79.0 | .051 | 55.3 | .098 | 21.3 | .136 |
| Diabetes | 78.5 | .002 | 61.0 | .296 | 24.8 | .904 |
| Hypertension | 75.9 | .011 | 60.7 | .048 | 25.9 | .026 |
| IHD | 77.6 | .002 | 58.4 | .330 | 24.6 | .896 |
| Other cancer | 76.9 | .091 | 58.1 | .353 | 25.0 | .798 |
| Clinical stage | < .001 | < .001 | .005 | |||
| IIB | 68.2 | 69.1 | 26.5 | |||
| IIIA | 77.4 | 62.4 | 27.0 | |||
| IIIB | 74.8 | 53.8 | 22.3 | |||
| Year of diagnosis | < .001 | < .001 | .205 | |||
| 2004 | 67.9 | 47.5 | 20.7 | |||
| 2005 | 71.6 | 51.2 | 26.1 | |||
| 2006 | 77.0 | 62.5 | 25.1 | |||
| 2007 | 77.0 | 69.8 | 23.7 | |||
| Clinic | ||||||
| Hospital volume (cases per year) | .203 | .900 | .069 | |||
| < 30 | 78.0 | 59.1 | 29.2 | |||
| 30-60 | 73.5 | 59.1 | 23.4 | |||
| ≥ 60 | 74.5 | 59.8 | 24.6 | |||
| Medical school affiliation | .888 | < .001 | .034 | |||
| Yes | 74.5 | 58.5 | 25.1 | |||
| No | 74.9 | 74.1 | 19.1 | |||
| Urban facility | .219 | .308 | .057 | |||
| Yes | 74.9 | 59.8 | 25.2 | |||
| No | 72.2 | 57.3 | 21.1 | |||
| Facility complexity* | .141 | < .001 | < .001 | |||
| 1a | 74.1 | 57.1 | 21.7 | |||
| 1b | 76.9 | 68.3 | 30.0 | |||
| 1c | 71.5 | 50.7 | 18.8 | |||
| 2 | 74.5 | 66.9 | 32.2 | |||
| 3 | 74.5 | 47.7 | 21.8 | |||
Abbreviations: BS, bone scintigraphy; CHF, congestive heart failure; COPD, chronic obstructive pulmonary disease; IHD, ischemic heart disease; PET, positron emission tomography.
Facility complexity: Level 1 represents the most complex (subdivided into categories 1a to 1c, from more to less complex), Level 2, moderately complex, and Level 3, the least complex.
In multivariable analyses, guideline-recommended brain imaging was associated with more advanced clinical stage (stage IIIA: odds ratio [OR], 1.67; P < .01; stage IIIB: OR, 1.48; P < .01) and later year of diagnosis (2006: OR, 1.57; P < .01; 2007: OR, 1.54; P = .02), whereas increasing age was associated with lower rates of brain imaging (age older than 75 years: OR, 0.61; P < .01; age 70 to 75 years: OR, 0.69; P = .01). Higher rates of PET imaging were associated with later years of diagnosis (2006: OR, 1.91; P < .01; 2007: OR, 2.7; P < .01), whereas reduced PET imaging was associated with black race (OR, 0.74; P < .01), more advanced clinical stage (stage IIIA: OR, 0.73; P < .01; stage IIIB: OR, 0.51; P = .03), and medical school affiliation (OR, 0.46; P = .03). Overuse of BS and PET was associated with earlier year of diagnosis (2005: OR, 1.36; P = .04) and lower overuse was associated with age older than 75 years (OR, 0.75; P = .02; Table 3).
Table 3.
Adjusted Model for Imaging by Patient and Facility Characteristics
| Characteristic | Appropriate Imaging |
Overuse of Brain Imaging |
||||
|---|---|---|---|---|---|---|
| Brain Imaging |
PET Scan |
|||||
| OR | 95% CI | OR | 95% CI | OR | 95% CI | |
| Age, years | ||||||
| < 60 | Ref. | |||||
| 60-64 | 1.04 | 0.83 to 1.31 | 1.20 | 0.97 to 1.49 | 1.03 | 0.81 to 1.30 |
| 65-69 | 0.79 | 0.59 to 1.06 | 1.37 | 1.10 to 1.71 | 1.07 | 0.82 to 1.39 |
| 70-74 | 0.69 | 0.52 to 0.92 | 1.23 | 0.99 to 1.53 | 0.96 | 0.75 to 1.24 |
| ≥ 75 | 0.61 | 0.48 to 0.78 | 0.86 | 0.70 to 1.05 | 0.75 | 0.59 to 0.96 |
| Race/ethnicity | ||||||
| White | Ref. | |||||
| Black | 0.90 | 0.74 to 1.10 | 0.74 | 0.59 to 0.93 | 0.89 | 0.72 to 1.09 |
| Other | 0.62 | 0.26 to 1.48 | 0.95 | 0.48 to 1.90 | 0.73 | 0.33 to 1.61 |
| Unknown | 0.56 | 0.34 to 0.92 | 0.81 | 0.47 to 1.40 | 0.33 | 0.13 to 0.83 |
| Married | ||||||
| Yes | Ref. | |||||
| No | 0.88 | 0.74 to 1.04 | 1.02 | 0.87 to 1.20 | 0.85 | 0.75 to 0.97 |
| Comorbidities | ||||||
| Dementia | 1.77 | 1.12 to 2.80 | 0.95 | 0.67 to 1.33 | 0.56 | 0.35 to 0.91 |
| Depression | 1.47 | 1.17 to 1.38 | 0.85 | 0.70 to 1.04 | 1.07 | 0.89 to 1.28 |
| COPD | 0.83 | 0.71 to 0.96 | 1.04 | 0.89 to 1.22 | 0.98 | 0.84 to 1.15 |
| CHF | 1.09 | 0.80 to 1.48 | 0.72 | 0.56 to 0.93 | 0.77 | 0.60 to 1.00 |
| DM | 1.21 | 1.00 to 1.45 | 1.20 | 0.97 to 1.49 | 0.97 | 0.80 to 1.18 |
| Hypertension | 1.13 | 0.96 to 1.32 | 1.22 | 1.06 to 1.41 | 1.312268 | 1.12 to 1.54 |
| IHD | 1.16 | 0.98 to 1.37 | 0.91 | 0.76 to 1.07 | 0.97 | 0.83 to 1.14 |
| Other cancer | 1.14 | 0.94 to 1.38 | 0.88 | 0.73 to 1.07 | 1.05 | 0.87 to 1.27 |
| Clinical stage | ||||||
| IIB | Ref. | |||||
| IIIA | 1.67 | 1.33 to 2.09 | 0.73 | 0.60 to 0.90 | 1.05 | 0.82 to 1.34 |
| IIIB | 1.48 | 1.21 to 1.81 | 0.51 | 0.42 to 0.61 | 0.81 | 0.64 to 1.03 |
| Year of diagnosis | ||||||
| 2004 | Ref. | |||||
| 2005 | 1.23 | 0.90 to 1.69 | 1.13 | 0.85 to 1.50 | 1.36 | 1.01 to 1.83 |
| 2006 | 1.57 | 1.14 to 2.16 | 1.91 | 1.42 to 2.58 | 1.27 | 0.93 to 1.72 |
| 2007 | 1.54 | 1.09 to 2.18 | 2.70 | 1.90 to 3.83 | 1.17 | 0.84 to 1.63 |
| Hospital volume (cases per year) | ||||||
| < 30 | Ref. | |||||
| 30-60 | 0.83 | 0.53 to 1.28 | 1.25 | 0.67 to 2.32 | 0.87 | 0.51 to 1.49 |
| > 60 | 0.96 | 0.58 to 1.57 | 1.80 | 0.82 to 3.94 | 1.36 | 0.72 to 2.58 |
| Medical school affiliation | ||||||
| No | Ref. | |||||
| Yes | 1.16 | 0.78 to 1.72 | 0.46 | 0.23 to 0.91 | 1.52 | 0.91 to 2.54 |
| Urban facility | ||||||
| No | Ref. | |||||
| Yes | 1.43 | 0.88 to 2.34 | 1.10 | 0.59 to 2.06 | 1.38 | 0.89 to 2.16 |
| Facility complexity* | ||||||
| 1a | Ref. | |||||
| 1b | 1.27 | 0.94 to 1.72 | 1.88 | 1.11 to 3.19 | 1.64 | 1.06 to 2.55 |
| 1c | 0.98 | 0.73 to 1.32 | 1.03 | 0.49 to 2.22 | 1.13 | 0.70 to 1.82 |
| 2 | 1.17 | 0.79 to 1.73 | 2.25 | 1.10 to 4.58 | 2.23 | 1.25 to 3.96 |
| 3 | 1.22 | 0.61 to 2.46 | 1.10 | 0.46 to 2.62 | 2.15 | 1.10 to 4.19 |
Abbreviations: CHF, congestive heart failure; COPD, chronic obstructive pulmonary disease; DM, diabetes mellitus; IHD, ischemic heart disease; OR, odds ratio; PET, positron emission tomography; Ref., reference.
Facility complexity: Level 1 represents the most complex (subdivided into categories 1a to 1c, from more to less complex), Level 2, moderately complex, and Level 3, the least complex.
There was significant variability by region for guideline-recommended imaging. In unadjusted analyses, adherence to brain imaging guidelines was highest in New England at 93% and lowest in the Mississippi region at 69% (Table 4). Similarly, PET imaging was greatest in the Pacific (78%) and New England regions (71%) and lowest in Mississippi and Mid-Atlantic regions (46% in both). Regions with the highest rates of overuse of BS-PET were the Great Lakes (32%) and the Great Basin (30%) compared with the lowest rates of overuse in the Mississippi and South Plains regions (16% for both). The lowest O:E ratio for guideline-recommended brain imaging was seen in the Mississippi region whereas New England was associated with the highest ratio (Fig 1A). For PET imaging, five regions (New England, Pacific, Great Lakes, Northern Plains, and Great Basin) demonstrated the highest O:E ratios, whereas three regions demonstrated the lowest O:E ratios (Mississippi, Mid-Atlantic, and South Plains; Fig 1B). For overuse of BS-PET, two regions (Great Lakes and Pacific) demonstrated the highest O:E ratios, and two regions (Mississippi and South Plains) demonstrated the lowest O:E ratios for this measure (Fig 1C).
Table 4.
Unadjusted Imaging Frequency by Region
| Region | Appropriate Imaging |
Overuse of BS-PET Imaging* |
||||
|---|---|---|---|---|---|---|
| Brain Imaging |
PET Scan |
|||||
| Proportion | P | Proportion | P | Proportion | P | |
| Overall | < .001 | < .001 | < .001 | |||
| New England | 93.4 | 70.8 | 25.6 | |||
| Mid-Atlantic | 77.5 | 46.3 | 28.1 | |||
| Great Lakes | 77.7 | 69.4 | 32.1 | |||
| North Plains | 75.2 | 65.1 | 23.7 | |||
| South Atlantic | 74.5 | 60.1 | 25.7 | |||
| Mississippi | 69.0 | 45.7 | 15.9 | |||
| South Plains | 74.7 | 46.9 | 16.4 | |||
| Great Basin | 69.2 | 65.2 | 30.1 | |||
| Pacific | 70.5 | 77.7 | 29.0 | |||
Abbreviations: BS, bone scintigraphy; PET, positron emission tomography.
BS-PET, patients receive BS in addition to a PET scan.
Fig 1.
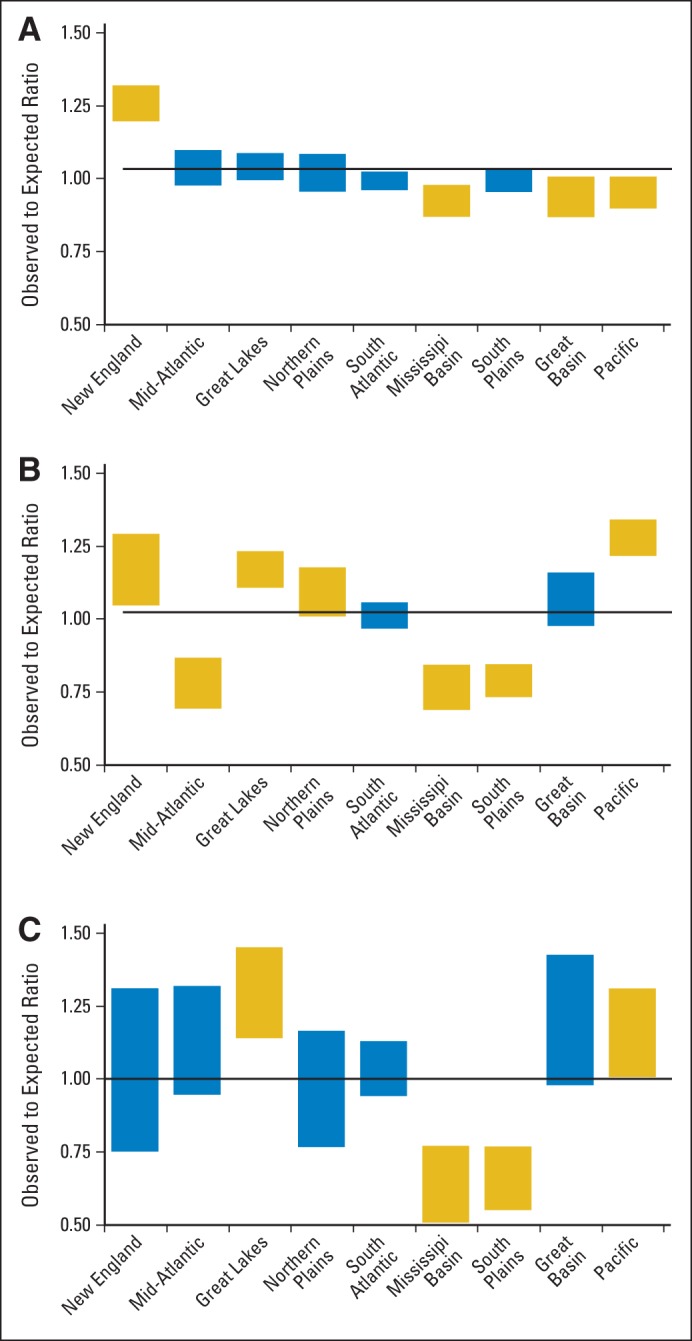
Observed to expected (O:E) ratios for (A) recommended brain imaging by region, (B) recommended positron emission tomography imaging by region, and (C) for overuse of bone scintigraphy-positron emission tomography imaging by region. Bars denote O:E ratios with their 95% CI. Black line indicates a ratio of 1. Yellow box indicates outliers where the O:E ratio is statistically significantly higher or lower than the ratio of 1.
DISCUSSION
Cancer care is a source of substantial health care expenditures in the United States. Adherence to treatment and diagnostic guidelines offers the opportunity to provide standardization, reduce waste, and improve care and outcomes. There is considerable clinical evidence in support of both the ACR Appropriateness Criteria and the NCCN Clinical Guidelines. The use of PET imaging for patients with lung cancer is supported by its established efficacy in detecting metastatic disease and its ability to more accurately stage the mediastinum. Use of PET imaging has also been associated with a reduction in noncurative resections for lung cancer.10,15–19 PET imaging is highly sensitive in the detection of bone metastasis and has established superiority over BS.20–22 Because less than 5% of all patients with lung cancer have occult bone metastasis at the time of presentation, routine use of BS, which limits the metastatic work-up to detection of occult bone metastasis, is of low yield.23 Thus, the combination of BS and PET scan are not complementary. With rare exceptions, their combined use provides redundant information with additive cost.
Likewise, the low prevalence of occult brain metastasis in early-stage lung cancer makes routine brain imaging of low diagnostic value and not cost effective.24–26 Because we were unable to determine the presence or absence of neurologic symptoms, we did not consider this measure. Rather, we relied on NCCN recommendations supporting brain imaging for later-stage disease for which the recommendation was applicable. Lack of brain imaging is a hallmark of poor quality in this select patient group because the intent of the guidelines is to provide accurate staging and avoid nontherapeutic interventions.
Our findings suggest that many patients receive imaging inconsistent with national guidelines and appropriateness criteria. The reasons for this are likely multifactorial, and many investigations into adherence rates for appropriate treatment guidelines for other cancer types have yielded mixed results.19,27,28
To the best of our knowledge, the only national evaluation of guideline-based lung cancer imaging was done by using data from the process survey database of the Quality Research in Radiation Oncology Initiative.29 In that study, PET imaging was done at the rate of 88% for non–small-cell lung cancer but only 57% for small-cell lung cancer. BS declined from 58% to 25% for non–small-cell lung cancer and from 68% to 50% for small-cell lung cancer. We examined a more contemporary cohort within a universal access national health care system that included more than 3,000 patients. The rate of appropriate brain imaging was comparable at 75% overall, but rates of PET use were lower. Our study also attempted to examine inappropriate use of the combination of BS and PET that had not been done previously. These findings must be interpreted within the context of evolving imaging techniques (ie, trend from use of stand-alone PET to more recent use of combined PET-CT); thus, more contemporary data might yield different results.
Advances in technology and imaging move at a rapid pace and sometimes move faster than our understanding of its true value, which can lead to inappropriate care. Given the proven superiority of PET over BS, one would predict a decline in the rate of BS and an increase in the use of PET. Instead, we noted a near steady rate of BS use, although PET use increased over the same time period. This suggests that the use of PET was additive to the entire imaging milieu as opposed to supplanting a less efficacious modality. Persistent use of BS may be explained by the relative cost difference between PET and BS. PET scanning has fewer sites of service than BS and is a more expensive imaging modality corresponding to a four- to eight-fold cost differential.30 There are other examples in which new technologies are additive rather than being more efficient in phasing out older modalities.31,32 In many cases, any additional cost savings as a result of the introduction of a more efficacious modality is negated by continued use of outdated technology such as in advanced imaging for breast cancer.33–35
Regional resource availability and local practice patterns may also influence adherence to national guidelines. Studies have found associations between increased availability of medical resources and increased usage rates.7,33,36 We found that regions associated with the highest adherence to appropriate imaging were also the regions associated with high rates of redundant imaging. These regions may represent high users of health care resources independent of medical appropriateness. We stratified the analysis at the level of the region; however, we did not examine differences at the facility level. Thus, availability of facility resources may have influenced the observed regional variability.
Disparities in receipt of appropriate care are often linked to patient-level characteristics. We found younger age and white race associated with increased use of brain and PET imaging, which may reflect the bias toward surgery and more aggressive preoperative staging in these patients. Our sample size of 3,000 patients was insufficient to further explore these differences across the 116 facilities and nine regions. Brain imaging had the highest rates of adherence and may reflect the length of time for which the recommendation has been in place or imaging for indications independent of cancer. We also found lower rates of PET imaging among patients with more advanced-stage disease. This is consistent with prior published reports on staging for patients with lung cancer.37 There is also potential for stage migration whereby patients with more advanced imaging might have been upstaged; however, this would be contrary to our findings. In the VA population, the universal nature of health care coverage tends to minimize access to care and financial obstacles but does not eliminate them completely. In addition, VA providers should be less incentivized toward higher test use than providers in the private sector of US health care. Patient characteristics may still exert influence, but the role of information dissemination to providers cannot be underestimated.
Some information dissemination programs and evidence-based clinical support guides have demonstrated substantial reductions in imaging use for noncancer conditions.38,39 These programs have not directly linked reductions in imaging to improvements in appropriate care; rather, they highlight the ability to reduce use. One of the most recent initiatives in the United States is the Choosing Wisely Campaign launched by the American Board of Internal Medicine. Its aim is to encourage providers and stakeholders to make clinical decisions on the basis of evidence-based practice guidelines in an effort to decrease overuse of tests and procedures. The long-term results of this effort remain to be seen; however, it represents one of the most comprehensive programs aimed at curbing waste in the US medical system.40
Our study is limited in that our data rely on administrative claims with limitations in accuracy of reporting and lack of complete clinical covariates. However, VA data contain more detailed clinical data points than many other large cancer registry data sources, and in this study, the data were combined with Medicare claims data to provide a more comprehensive view. An equally important limitation is the fact that our main outcomes are based on national guideline recommendations that allow for clinical exceptions for a given patient. Limiting our cohort to patients with stage IIB to IIIB disease may have introduced bias in the sample, although our cohort represented the population of patients for which the guidelines were intended. The guidelines are meant to be applied to all patients with stage IIB to IIIB disease being considered for definitive therapy (either surgical resection or combined chemotherapy and radiotherapy); however, we did not have the ability to discern candidacy for treatment which would have provided valuable information regarding intent to treat. This indeed may explain some of the heterogeneity we report in the data; however, it is unlikely to explain all of the major observed differences. In the future, creating metrics that combine both overuse and underuse for composite assessment may yield more meaningful cost analysis and improvements in quality of health care delivery.
Glossary Terms
- clustering:
organization of data consisting of many variables (multivariate data) into classes with similar patterns. Hierarchical clustering creates a dendrogram on the basis of pairwise similarities in gene expression within a set of samples. Samples within a cluster are more similar to one another than to samples outside the cluster. The vertical length of branches in the tree represents the extent of similarity between the samples. Thus, the shorter the branch length, the fewer the differences between the samples.
Appendix
Table A1.
US Regions by State
| Region | States |
|---|---|
| New England | Connecticut, Maine, Massachusetts, New Hampshire, Rhode Island, Vermont |
| Mid-Atlantic | New Jersey, New York, Pennsylvania |
| Great Lakes | Illinois, Indiana, Michigan, Ohio, Wisconsin |
| North Plains | Kansas, Minnesota, Missouri, Nebraska, North Dakota, South Dakota |
| South Atlantic | Delaware, District of Columbia, Florida, Georgia, Maryland, North Carolina, South Carolina, Virginia, West Virginia |
| Mississippi | Alabama, Kentucky, Mississippi, Tennessee |
| South Plains | Arkansas, Louisiana, Oklahoma, Texas |
| Great Basin | Arizona, Colorado, Idaho, Montana, Nevada, New Mexico, Utah, Wyoming |
| Pacific | Alaska, California, Hawaii, Oregon, Washington |
Fig A1.

Imaging use trends over time. BS, bone scintigraphy; PET, positron emission tomography.
Footnotes
Supported by Grants No. IIR 07-235-2 from the Department of Veterans Affairs and No. NCI 1RC2CA148433 from the National Cancer Institute.
Terms in blue are defined in the glossary, found at the end of this article and online at www.jco.org.
The views expressed in this article are those of the authors and do not necessarily reflect the position or policy of the Department of Veterans Affairs or the United States Government.
Authors' disclosures of potential conflicts of interest and author contributions are found at the end of this article.
AUTHORS' DISCLOSURES OF POTENTIAL CONFLICTS OF INTEREST
The author(s) indicated no potential conflicts of interest.
AUTHOR CONTRIBUTIONS
Conception and design: Leah M. Backhus, Thomas K. Varghese, Steven B. Zeliadt
Collection and assembly of data: Xiao-Hua Zhou, Steven B. Zeliadt
Data analysis and interpretation: Leah M. Backhus, Farhood Farjah, Aaron M. Cheng, Douglas E. Wood, Larry Kessler, Steven B. Zeliadt
Manuscript writing: All authors
Final approval of manuscript: All authors
REFERENCES
- 1.Dinan MA, Curtis LH, Carpenter WR, et al. Variations in use of PET among Medicare beneficiaries with non-small cell lung cancer, 1998-2007. Radiology. 2013;267:807–817. doi: 10.1148/radiol.12120174. [DOI] [PubMed] [Google Scholar]
- 2.Dinan MA, Curtis LH, Hammill BG, et al. Changes in the use and costs of diagnostic imaging among Medicare beneficiaries with cancer, 1999-2006. JAMA. 2010;303:1625–1631. doi: 10.1001/jama.2010.460. [DOI] [PubMed] [Google Scholar]
- 3.Hu YY, Kwok AC, Jiang W, et al. High-cost imaging in elderly patients with stage IV cancer. J Natl Cancer Inst. 2012;104:1164–1172. doi: 10.1093/jnci/djs286. [DOI] [PMC free article] [PubMed] [Google Scholar]
- 4.Mariotto AB, Yabroff KR, Shao Y, et al. Projections of the cost of cancer care in the United States: 2010-2020. J Natl Cancer Inst. 2011;103:117–128. doi: 10.1093/jnci/djq495. [DOI] [PMC free article] [PubMed] [Google Scholar]
- 5.Warren JL, Yabroff KR, Meekins A, et al. Evaluation of trends in the cost of initial cancer treatment. J Natl Cancer Inst. 2008;100:888–897. doi: 10.1093/jnci/djn175. [DOI] [PMC free article] [PubMed] [Google Scholar]
- 6.Welch HG, Hayes KJ, Frost C. Repeat testing among Medicare beneficiaries. Arch Intern Med. 2012;172:1745–1751. doi: 10.1001/2013.jamainternmed.727. [DOI] [PubMed] [Google Scholar]
- 7.Baker L, Birnbaum H, Geppert J, et al. The relationship between technology availability and health care spending. Health Aff (Millwood) 2003:W3-537-51. doi: 10.1377/hlthaff.w3.537. [DOI] [PubMed] [Google Scholar]
- 8.National Comprehensive Cancer Network (NCCN) NCCN Clinical Practice Guidelines in Oncology: Non-Small Cell Lung Cancer, version 4.2014
- 9.Ravenel JG, Mohammed TL, Movsas B, et al. ACR Appropriateness Criteria® noninvasive clinical staging of bronchogenic carcinoma. J Thorac Imaging. 2010;25:W107–W111. doi: 10.1097/RTI.0b013e3181f51e7f. [DOI] [PubMed] [Google Scholar]
- 10.Fischer B, Lassen U, Mortensen J, et al. Preoperative staging of lung cancer with combined PET-CT. N Engl J Med. 2009;361:32–39. doi: 10.1056/NEJMoa0900043. [DOI] [PubMed] [Google Scholar]
- 11.National Comprehensive Cancer Network (NCCN) NCCN Clinical Practice Guidelines in Oncology: Non-Small Cell Lung Cancer version 2.2010
- 12.Quan H, Sundararajan V, Halfon P, et al. Coding algorithms for defining comorbidities in ICD-9-CM and ICD-10 administrative data. Med Care. 2005;43:1130–1139. doi: 10.1097/01.mlr.0000182534.19832.83. [DOI] [PubMed] [Google Scholar]
- 13.Klabunde CN, Legler JM, Warren JL, et al. A refined comorbidity measurement algorithm for claims-based studies of breast, prostate, colorectal, and lung cancer patients. Ann Epidemiol. 2007;17:584–590. doi: 10.1016/j.annepidem.2007.03.011. [DOI] [PubMed] [Google Scholar]
- 14.Elixhauser A, Steiner C, Palmer L. Clinical Classifications Software (CCS), US Agency for Healthcare Research and Quality. 2010 [Google Scholar]
- 15.Cerfolio RJ, Ojha B, Bryant AS, et al. The accuracy of integrated PET-CT compared with dedicated PET alone for the staging of patients with nonsmall cell lung cancer. Ann Thorac Surg. 2004;78:1017–1023. doi: 10.1016/j.athoracsur.2004.02.067. [DOI] [PubMed] [Google Scholar]
- 16.Silvestri GA, Gould MK, Margolis ML, et al. Noninvasive staging of non-small cell lung cancer: ACCP evidenced-based clinical practice guidelines (2nd edition) Chest. 2007;132:178S–201S. doi: 10.1378/chest.07-1360. [DOI] [PubMed] [Google Scholar]
- 17.Silvestri GA, Gonzalez AV, Jantz MA, et al. Methods for staging non-small cell lung cancer: Diagnosis and management of lung cancer, 3rd ed—American College of Chest Physicians evidence-based clinical practice guidelines. Chest. 2013;143:e211S–e250S. doi: 10.1378/chest.12-2355. [DOI] [PubMed] [Google Scholar]
- 18.Reed CE, Harpole DH, Posther KE, et al. Results of the American College of Surgeons Oncology Group Z0050 trial: The utility of positron emission tomography in staging potentially operable non-small cell lung cancer. J Thorac Cardiovasc Surg. 2003;126:1943–1951. doi: 10.1016/j.jtcvs.2003.07.030. [DOI] [PubMed] [Google Scholar]
- 19.Onega T, Tosteson TD, Wang Q, et al. Geographic and sociodemographic disparities in PET use by Medicare beneficiaries with cancer. J Am Coll Radiol. 2012;9:635–642. doi: 10.1016/j.jacr.2012.05.005. [DOI] [PMC free article] [PubMed] [Google Scholar]
- 20.Hsia TC, Shen YY, Yen RF, et al. Comparing whole body 18F-2-deoxyglucose positron emission tomography and technetium-99m methylene diophosphate bone scan to detect bone metastases in patients with non-small cell lung cancer. Neoplasma. 2002;49:267–271. [PubMed] [Google Scholar]
- 21.Gayed I, Vu T, Johnson M, et al. Comparison of bone and 2-deoxy-2-[18F]fluoro-D-glucose positron emission tomography in the evaluation of bony metastases in lung cancer. Mol Imaging Biol. 2003;5:26–31. doi: 10.1016/s1536-1632(03)00036-2. [DOI] [PubMed] [Google Scholar]
- 22.Cheran SK, Herndon JE, 2nd, Patz EF., Jr Comparison of whole-body FDG-PET to bone scan for detection of bone metastases in patients with a new diagnosis of lung cancer. Lung Cancer. 2004;44:317–325. doi: 10.1016/j.lungcan.2003.11.008. [DOI] [PubMed] [Google Scholar]
- 23.Roberts CC, Daffner RH, Weissman BN, et al. ACR appropriateness criteria on metastatic bone disease. J Am Coll Radiol. 2010;7:400–409. doi: 10.1016/j.jacr.2010.02.015. [DOI] [PubMed] [Google Scholar]
- 24.Colice GL, Birkmeyer JD, Black WC, et al. Cost-effectiveness of head CT in patients with lung cancer without clinical evidence of metastases. Chest. 1995;108:1264–1271. doi: 10.1378/chest.108.5.1264. [DOI] [PubMed] [Google Scholar]
- 25.Cole FH, Jr, Thomas JE, Wilcox AB, et al. Cerebral imaging in the asymptomatic preoperative bronchogenic carcinoma patient: Is it worthwhile? Ann Thorac Surg. 1994;57:838–840. doi: 10.1016/0003-4975(94)90185-6. [DOI] [PubMed] [Google Scholar]
- 26.Yohena T, Yoshino I, Kitajima M, et al. Necessity of preoperative screening for brain metastasis in non-small cell lung cancer patients without lymph node metastasis. Ann Thorac Cardiovasc Surg. 2004;10:347–349. [PubMed] [Google Scholar]
- 27.Lysdahl KB, Børretzen I. Geographical variation in radiological services: A nationwide survey. BMC Health Serv Res. 2007;7:21. doi: 10.1186/1472-6963-7-21. [DOI] [PMC free article] [PubMed] [Google Scholar]
- 28.Saigal CS, Pashos CL, Henning JM, et al. Variations in use of imaging in a national sample of men with early-stage prostate cancer. Urology. 2002;59:400–404. doi: 10.1016/s0090-4295(01)01543-6. [DOI] [PubMed] [Google Scholar]
- 29.Komaki R, Khalid N, Langer CJ, et al. Penetration of recommended procedures for lung cancer staging and management in the United States over 10 years: A quality research in radiation oncology survey. Int J Radiat Oncol Biol Phys. 2013;85:1082–1089. doi: 10.1016/j.ijrobp.2012.10.016. [DOI] [PMC free article] [PubMed] [Google Scholar]
- 30.Center for Medicare and Medicaid Services. Medicare Hospital Outpatient Prospective Payment System (HOPPS) (APC) CY 2014 Final Rule (Fed. Reg. Version add B) 2014. http://www.cms.gov/Medicare/Medicare-Fee-for-Service-Payment/PhysicianFeeSched/PFS-Federal-Regulation-Notices-Items/CMS-1600-FC.html.
- 31.Crivello ML, Ruth K, Sigurdson ER, et al. Advanced imaging modalities in early stage breast cancer: Preoperative use in the United States Medicare population. Ann Surg Oncol. 2013;20:102–110. doi: 10.1245/s10434-012-2571-4. [DOI] [PMC free article] [PubMed] [Google Scholar]
- 32.Burke JF, Kerber KA, Iwashyna TJ, et al. Wide variation and rising utilization of stroke magnetic resonance imaging: Data from 11 states. Ann Neurol. 2012;71:179–185. doi: 10.1002/ana.22698. [DOI] [PMC free article] [PubMed] [Google Scholar]
- 33.Coburn N, Przybysz R, Barbera L, et al. CT, MRI and ultrasound scanning rates: Evaluation of cancer diagnosis, staging and surveillance in Ontario. J Surg Oncol. doi: 10.1002/jso.21144. [DOI] [PubMed] [Google Scholar]
- 34.Coburn N, Przybysz R, Barbera L, et al. Evaluation of CT and MRI scanning among cancer patients in Ontario. Clin Imaging. 2011;35:301–308. doi: 10.1016/j.clinimag.2010.07.007. [DOI] [PubMed] [Google Scholar]
- 35.Breslin TM, Banerjee M, Gust C, et al. Trends in advanced imaging use for women undergoing breast cancer surgery. Cancer. 2013;119:1251–1256. doi: 10.1002/cncr.27838. [DOI] [PubMed] [Google Scholar]
- 36.Srygley FD, Abbott DH, Grambow SC, et al. Variability in resource use: Diagnosing colorectal cancer. Am J Manag Care. 2013;19:370–376. [PubMed] [Google Scholar]
- 37.Farjah F, Flum DR, Ramsey SD, et al. Multi-modality mediastinal staging for lung cancer among Medicare beneficiaries. J Thorac Oncol. 2009;4:355–363. doi: 10.1097/JTO.0b013e318197f4d9. [DOI] [PMC free article] [PubMed] [Google Scholar]
- 38.McWhirter E, Yogendran G, Wright F, et al. Baseline radiological staging in primary breast cancer: Impact of educational interventions on adherence to published guidelines. J Eval Clin Pract. 2007;13:647–650. doi: 10.1111/j.1365-2753.2007.00804.x. [DOI] [PubMed] [Google Scholar]
- 39.Blackmore CC, Mecklenburg RS, Kaplan GS. Effectiveness of clinical decision support in controlling inappropriate imaging. J Am Coll Radiol. 2011;8:19–25. doi: 10.1016/j.jacr.2010.07.009. [DOI] [PubMed] [Google Scholar]
- 40.Cassel CK, Guest JA. Choosing wisely: Helping physicians and patients make smart decisions about their care. JAMA. 2012;307:1801–1802. doi: 10.1001/jama.2012.476. [DOI] [PubMed] [Google Scholar]