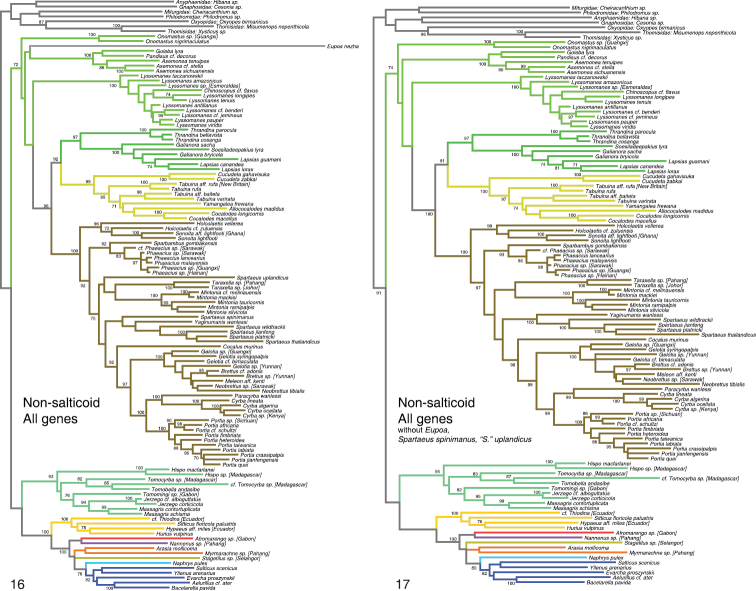
Figures 16–17.
Phylogeny from Non-salticoid dataset, All Genes analysis. Numbers beside branches show percentage of RAxML likelihood bootstrap replicates with clade. 16 Non-salticoid analysis with all taxa included (1500 bootstrap replicates used) 17 Non-salticoid analysis with Eupoa, Spartaeus spinimanus, and “Spartaeus” uplandicus excluded (500 bootstrap replicates used). Colors of branches are the same as those highlighting taxa in Fig. 14.

