Abstract
In one of the first steps of prokaryotic ribosome assembly, the ribosomal protein S15 binds to a three-way junction in the central domain of the 16S rRNA. Binding causes a conformational change that is required for subsequent binding events. Using a novel fluorescence resonance energy transfer assay with three fluorophores, two on the RNA and one on the S15 protein, small-molecule libraries can be screened for potential inhibitors of this initial step in ribosome assembly. The employment of three fluorophores allows both the conformational change of the RNA and the binding of S15 to be monitored in a single assay.
INTRODUCTION
During the assembly of prokaryotic 30S ribosomal subunits, the small subunit proteins bind to the 16S rRNA in a hierarchical manner, as described by the assembly map developed by Nomura (1,2). The small subunit proteins are grouped into primary, secondary and tertiary binding proteins, depending on the requirements for prior protein binding. S15 is a primary binding ribosomal protein that binds independently to a three-way junction (3WJ) in the central domain of the 16S rRNA in the early stages of 30S subunit assembly. Binding of S15 induces a conformational change in the 3WJ formed by helices 20, 21 and 22 which leads to coaxial stacking of helices 21 and 22, while helix 20 forms a 60° angle with helix 22 (3). The stabilization of this conformation by S15 is a prerequisite for subsequent binding events during the assembly of 30S subunits, and thus is a key step in the formation of functional 70S ribosomes.
The sequence of this region of the 16S rRNA differs from the homologous sequence in human 80S ribosomes; therefore the S15 binding site is a potential target for selective blocking of prokaryotic ribosome assembly. Inhibition of ribosome assembly could be achieved by small-molecule compounds that bind to the 3WJ and inhibit either the conformational change itself or S15 binding, which might result in antibiotic activity.
In order to identify lead compounds for potential antibiotics, high-throughput methods are required to screen large diverse sets of compounds efficiently. Fluorescence assays are particularly well suited for high-throughput screening because they are sensitive, can be automated and can be rapidly performed in small volumes and large format using microtiter plates.
Here we describe a three-fluorophore fluorescence resonance energy transfer (FRET) assay that allows for screening of small-molecule libraries for potential inhibitors of ribosome assembly. As a model system, a minimal 3WJ containing all determinants for binding of S15 is labeled with two fluorophores (donor and acceptor 1), and a third fluorophore (acceptor 2) is attached to S15. The three fluorophores are placed such that the conformational change of the 16S rRNA central domain 3WJ and the binding of S15 can be monitored simultaneously in one screen. We show that this FRET assay reliably identifies compounds that bind to the junction and affect the conformation, and has the potential to identify compounds that interfere with S15 binding. Owing to the high sensitivity and the small amounts of material needed, this assay can be performed in 384-well microtiter plates and thus can be readily adapted to high-throughput screening for novel inhibitors of 30S assembly.
MATERIALS AND METHODS
RNA constructs
The 16S rRNA 3WJ was formed from the three strands (Fl)-22-20 [5′-(fluorescein)-UGG UCU GGC CUG CAC CUG ACG CCA GCU CGC ACC A-3′], (TMR)-20-21 [5′-(tetramethylrhodamine)-UGG UGC GAG CUG GCG GUC UUC CA-3′], and 21-22 (5′-UGG AAG ACU UGA GGG CAG GAG AGG ACC A-3′) (Dharmacon Research, La Fayette, CO). RNA samples were annealed by mixing 5 µM of each strand in 100 mM sodium phosphate pH 7.2, 100 mM KCl, heating to 95°C for 2 min and subsequent cooling to 35°C in 30 min. For the assay, this stock solution was diluted 25-fold with 50 mM Tris–HCl pH 7.5 and 0.5% Tween 20.
Preparation of S15-R78C and labeling with Texas red
The R78C mutation was introduced into the S15 gene using the QuickChange kit (Stratagene). The gene for S15-R78C was cloned into vector pJM109, and the S15 protein, fused to an N-terminal His-tag and a factor Xa cleavage site, was overproduced in Escherichia coli BL21(DE3). Cells were grown in LB medium (50 µg ml–1 ampicillin) to an OD600 of 0.6, and protein production was induced by adding 1 mM isopropyl-β-d-thiogalactoside (IPTG). The cells were harvested 4 h after induction. The cell pellet (8 g wet cells) was suspended in 80 ml lysis buffer [50 mM Tris–HCl, pH 8.0, 100 mM KCl, 1 mM EDTA, 0.1 mM PMSF, 1 mM β-mercaptoethanol (β-ME)]. Cells were lysed with lysozyme (1 mg ml–1) in the presence of 1 mg ml–1 sodium desoxycholate [45 min, room temperature (RT)]. DNA was hydrolyzed by adding DNase I (0.5 U ml–1) and MgCl2 (2 mM). To solubilize the protein, guanidinium chloride (GdmCl) was added to 6 M, and the solution was stirred for 1 h at RT. Cell debris was removed via centrifugation (15 000 g) and 10 ml Ni2+-nitrilotriacetate (NTA) agarose was added to the supernatant. The Ni2+-NTA resin was poured into a column and washed with 100 ml of 100 mM NaH2PO4, 10 mM Tris–HCl pH 8.0 and 6 M GdmCl. The S15 protein was eluted in 20 ml 6 M GdmCl in 0.2 M AcOH, dialyzed twice against 2% AcOH and lyophilized. The lyophilized protein was dissolved in 4 M urea and applied to a C18 column equilibrated in 5% MeCN and 0.1% TFA. The column was eluted with a 5–50% MeCN gradient in 0.1% trifluoroacetic acid (TFA). The S15-containing fractions were pooled and lyophilized. The lyophilized protein was redissolved in 100 mM Tris–HCl pH 7.5, 6 M GdmCl and 5 mM EDTA to a final concentration of 1 mM. Disulfides were reduced by incubation with a 50-fold excess of dithiothreitol (DTT) at 37°C for 1 h. The excess of DTT was removed by size exclusion chromatography (G25 NAP-10) and the protein solution was diluted to a concentration of 100 µM. Fluorescence labeling was performed at 37°C for 2 h using a 10-fold excess of Texas red (TR) maleimide. The excess of unreacted dye was removed by incubating the reaction mixture with Ni2+-NTA agarose for 30 min. After washing with 100 mM NaH2PO4, 10 mM Tris–HCl pH 8.0 and 6 M GdmCl, the S15 protein was eluted with 6 M GdmCl and 2% AcOH. The labeled S15 was separated from unlabeled protein by a second C18 reversed phase chromatography step, and colored fractions were pooled and lyophilized. To remove the His-tag, the lyophilized protein was dissolved in cleavage buffer (20 mM Tris–HCl pH 8.0, 100 mM NaCl, 2 mM CaCl2) and incubated with 2 µl (0.04 U) factor Xa per milligram of protein at room temperature for 1 h. The cleavage reaction was stopped by addition of urea (8 M) and the solution was incubated with Ni2+-NTA to remove uncleaved protein. The supernatant was applied to a C18 column, which was developed as described above. Fractions containing S15-R78C labeled with TR (S15-TR) were pooled, dialyzed against H2O and lyophilized in aliquots.
Fluorescence measurements
Fluorescence measurements were performed in a Spectramax Gemini fluorescence microplate reader using 384-well plates. The well volume was 20 µl. For the assay, the final concentrations were as follows: 20 nM 16S rRNA junction, 50–80 nM S15-TR and 1 or 10 µM library compound in 50 mM Tris–HCl pH 7.5 and 0.5% Tween 20. Fluorescein (Fl) was excited at 485 nm (bandwidth 9 nm), and emissions of Fl, tetramethylrhodamine (TMR) and TR were recorded at 528, 581 and 614 nm, respectively, (bandwidths 9 nm) using 515-, 570- and 610-nm cut-off filters. Spectra were recorded with 2 nm resolution from 515 to 650 nm using a 515-nm cut-off filter.
RESULTS
Design of the model system: rationale for choice of fluorophores and attachment sites
The conformational change of the 16S rRNA 3WJ leads to stacking of helices 22 and 21, and a decrease in the end-to-end distance of helices 20 and 22 from 70 to 40 Å (Fig. 1). To exploit the distance dependence of the FRET efficiency as a probe for the conformational change, donor and acceptor 1 fluorophores were therefore placed on arms 20 and 22. Upon excitation of the donor, fluorescence emission would be expected mainly from the donor due to the long interfluorophore distance and the resulting low FRET efficiency. In the folded junction, the reduced interfluorophore distance leads to an increase in FRET efficiency, and upon excitation of the donor, emission from acceptor 1 would be expected. FRET has already been used to detect the Mg2+- and S15-induced conformational change on a single molecule using Cy3 (donor) and Cy5 (acceptor) (4,5).
Figure 1.
Folding equilibrium of the central domain 3WJ and fluorophore attachment for the fluorescence assay. Shown is a schematic depiction of the central domain 3WJ of the 16S rRNA comprising helices 20, 21 and 22 (black). In the absence of Mg2+ and S15, the junction is extended (left). Both Mg2+ and S15 induce the formation of a compact structure [folded junction (middle)], in which the helical arms 20 and 22 form a 60° angle and helices 22 and 21 stack coaxially. S15 binds to the junction and stabilizes the folded form (right). The fluorophores used in the FRET assay are indicated in green (donor, Fl, helix 22), orange (TMR, acceptor 1, helix 20) and red (TR, acceptor 2, Cys78 of S15). The black arrow indicates the excitation of the donor, and the bold arrows indicate which fluorophore mainly contributes to the emission spectra in each species.
To independently monitor the binding of S15 to the 3WJ, an additional fluorescent probe (acceptor 2) was attached to the S15 protein. Using the crystal structure of the 16S rRNA-central domain.S15.S6.S18 particle (6) as a guide, residue 78 of S15 was selected for introduction of a cysteine for fluorophore attachment. As the side chain of residue 78 points away from the RNA into solution, modifications at this site should not interfere with RNA binding. The distances between position 78 and the ends of helical arms 20 and 22 are 56 and 37 Å, respectively, which allows for efficient FRET from the donor and acceptor 1 fluorophores to acceptor 2. Fl, TMR and TR were chosen as donor, acceptor 1 and acceptor 2. Fl absorbs at 495 nm (λmax), the emission maximum is at 530 nm (λmax). The TMR absorption (λmax = 546 nm) overlaps with the Fl emission, and the TMR emission (λmax = 581 nm) overlaps with the TR absorption (λmax = 582 nm), fulfilling the requirements for an energy relay from donor to acceptor 1 to acceptor 2. Direct transfer from Fl to TR is also possible. The Förster distances R0 for the donor–acceptor pairs are 54 Å (Fl–TMR), 54 Å (Fl–TR) and 62 Å (TMR–TR), respectively. Therefore one would expect mainly Fl emission in the unfolded junction, mainly TMR emission in the folded junction and mainly TR emission once the S15 protein is bound (Fig. 1).
Three-fluorophore system: attachment of fluorophores does not interfere with RNA folding and S15 complex formation
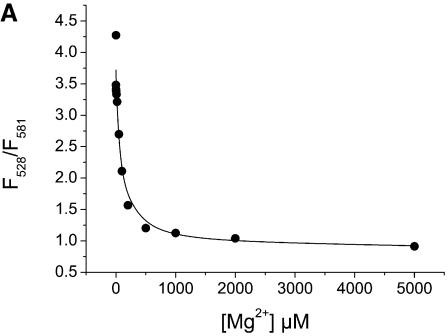
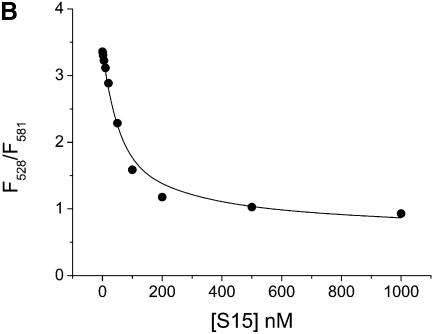
As a control to establish the model system, the doubly labeled junction was titrated with Mg2+ and S15. Folding of the junction and S15 binding were measured via FRET between Fl and TMR (Fig. 2). All experiments were performed in a microplate reader using 384-well plates and volumes of 20 µl per well. The Kd values determined for Mg2+ and S15 complexes were 77 µM and 50 nM, respectively, which is similar to those for binding of Mg2+ and wild-type S15 to the natural junction [Kd(Mg2+) = 100 µM; Kd(S15) = 10–30 nM]. These results confirm that neither Mg2+-induced folding nor binding of S15 are hampered by the attached fluorophores. Similar fluorescence changes have been observed in single-molecule FRET experiments using a Cy3/Cy5-labelled junction (4,5).
Figure 2.
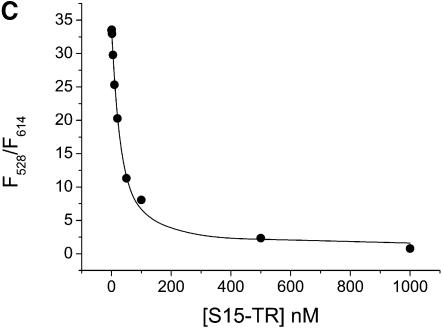
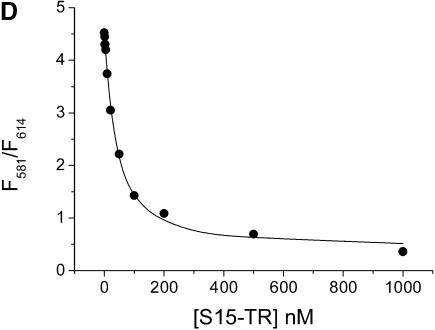
Mg2+ and S15 titrations. (A and B) Titration of the Fl/TMR 3WJ (20 nM) with Mg2+ and S15. Folding of the junction is monitored via the ratio of Fl/TMR emission intensities. (C and D) Titration of the Fl and Fl/TMR 3WJ with S15-TR. S15-TR binding is followed via the ratio of TMR/TR emission intensities. Non-linear least-squares analysis yields Kd values of 77 µM (Mg2+ binding) and 50 nM (S15 binding). The binding of S15-TR to the fluorescently labeled junction is characterized by Kd values of 17 nM (Fl junction) and 27 nM (Fl/TMR junction), confirming that the system is not compromised by fluorophore attachment.
To confirm that S15-TR maintains wild-type-like binding to the 3WJ, the Fl-only and the Fl/TMR-labeled junctions were titrated with S15-TR. Kd values of 17 nM (Fl only) and 27 nM (Fl/TMR) were obtained. Comparison with binding of wild-type S15 (Kd = 50 nM) suggests that the presence of the TR fluorophore on S15 does not affect the integrity of the S15 protein or its ability to bind RNA.
Proof of principle I: distinction of three different species from fluorescence properties
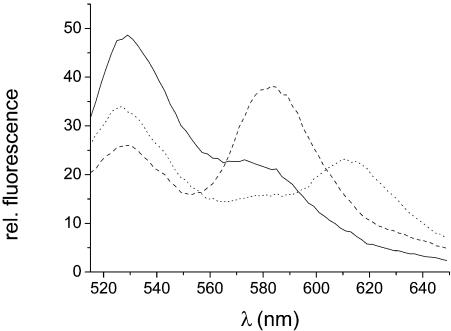
To monitor the conformational change of the 16S rRNA 3WJ and the binding of S15 in one assay, it is required that the three species, (i) free RNA, extended, (ii) free RNA, folded, and (iii) S15-bound RNA, can be easily distinguished by their fluorescence properties. Fluorescence emission spectra of the extended junction (no Mg2+), the folded junction (10 mM Mg2+) and the S15-TR-bound junction (Fig. 3) exhibit characteristic fluorescence maxima at the emission wavelengths of the three dyes. The spectrum of the unfolded junction is dominated by the emission from the Fl (528 nm), while in the folded junction the emissions at the Fl and TMR emission wavelengths (528 and 581 nm) are nearly equal. The fluorescence emission of the S15-TR-RNA complex is dominated by TR (614 nm), indicating that, once the protein is bound, FRET from Fl (and presumably also from TMR) to TR is almost complete. Thus the predominant species can be extracted from the shape of spectra and the relative emission intensities at the emission maxima of the three dyes.
Figure 3.
Fluorescence emission spectra of the unfolded Fl/TMR junction, the folded junction and the junction in complex with S15-TR. The donor fluorophore was excited at 485 nm and the fluorescence emission spectra were recorded from 515 to 650 nm (9 nm bandwidth). Continuous line, emission spectrum for the unfolded junction (in 50 mM Tris–HCl pH 7.5 and 0.5% Tween 20); dashed line, folded junction (in 50 mM Tris–HCl pH 7.5, 10 mM MgCl2 and 0.5% Tween 20); dotted line, junction bound to S15-TR (in 50 mM Tris–HCl pH 7.5, 0.5% Tween 20 and 50 nM S15-TR). The RNA concentration is 20 nM. Each species has a characteristic emission maximum, which means that in reverse from the fluorescence emission intensities at 528 nm (Fl), 581 nm (TMR) and 614 nm (TR), the predominant species can be deduced. The conformational change can be monitored via the ratio of emission intensities at 528 and 581 nm (Fl/TMR), and protein binding can be monitored via the ratio of emission intensities at 581 and 614 nm (TMR/TR).
Proof of principle II: competition with an excess unlabeled RNA junction displaces the Fl/TMR junction from S15-TR
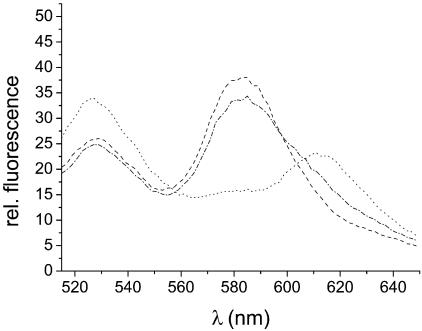
To demonstrate that, in principle, addition of an inhibitor for S15 binding can be detected with this FRET assay, binding of S15-TR to the Fl/TMR-labeled RNA junction was monitored in the presence and absence of an excess of unlabeled junction. The emission spectra (Fig. 4) in the absence of competitor shows the characteristic emission maxima of the S15-rRNA complex at 614 nm (TR). In the presence of a 50-fold excess of unlabeled RNA, however, the emission maxima are at 528 and 581 nm, indicating that the Fl/TMR-labeled RNA is not bound to S15-TR. This confirms that it is feasible to identify compounds that interfere with binding of S15-TR to the Fl/TMR-labeled RNA junction using this FRET assay. The binding of S15-TR is monitored best via the ratio of emission intensities at 581 and 614 nm, where the folded and unfolded RNA junction provides a clearly distinct signal (F581/F614 = 2.5–3 without protein bound; F581/F614 = 0.7 with protein bound). The characteristic ratios of emission intensities for the three species are summarized in Table 1.
Figure 4.
Fluorescence spectra for competition. Spectra were measured as described for Figure 3. Dashed line, folded junction (in 50 mM Tris–HCl, pH 7.5, 10 mM MgCl2 and 0.5% Tween 20); dotted line, junction bound to S15-TR (in 50 mM Tris–HCl pH 7.5, 0.5% Tween 20 and 50 nM S15-TR); dashed-dotted line, junction in the presence of 50 nM S15-TR after addition of a 50-fold excess of unlabelled competitor RNA. The RNA concentration is 20 nM. Upon addition of an excess of unlabeled RNA, the Fl/TMR junction is displaced from S15-TR, and the spectra overlays that of the free folded junction reasonably well. This confirms that addition of a compound that interferes with binding of S15-TR to the Fl/TMR junction can be detected from changes in FRET to S15-TR via an increase in the ratio of the emission intensities at 581 and 614 nm (TMR/TR).
Table 1. Characteristic emission ratios for unfolded, folded and S15-bound 16S rRNA 3WJ.
| F528/F581 | F528/614 | F581/F614 | |
|---|---|---|---|
| Unfolded RNA | 2.3 | 6.3 | 2.8 |
| Folded RNA | 0.7 | 2.2 | 3.2 |
| S15-bound RNA | 2.1 | 1.6 | 0.8 |
Ratios are calculated from spectra shown in Figure 3. The indicators for RNA folding (F528/F581) and for S15 binding (F581/F614) are highlighted in bold.
Binding of aminoglycosides
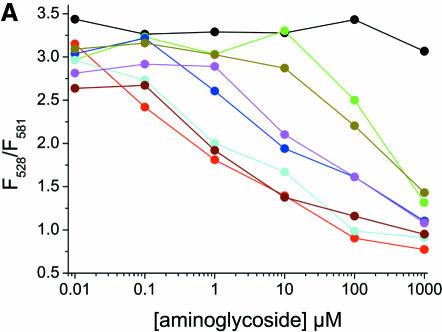
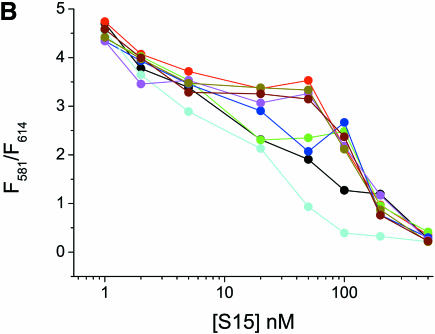
Aminoglycoside antibiotics are a diverse family of compounds that have been shown to specifically target different RNAs (7–15). They also interact with RNA non-specifically due to their multiple positive charges at neutral pH. To test the fluorescence assay with compounds known to interact with RNA, the Fl/TMR 3WJ was titrated with gentamicin, hygromycin, kanamycin B, neomycin, paromomycin, streptomycin and tobramycin (Figs 5A and 6A). All of the aminoglycosides tested induce folding of the junction. Presumably, they bind to the RNA and act in a similar manner to the Mg2+ ions that stabilize the compact folded form by electrostatic screening of negatively charged phosphates in the junction region. Titrations of the Fl/TMR junction with S15-TR in the presence of 5 mM concentrations of aminoglycosides do not show any inhibition of S15 binding to the junction, however (Fig. 5B), indicating that the S15 binding site is not blocked by these aminoglycosides.
Figure 5.
Interactions of the Fl/TMR junction with aminoglycosides. (A) The Fl/TMR 3WJ (20 nM, black) was titrated with gentamicin (red), hygromycin (green), kanamycin (blue), neomycin (cyan), paromomycin (magenta), streptomycin (dark yellow) and tobramycin (brown). The ratio of Fl/TMR emission is monitored as a probe for junction folding. (B) Titration of the Fl/TMR 3WJ (20 nM, black) with S15-TR in the presence of 5 mM aminoglycoside. The color scheme is the same as in (A). The ratio of TMR/TR emission is monitored as a probe for S15 binding. While all aminoglycosides appear to stabilize the folded conformer of the junction with different concentration dependence, none of them inhibits S15 binding.
Figure 6.
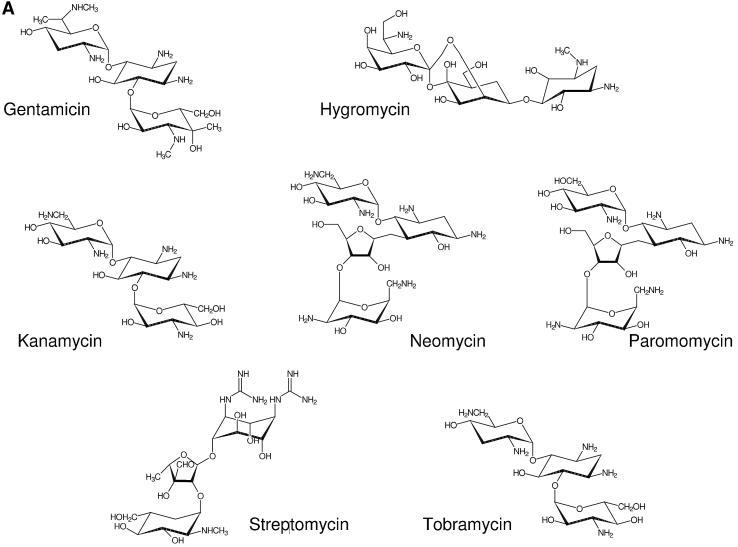
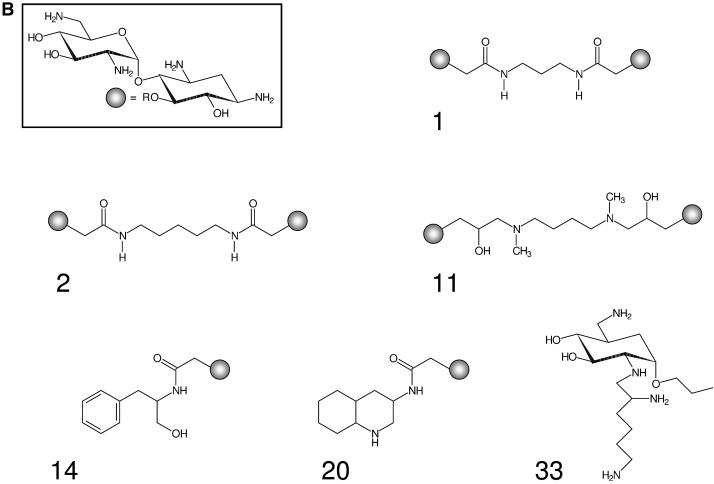
Structures of aminoglycosides and library compounds. (A) Structural formulae of gentamicin, hygromycin, kanamycin, neomycin, paromomycin, streptomycin and tobramycin. (B) Structural formulae of library compounds 1, 2, 11, 14, 20 and 33. The neamine moiety is attached to the linkers at the 5-O position.
Assay with RNA only
Aminoglycosides have been used as lead compounds to optimize binding and inhibition properties. We constructed a small library of synthetic neamine-based aminoglycoside analogs comprising neamine dimers connected by various linkers (compounds 1–12), neamine carrying different substituents in the 5-O position (compounds 13–31), ribostamycin substituted at the ribose (compound 32) and substituted amino sugars (compounds 33 and 34) (Fig. 6) (8,9). Most of compounds 1–12 inhibit translation by binding to the A site of prokaryotic rRNA at micromolar concentrations. In addition, some of them are poor substrates for the aminoglycoside-modifying enzymes that are the major cause of aminoglycoside resistance (9). Most of compounds 13–31 bind to the oncogenic Bcr-Abl mRNA (8).
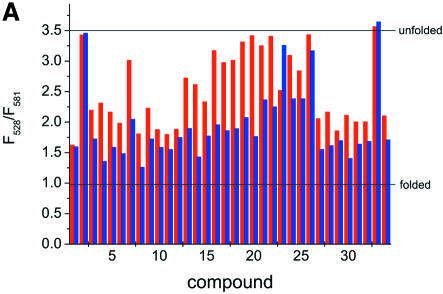
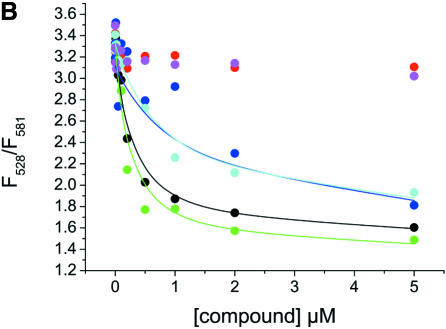
To investigate the effect of the aminoglycoside library compounds on the folding of the junction, the fluorescence emission intensities at 528 and 581 nm of the 20 nM Fl/TMR junction in 50 mM Tris–HCl pH 7.5 and 0.5% Tween 20 were measured in the presence of 1 and 10 µM concentrations of compounds 1–34 (Fig. 7A). The ratio of the emission intensities contains information on the folding state of the junction: a value of 3–3.5 (F528/F581) is indicative of an unfolded RNA junction, while a low value of ∼1 is characteristic of the folded junction (Table 1). The ratios observed in the presence of the library compounds cover the whole range of possible values, indicating that most of the compounds favor junction folding but with different efficiencies. According to their effect, the compounds can be assigned to three different classes: (i) no effect at 1 or 10 µM compound concentration, (ii) binding that titrates in the concentration range 1–10 µM and (iii) binding that is already complete at 1 µM compound concentration with no change at 10 µM. Titrations of the Fl/TMR-labeled junction with compounds 1, 2, 11, 14, 20 and 33, selected from each class, were performed to test whether differences in assay results reflect differences in binding affinity (Fig. 7B). While compounds 2 and 33 show no effect in the assay at either concentration, indicating that they bind to the junction with Kd » 10 µM, the effects of compounds 1 and 11 are (almost) complete at 1 µM ligand concentration, indicating that the Kd in these cases is <1 µM. Compounds 14 and 20 show a small effect at a concentration of 1 µM, and increased effects at 10 µM, suggesting that the Kd is in the range 1–10 µM. Consistently, non-linear least-squares analysis of the titration curves assuming a simple 1:1 binding mode yields Kd values of 0.24 ± 0.05 and 0.20 ± 0.05 µM for compounds 1 and 11, respectively, and Kd values of 1.2 ± 0.4 and 0.8 ± 0.2 µM for compounds 14 and 20, respectively. For compounds 2 and 33, no changes are observed, consistent with Kd >> 10 µM. These results confirm that in the range of concentrations used in the assay, differences in Kd values of a factor of 5 can be easily detected. According to the signals obtained at different concentrations, the assay is sensitive towards substances that form complexes with the RNA in the Kd range 0.1–5 µM.
Figure 7.
FRET assay of compounds 1–34 with the RNA junction. (A) Fl/TMR emission of 20 nM Fl/TMR junction in the presence of 1 and 10 µM concentrations of compounds 1–34. The lines indicate values for extended and folded junctions as determined in a control experiment. Except for compounds 2 and 33, all compounds favor folding of the junction to different extents. Three classes of compound can be distinguished: (1) the compound shows no effect at 1 or 10 µM; (2) the effect titrates in the concentration range 1–10 µM; (3) the effect is already complete at 1 µM with no further change at 10 µM. (B) Titration curves of the junction and selected compounds: 1 (black), 2 (red), 11 (green), 14 (blue), 20 (cyan) and 33 (magenta). Twenty nanomolar Fl/TMR junction were titrated with compounds 2 and 33 (class 1), 14 and 20 (class 2) and 1 and 11 (class 3). Consistent with the assay results, compounds 2 and 33 do not show binding in this concentration range, and compounds 1 and 11 already reach saturation at concentrations <1 µM. Non-linear least-squares analysis of the titration curves according to a simple 1:1 binding model yields Kd values of 0.24 ± 0.05 µM (compound 1), 0.20 ± 0.05 µM (compound 11), 1.2 ± 0.4 µM (compound 14) and 0.8 ± 0.2 µM (compound 20). These results are in good agreement with the estimates obtained from two concentrations in the assay.
Assay in the presence of S15
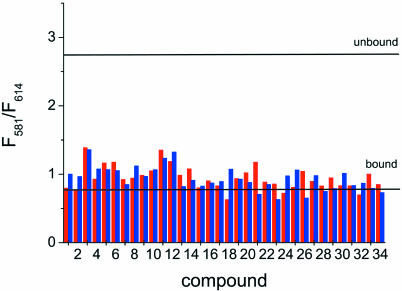
The same library was screened to look for inhibitors of S15 binding. The fluorescence emission intensities at 581 and 614 nm of 20 nM Fl/TMR junction in 50 mM Tris–HCl pH 7.5 and 0.5% Tween 20 were measured in the presence of 1 and 10 µM concentrations of compounds 1–34 and 50 nM S15-TR (Fig. 8). As demonstrated by the spectra of free (unfolded or folded) and S15-TR-bound Fl/TMR junctions (Figs 2 and 3), the ratio of the emission intensities at 581 nm (TMR) and 614 nm (TR) is indicative of S15 binding: a high value of 3–4 is characteristic of free RNA and S15, while a low value of ∼0.7 is characteristic of S15 bound to the RNA. None of the compounds result in a high fluorescence ratio, suggesting that even though most of the library compounds promote folding of the RNA junction, none affects S15 binding to the junction.
Figure 8.
FRET assay in the presence of S15-TR. TMR/TR emission of the Fl/TMR junction (20 nM) in the presence of 50 nM S15-TR and 1 and 10 µM concentrations of compounds 1–34. The lines indicate values for bound and free junction as determined in a control experiment. None of the compounds in this small library interferes with S15 binding to the 16S rRNA 3WJ.
DISCUSSION
We have shown that a three-fluorophore assay with one fluorescence donor and two acceptors can monitor two different molecular events during ribosome assembly simultaneously. By placing the donor and acceptor 1 on an RNA molecule and acceptor 2 on a protein binding to this RNA, both a conformational change within the RNA and the binding of the protein to the RNA can be followed. Even though the introduction of three bulky fluorophores is a major modification of the protein–RNA complex, no deleterious effects on the conformational change itself or on S15 binding were detected. The ratiometric approach allows for unambiguous assignment of the three species occurring: unfolded RNA, folded RNA and folded RNA bound to protein. This example shows that, with careful design, fluorescence methods are applicable to complex molecular events.
Importance of RNA as a target
RNA is an important therapeutic target due to its key function in many biological processes such as protein biosynthesis, splicing and viral replication. Various RNA aptamer structures have demonstrated that RNA can define specific binding sites for small molecules such as FMN (16,17), cAMP and cGMP (18,19), theophylline (17,20), aminoglycosides (21,22) and fluorophores (23) [reviewed in (24,25)]. Conformational changes in RNA are ubiquitous events that are often strictly regulated and constitute crucial steps in RNA folding. Therefore, finding inhibitors for conformational changes is an approach easily adaptable to other RNA targets. The universal nature of RNA conformational changes, which inevitably result in intramolecular distance changes, leads to a broad application range of FRET assays. As most prokaryotic sequences differ from the corresponding eukaryotic sequences, they provide specific targets to interfere with prokaryotic life without exerting side-effects on the eukaryotic host.
Aminoglycosides
To identify a lead compound for inhibitors of ribosome assembly using our model system consisting of the Bacillus stearothermophilus ribosomal central domain 3WJ and S15, the particular compound needs to show high-affinity binding to the RNA and overlap of its binding site with S15 binding. Aminoglycosides are positively charged amino sugars that interact both specifically and non-specifically with different RNA molecules with affinities in the low micromolar range (7–11). In addition to the decoding region of prokaryotic rRNA (12), targets for aminoglycoside binding include the group I intron (14), hammerhead ribozymes (13) and the transcriptional activator region RRE from HIV (15). The number of different targets for aminoglycosides suggests that many structural solutions exist that provide RNA binding interfaces for these antibiotics. In general, aminoglycosides bind to the major groove of an irregular helix (26). Aminoglycosides are relatively flexible structures that can be accommodated in a binding pocket. Two types of binding site have been proposed: asymmetric internal loops and metal ion binding sites (26). Altogether, they seemed to be well suited as test compounds for optimization of assay conditions. All seven aminoglycosides tested favor folding of the 16S rRNA 3WJ, presumably by screening a high negative charge density in the compact folded structure. The binding affinities decrease in the following order: gentamicin > tobramycin > neomycin = kanamycin > paromomicin = streptomycin > hygromycin. However, none of these compounds competes for S15 binding with the RNA junction at the concentrations tested. The reason could be non-overlapping binding sites for S15 and the aminoglycosides, or low binding affinities compared with the tight binding of S15 to its RNA target.
Binding of library compounds to the 3WJ
Based on aminoglycoside structures, a library was constructed that exploits the potential of this class of antibiotics for specific binding in an effort to achieve tighter/specific binding by introducing various additional groups (Fig. 6). The modifications could also provide compounds better suited for medical applications, such as compounds less prone to resistance or with fewer side-effects.
In summary, the library compounds could be grouped into three different classes: (i) no effect, (ii) intermediate favorable effect and (iii) strong favorable effect on folding of the central domain 3WJ. None of the compounds showed an inhibitory effect on S15 binding, however. This illustrates that the mere selection for binding to the junction in the absence of S15 does not necessarily identify binders that are able to compete with S15 binding. Therefore the three-fluorophore assay that monitors the effect on two molecular events is able to identify competitive binders that may serve as lead compounds.
Library compounds 2 (a neamine dimer) and 33 (an amino sugar derivative) had no effect on junction folding. In contrast to the observations with the S15 binding site, compound 2 is an inhibitor of translation, efficient at low micromolar concentrations (9). This difference indicates that compound 2 does not exert its inhibitory effect on translation via the S15 binding site, nor can the potential of a compound as an inhibitor be judged from its effect on different, but chemically similar, targets. Compounds 1 and 11, both neamine dimers, showed an intermediate effect on folding of the central domain 3WJ. Compounds 1 and 2 have a similar effect on in vitro translation and similar antibiotic activity (9), yet they act completely differently on the S15 binding site as a target. Compound 11 contains two stereocenters (R,R). Interestingly, the (S,S) stereoisomer (compound 7) binds with lower affinity to the junction, indicating that some specificity can be gained from stereochemistry. Compounds 14 and 20, both intermediate binders to the S15 binding site, are neamines carrying different substituents. While they have similar effects on the S15 binding site, compound 20 shows 5-fold tighter binding to the oncogenic Brc-Abl mRNA (8). Altogether it is very clear that good binders for one RNA target are not necessarily similarly effective for another RNA target. This low predictability renders an efficient high-throughput assay even more important for screening a wide variety of compounds.
Potential of the assay
Fluorescence enables rapid screening of large numbers of compounds. Less than 1 nmol of RNA is needed to screen 1000 compounds at two different concentrations in our assay. Naturally, the less substance that is required, the stronger the interaction studied. To achieve high-throughput capability, the substance requirements can be lowered even further if fluorophores with higher extinction coefficients and quantum yields are used. Site-specific introduction of fluorescent groups into RNA is possible via standard procedures (27). Owing to the large linear range of our fluorescence assay, it provides a large working range of fluorophore concentrations and is adaptable to RNA–protein interactions with different affinities. The ratiometric approach leads to a robustness of the assay. However, inconsistencies may occur for strongly absorbing compounds or compounds with high autofluorescence. Once an effective compound has been identified for a specific target, the assay can be easily adapted to counter-screening to determine the target specificity of potential lead compounds.
Conclusions
We have shown that three fluorescence values are sufficient to determine the effect of a potential inhibitor on two different molecular events. We can independently monitor an RNA folding step and a protein binding step in a single assay. Application of this assay in high-throughput mode with a large compound library offers the opportunity to identify small-molecule inhibitors of ribosome assembly.
Acknowledgments
ACKNOWLEDGEMENTS
We thank the Schultz laboratory for providing experimental time on the fluorescence plate reader, and Jeffrey Orr and Markus Rudolph for helpful discussions. This work was supported by a grant from the NIH (GM-53757 to J.R.W.), an EMBO long-term fellowship (to D.K.) and the Skaggs Institute for Chemical Biology.
REFERENCES
- 1.Mizushima S. and Nomura,M. (1970) Assembly mapping of 30S ribosomal proteins from E.coli. Nature, 226, 1214–1218. [DOI] [PubMed] [Google Scholar]
- 2.Held W.A., Ballou,B., Mizushima,S. and Nomura,M. (1974) Assembly mapping of 30S ribosomal proteins from Escherichia coli. J. Biol. Chem., 249, 3103–3111. [PubMed] [Google Scholar]
- 3.Orr J.W., Hagerman,P.J. and Williamson,J.R. (1998) Protein and Mg2+-induced conformational changes in the S15 binding site of 16S ribosomal RNA. J. Mol. Biol., 275, 453–464. [DOI] [PubMed] [Google Scholar]
- 4.Kim H.D., Nienhaus,G.U., Ha,T., Orr,J.W., Williamson,J.R. and Chu,S. (2002) Mg2+-dependent conformational change of RNA studied by fluorescence correlation and FRET on immobilized single molecules. Proc. Natl Acad. Sci. USA, 99, 4284–4289. [DOI] [PMC free article] [PubMed] [Google Scholar]
- 5.Ha T., Zhuang,X., Kim,H.D., Orr,J.W., Williamson,J.R. and Chu,S. (1999) Ligand-induced conformational changes observed in single RNA molecules. Proc. Natl Acad. Sci. USA, 96, 9077–9082. [DOI] [PMC free article] [PubMed] [Google Scholar]
- 6.Agalarov S.C., Sridhar Prasad,G., Funke,P.M., Stout,C.D. and Williamson,J.R. (2000) Structure of the S15,S6,S18-rRNA complex: assembly of the 30S ribosome central domain. Science, 288, 107–113. [DOI] [PubMed] [Google Scholar]
- 7.Walter F., Vicens,Q. and Westhof,E. (1999) Aminoglycoside–RNA interactions. Curr. Opin. Chem. Biol., 3, 694–704. [DOI] [PubMed] [Google Scholar]
- 8.Sucheck S.J., Greenberg,W.A., Tolbert,T.J. and Wong,C.H. (2000) Design of small molecules that recognize RNA: development of aminoglycosides as potential antitumor agents that target oncogenic RNA sequences. Angew. Chem. Int. Ed. Engl., 39, 1080–1084. [DOI] [PubMed] [Google Scholar]
- 9.Sucheck S.J., Wong,A.L., Koeller,K.M., Boehr,D.D., Draker,K., Sears,P., Wright,G. and Wong,C.H. (2000) Design of bifunctional antibiotics that target bacterial rRNA and inhibit resistence-causing enzymes. J. Am. Chem. Soc., 122, 5230–5231. [Google Scholar]
- 10.Cho J. and Rando,R.R. (1999) Specificity in the binding of aminoglycosides to HIV-RRE RNA. Biochemistry, 38, 8548–8554. [DOI] [PubMed] [Google Scholar]
- 11.Wang Y. and Rando,R.R. (1995) Specific binding of aminoglycoside antibiotics to RNA. Chem. Biol., 2, 281–290. [DOI] [PubMed] [Google Scholar]
- 12.Fourmy D., Recht,M.I., Blanchard,S.C. and Puglisi,J.D. (1996) Structure of the A site of Escherichia coli 16S ribosomal RNA complexed with an aminoglycoside antibiotic. Science, 274, 1367–1371. [DOI] [PubMed] [Google Scholar]
- 13.Stage T.K., Hertel,K.J. and Uhlenbeck,O.C. (1995) Inhibition of the hammerhead ribozyme by neomycin. RNA, 1, 95–101. [PMC free article] [PubMed] [Google Scholar]
- 14.vonAhsen U., Davies,J. and Schroeder,R. (1991) Antibiotic inhibition of group I ribozyme function. Nature, 353, 368–370. [DOI] [PubMed] [Google Scholar]
- 15.Zapp M.L., Stern,S. and Green,M.R. (1993) Small molecules that selectively block RNA binding of HIV-1 Rev protein inhibit Rev function and viral production. Cell, 74, 969–978. [DOI] [PubMed] [Google Scholar]
- 16.Soukup G.A. and Breaker,R.R. (1999) Engineering precision RNA molecular switches. Proc. Natl Acad. Sci. USA, 96, 3584–3589. [DOI] [PMC free article] [PubMed] [Google Scholar]
- 17.Robertson M.P. and Ellington,A.D. (2000) Design and optimization of effector-activated ribozyme ligases. Nucleic Acids Res., 28, 1751–1759. [DOI] [PMC free article] [PubMed] [Google Scholar]
- 18.Soukup G.A., DeRose,E.C., Koizumi,M. and Breaker,R.R. (2001) Generating new ligand-binding RNAs by affinity maturation and disintegration of allosteric ribozymes. RNA, 7, 524–525. [DOI] [PMC free article] [PubMed] [Google Scholar]
- 19.Koizumi M., Soukup,G.A., Kerr,J.N. and Breaker,R.R. (1999) Allosteric selection of ribozymes that respond to the second messengers cGMP and cAMP. Nature Struct. Biol., 6, 1062–1071. [DOI] [PubMed] [Google Scholar]
- 20.Soukup G.A., Emilsson,G.A. and Breaker,R.R. (2000) Altering molecular recognition of RNA aptamers by allosteric selection. J. Mol. Biol., 298, 623–632. [DOI] [PubMed] [Google Scholar]
- 21.Hamasaki K., Killian,J., Cho,J. and Rando,R.R. (1998) Minimal RNA constructs that specifically bind aminoglycoside antibiotics with high affinities. Biochemistry, 37, 656–663. [DOI] [PubMed] [Google Scholar]
- 22.Cho J., Hamasaki,K. and Rando,R.R. (1998) The binding site of a specific aminoglycoside binding RNA molecule. Biochemistry, 37, 4985–4992. [DOI] [PubMed] [Google Scholar]
- 23.Holeman L.A., Robinson,S.L., Szostak,J.W. and Wilson,C. (1998) Isolation and characterization of fluorophore-binding RNA aptamers. Fold. Des., 3, 423–431. [DOI] [PubMed] [Google Scholar]
- 24.Ramos A., Gubser,C.C. and Varani,G. (1997) Recent solution structures of RNA and its complexes with drugs, peptides and proteins. Curr. Opin. Struct. Biol., 7, 317–323. [DOI] [PubMed] [Google Scholar]
- 25.Famulok M. (1999) Oligonucleotide aptamers that recognize small molecules. Curr. Opin. Struct. Biol., 9, 324–329. [DOI] [PubMed] [Google Scholar]
- 26.Schroeder R., Waldsich,C. and Wank,H. (2000) Modulation of RNA function by aminoglycoside antibiotics. EMBO J., 19, 1–9. [DOI] [PMC free article] [PubMed] [Google Scholar]
- 27.Qin P.Z. and Pyle,A.M. (1999) Site-specific labeling of RNA with fluorophores and other structural probes. Methods, 18, 60–70. [DOI] [PubMed] [Google Scholar]


