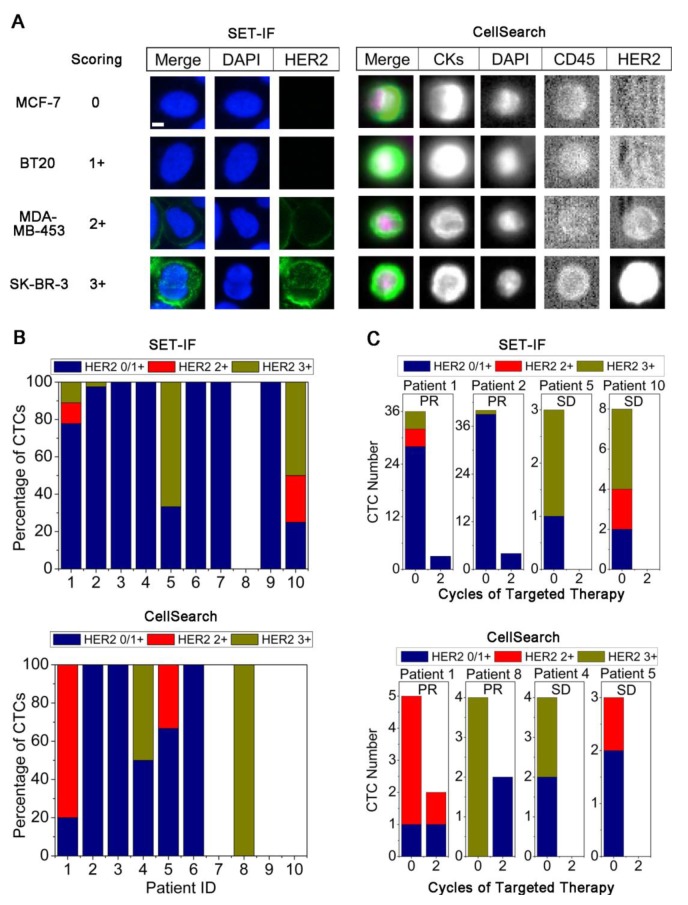
Figure 2. Detection of HER2 expression status on CTCs.
(A) Quantification of immnuofluorescence stained HER2 on cell lines performed by SET-IF and CellSearch. HER2 expression was quantified by Alexa 488-conjugated anti-HER2 (green) for SET-IF and FITC labeled anti-HER2 for CellSearch. Scale bar = 5 μm. (B) Detection of HER2 expression on CTCs enriched from pathological HER2+ AGC patients by SET-IF or CellSearch. (C) Changes of total CTCs and HER2+ CTCs following HER2-targeted therapy.

