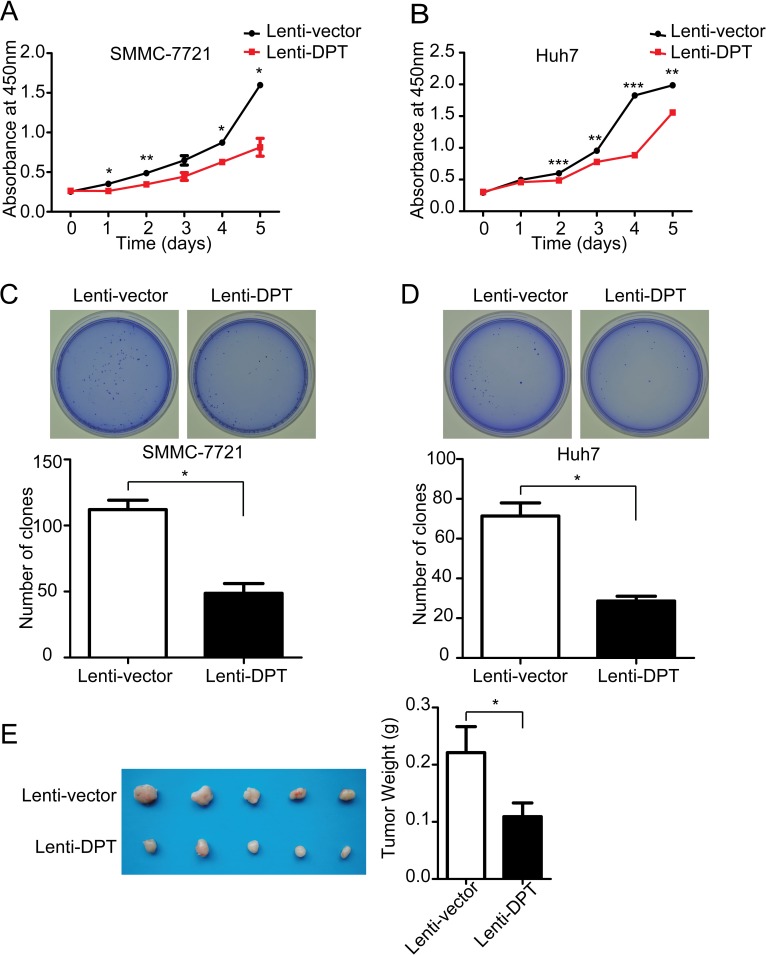
Figure 4. DPT overexpression suppresses HCC cell proliferation in vitro and tumor growth in vivo.
(A) Cell proliferation analysis of Lenti-vector/SMMC-7721 and Lenti-DPT/SMMC-7721 cells, as measured by CCK-8 assay. n = 6. Values are means ± SEM (*P < 0.05, **P < 0.01). (B) Cell proliferation analysis of Lenti-vector/Huh7 cells and Lenti-DPT/Huh7 cells, as measured by CCK-8 assay. n = 6. Values are means ± SEM (**P < 0.01, *** P < 0.001). (C-D) The representative dishes show the colony formation results of DPT overexpression on SMMC-7721 (C) and Huh7 (D) cells. Statistical analysis of the colonies number was made from 3 independent experiments (means ± SEM, *P < 0.05). (E) Morphologic characteristics of tumors (left) and tumor weight analysis (right) of Lenti-vector/SMMC-7721-inoculated mice and Lenti-DPT/SMMC-7721-inoculated mice sacrificed at six weeks. n = 5. The results shown are means ± SEM (*P < 0.05).

