
Figure 1. The CycHyp and ContHyp signatures.
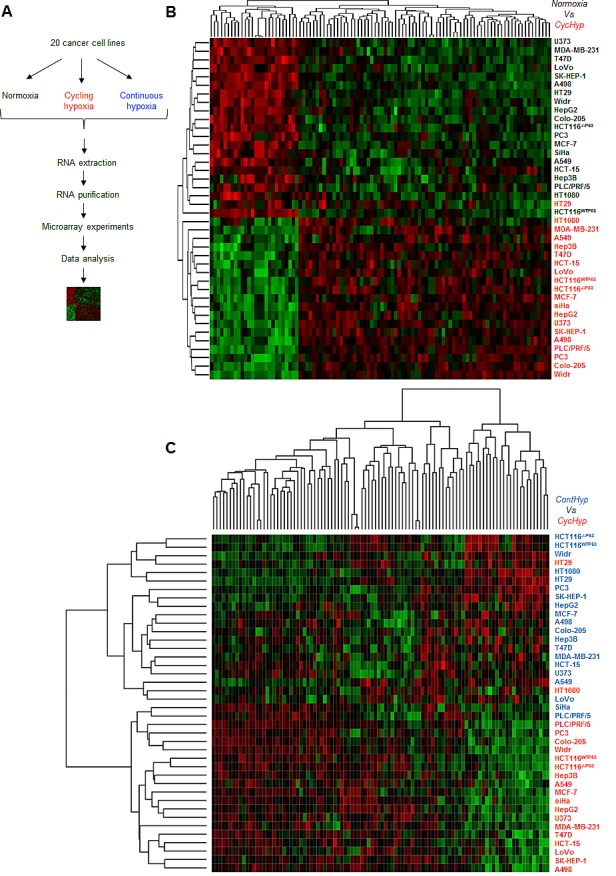
(A.) Flowchart of the signature determination from tumor cells exposed either to normoxia, cycling or continuous hypoxia. (B.) Heatmap depicting the transcripts from the CycHyp signature either underexpressed (green) or overexpressed (red) (centered to median values). Each column corresponds to a specific human Gene 1.0 ST probeset ; each line represents a specific cell line either maintained under normoxia (black label) or exposed to cycling hypoxia (red label); cells under normoxia and cycling hypoxia are perfectly separated in two distinct clusters, except for one cycling hypoxia sample in the normoxia cluster. (C.) Similarly, a heatmap depicting the relative expression of transcripts from the CycHyp signature in the cell lines maintained under continuous hypoxia (blue) or cycling hypoxia (red); only two cycling hypoxia samples are grouped with the continuous hypoxia samples.