Abstract
PTPRD encodes the protein tyrosine phosphatase receptor type D and is frequently inactivated across many human cancers. Despite its frequent inactivation, it is unknown whether loss of PTPRD promotes tumorigenesis in vivo. PTPRD is located on chromosome 9p, as is CDKN2A, and the two loci are frequently deleted together. Here, we show that co-deletion of Ptprd and Cdkn2a cooperate to accelerate tumorigenesis. Interestingly, heterozygous loss of Ptprd was sufficient to promote tumorigenesis in our model, suggesting that Ptprd may be a haploinsufficient tumor suppressor. The loss of Ptprd resulted in changes to the tumor spectrum in mice and increased the frequency of lymphomas. In total, we reveal that Ptprd is a tumor suppressor that can promote tumorigenesis in concert with Cdkn2a loss.
Keywords: PTPRD, CDKN2A
INTRODUCTION
Protein tyrosine phosphatase receptor type D (PTPRD) is a tumor suppressor gene on chromosome 9p. PTPRD inactivation is common in human malignancies and occurs in a number of cancer types including colorectal, esophageal adenocarcinoma, neuroblastoma, renal cell carcinoma, Ewing sarcoma, chronic myeloid leukemia, squamous cell carcinoma of the vulva, breast, lung cancer, melanoma, and glioblastoma [1,2,3,4,5,6,7,8,9,10,11]. Despite the high prevalence of PTPRD inactivation in human tumors, it is not known whether loss of PTPRD directly promotes tumorigenesis in vivo.
In humans, PTPRD is located on 9p23-24.3 and is telomeric to CDKN2A. The CDKN2A gene produces the p16Ink4a and p14/p19Arf tumor suppressors [12]. We and others have shown that selective pressure exists for inactivation of both genes on chromosome 9p, by deletion or mutation [8,10,11,13,14]. Despite the potential role of PTPRD loss in cancer, Ptprd deficient mice do not spontaneously develop tumors [15]. In contrast, 69% of Cdkn2a−/− mice develop tumors at an average age of 29 weeks [16]. We generated Ptprd/Cdkn2a co-deleted mice to determine if Ptprd loss contributes to tumorigenesis.
Here, we report that in the absence of Cdkn2a, Ptprd loss results in accelerated tumor development compared to mice lacking Cdkn2a alone. Both heterozygous and homozygous deletion of Ptprd accelerated tumorigenesis suggesting that loss of one copy of Ptprd is sufficient to act on tumor initiation or growth. Furthermore, loss of Ptprd changed the tumor spectrum, resulting in greater frequencies of aggressive lymphomas and histiocytic sarcomas. Our data show that Ptprd loss contributes to tumorigenesis in the setting of Cdkn2a deletion.
RESULTS
Genetic patterns of PTPRD loss in cancer
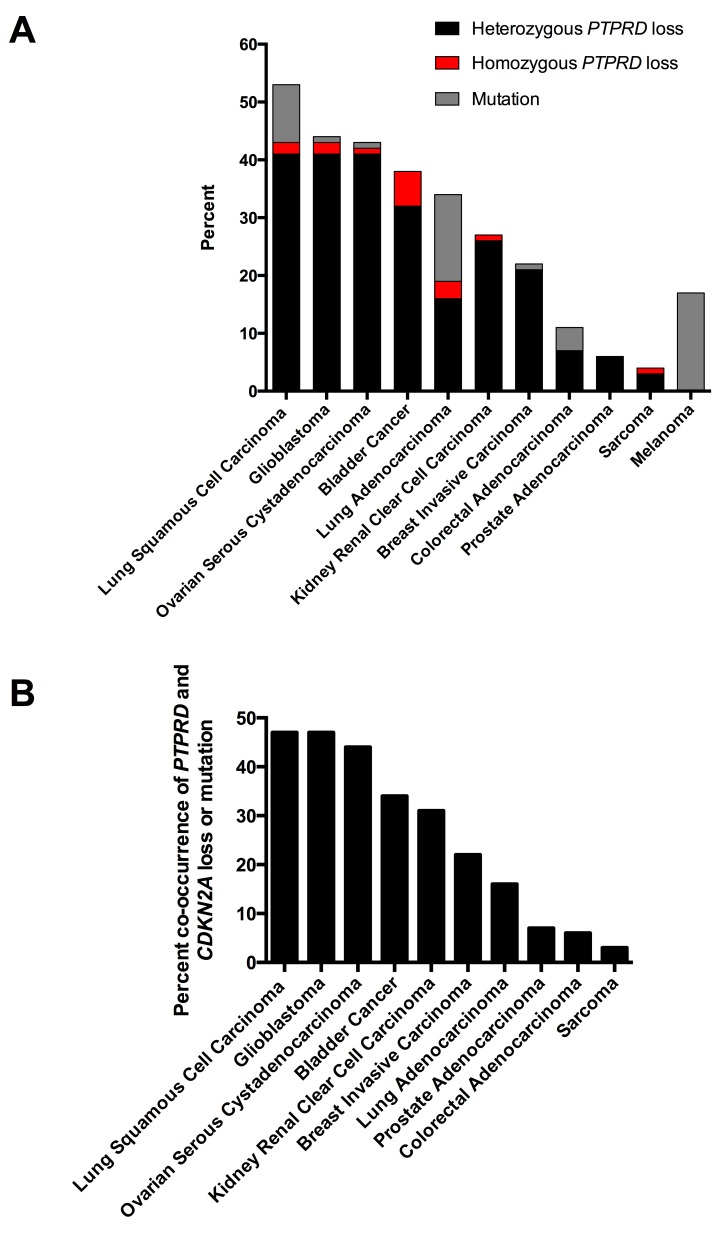
We reviewed several genomic studies to define patterns of PTPRD loss in cancer. As shown in Figure 1A, PTPRD inactivation via deletion or mutation occurs frequently. In tumors with PTPRD copy number loss, loss of one copy of PTPRD occurs most commonly (Figure 1A). Moreover, co-deletion of PTPRD and CDKN2A occurs across a number of cancer types (Figure 1B). Co-occurrence of PTPRD and CDKN2A loss is significant across cancers (Figure 1B, p<0.05, 5 > Odds Ratio < 707, Table S1).
Figure 1. Genetic patterns of PTPRD loss in human cancers.
(A) Histogram of the frequency of mutation and copy number loss of PTPRD in human cancers. Point mutations, heterozygous loss, and homozygous deletions are presented. Data from the cBio Portal. (B) Histogram of the frequency of PTPRD and CDKN2A inactivation (mutation and deletion) in human cancers. Data from the cBio Portal.
Ptprd loss cooperates with Cdkn2a deletion to promote tumorigenesis
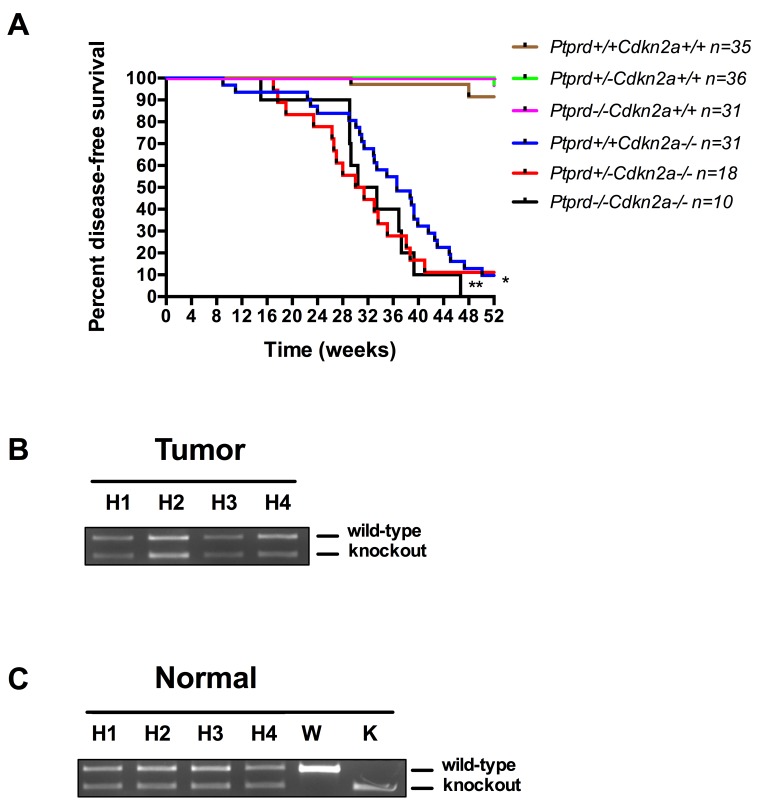
To investigate the role of Ptprd loss in tumorigenesis, we generated mice with loss of Ptprd alone, Cdkn2a, or both, and determined disease-free survival in each genotype. Mice were euthanized and necropsied at the time of onset of clinical signs (hunched, showing a swollen abdomen, or palpable lumps) or at a pre-determined endpoint. In accordance with Uetani et al. (2000), we did not observe tumor development in Ptprd+/− and Ptprd−/− mice (Figure 2A) [15]. However interestingly, Ptprd+/−Cdkn2a−/− and Ptprd−/−Cdkn2a−/− had significantly worse survival times than Ptprd+/+Cdkn2a−/− mice (Figure 2A, p<0.0001). These data suggest that Ptprd loss alone is not sufficient to initiate tumorigenesis but that in the context of Cdkn2a loss, Ptprd loss can cooperate to accelerate tumor development.
Figure 2. Ptprd loss cooperates with Cdkn2a deletion to promote tumorigenesis.
(A) Kaplan-Meier survival curve of Ptprd+/+Cdkn2a+/+ (n=35), Ptprd+/−Cdkn2a+/+ (n=36), Ptprd−/−Cdkn2a+/+ (n=31), Ptprd+/+Cdkn2a−/− (n=31), Ptprd+/−Cdkn2a−/− (n=18), and Ptprd−/−Cdkn2a−/− (n=10) mice followed for 52 weeks. *Ptprd+/−Cdkn2a−/− vs. Ptprd+/+Cdkn2a−/− and ** Ptprd−/−Cdkn2a−/− vs. Ptprd+/+Cdkn2a−/−, p-value < 0.0001. (B) PCR genotyping of tumor tissue (histiocytic sarcoma) and (C) normal tissue for Ptprd. Tumors from Ptprd+/−Cdkn2a−/− mice retain an intact wild-type Ptprd allele. H = Ptprd+/−Cdkn2a−/−, W = Ptprd+/+ control, K = Ptprd−/− control.
The results in Figure 2A suggest that loss of only one allele of Ptprd is sufficient to produce a phenotypic effect. In order to determine whether Ptprd+/− tumors retained an intact wild-type allele, we extracted DNA from tumors (histiocytic sarcoma) in Ptprd+/−Cdkn2a−/− mice and characterized Ptprd gene status using PCR. As shown in Figure 2B, tumors from Ptprd+/−Cdkn2a−/− mice retain an intact wild-type allele. As a control we extracted matched normal DNA (Figure 2C). Our results demonstrate that Ptprd loss and Cdkn2a deletion cooperate to promote tumorigenesis, and that heterozygous loss of Ptprd is sufficient to achieve this effect.
Deletion of Ptprd and Cdkn2a alters the tumor spectrum
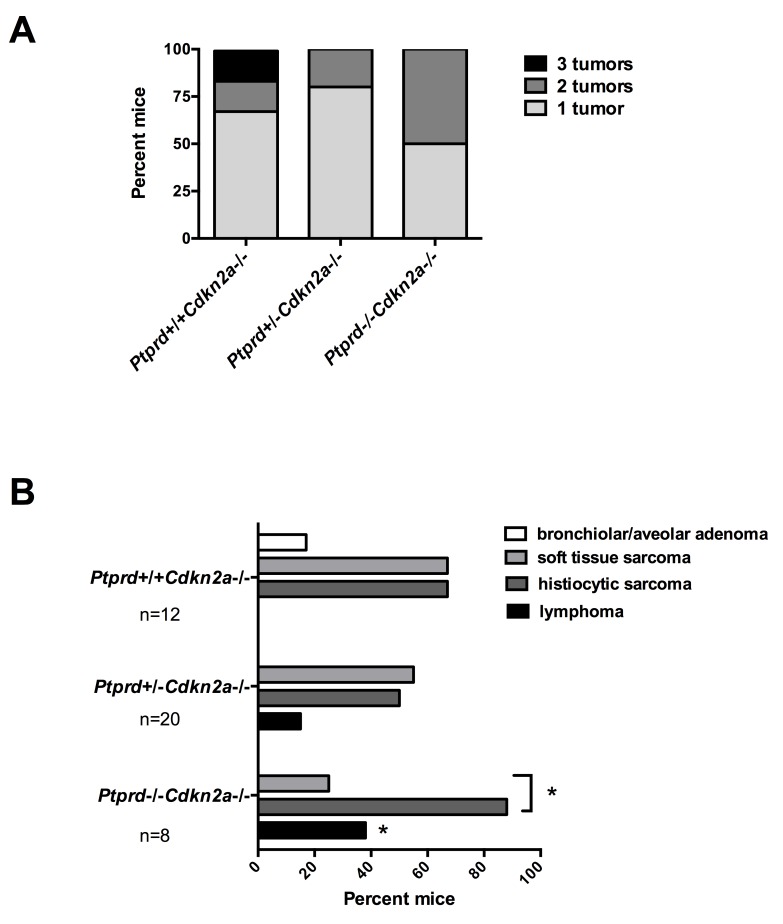
In order to determine why mice with Ptprd loss had a faster onset of clinical signs, we first examined whether mice with Ptprd and Cdkn2a deletion had a greater number of tumor types compared to mice with Cdkn2a deletion alone. As shown in Figure 3A, no significant increases in the number of tumor types were observed in mice with Ptprd loss. In fact, mice with Ptprd loss tended to have fewer types of tumors.
Figure 3. Mice with Ptprd loss and Cdkn2a deletion develop lymphomas, histiocytic sarcomas, and soft tissue sarcomas.
(A) Number of tumor types (lymphoma, histiocytic sarcoma, soft tissue sarcoma, or bronchiolar/alveolar carcinoma) per mouse of each genotype. (B) Frequency of tumor types by genotype. Ptprd+/+Cdkn2a−/− (n=12), Ptprd+/−Cdkn2a−/− (n=20), and Ptprd−/−Cdkn2a−/− (n=8) mice. *Ptprd−/−Cdkn2a−/− vs. Ptprd+/+Cdkn2a9−/− lymphomas p<0.05; *with bracket, Ptprd−/−Cdkn2a−/− histiocytic sarcomas vs. soft tissue sarcoma p<0.05.
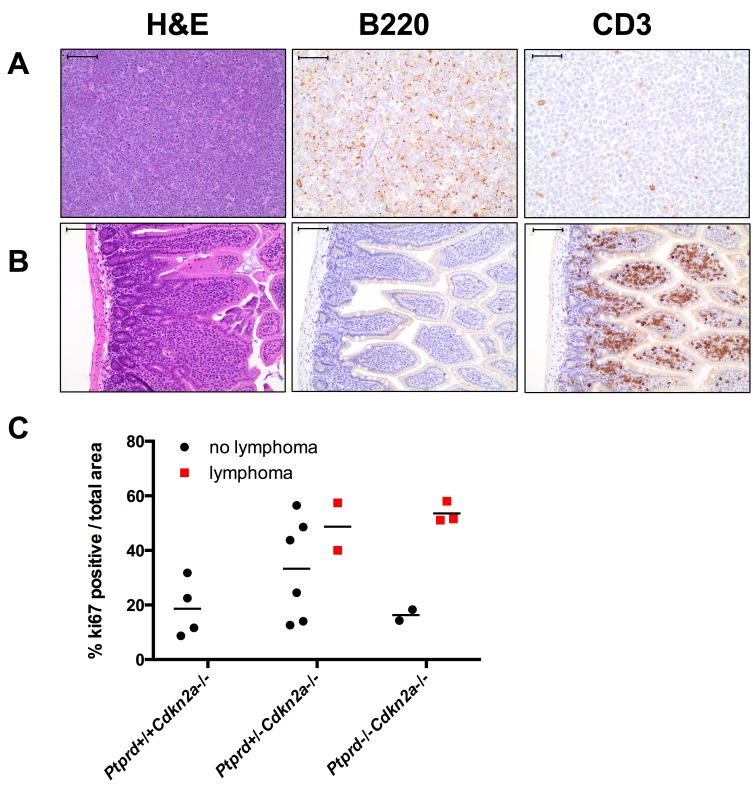
We next determined whether Ptprd and Cdkn2a deletion altered the resultant tumor spectrum. Interestingly, Ptprd−/−Cdkn2a−/− mice developed significantly more lymphomas than Ptprd+/+Cdkn2a−/− mice (Figure 3B, p<0.05). In addition, Ptprd+/−Cdkn2a−/− mice showed a trend toward developing more lymphomas than Ptprd+/+Cdkn2a−/− mice (Figure 3B). Figure 4A and B shows examples of hematoxylin and eosin stained lymphomas in the mesenteric lymph node and small intestine, respectively. These tumors were composed of sheets of discrete round cells with scant basophilic cytoplasm and large round to polygonal nuclei. The neoplastic infiltrates often effaced normal tissue architecture, particularly within the lymph nodes (Figure 4A). In order to determine the cell origin of the lymphomas, we stained the tumors for B220, a B-cell marker, and CD3, a T-cell marker (Figure 4A, B). As listed in Table S2, all Ptprd+/−Cdkn2a−/− lymphomas were of a B-cell origin. Interestingly, 2/3 of the Ptprd−/−Cdkn2a−/− tumors were of T-cell origin (Table S2, Figure 4B). In order to quantitate the proliferative index of lymphoma cells, mesenteric lymph nodes from age-matched (28-39 weeks old) mice with or without lymphoma were stained for Ki67. Lymphomas from Ptprd+/−Cdkn2a−/− mice and Ptprd−/−Cdkn2a−/− mice had increased Ki67 staining, confirming the proliferative nature of the lymphomas (Figure 4C). Lymphomas from Ptprd+/−Cdkn2a−/− and Ptprd−/−Cdkn2a−/− mice had similar levels of Ki67 staining. Our results indicate that loss of Ptprd in Cdkn2a null mice promotes the development of lymphomas.
Figure 4. Lymphomas in mice with Ptprd and Cdkn2a loss.
(A) Representative images of Ptprd+/−Cdkn2a−/− B-cell lymphoma in a mesenteric lymph node. Left, scale bar = 100μm; Middle, B220 staining is used to identify B-cells, scale bar = 50μm; Right, CD3 staining is used to identify T-cells, scale bar = 50μm. (B) Representative images of Ptprd−/−Cdkn2a−/− T-cell lymphoma in the small intestine. Left, scale bar = 100μm; Middle, B220 staining, scale bar = 100μm; Right, CD3 staining, scale bar = 100μm. (C) Lymphomas in Ptprd+/−Cdkn2a−/− or Ptprd−/−Cdkn2a−/− mice have similar proliferative indices. Age-matched mesenteric lymph nodes with and without lymphoma were stained with Ki67 by immunohistochemistry.
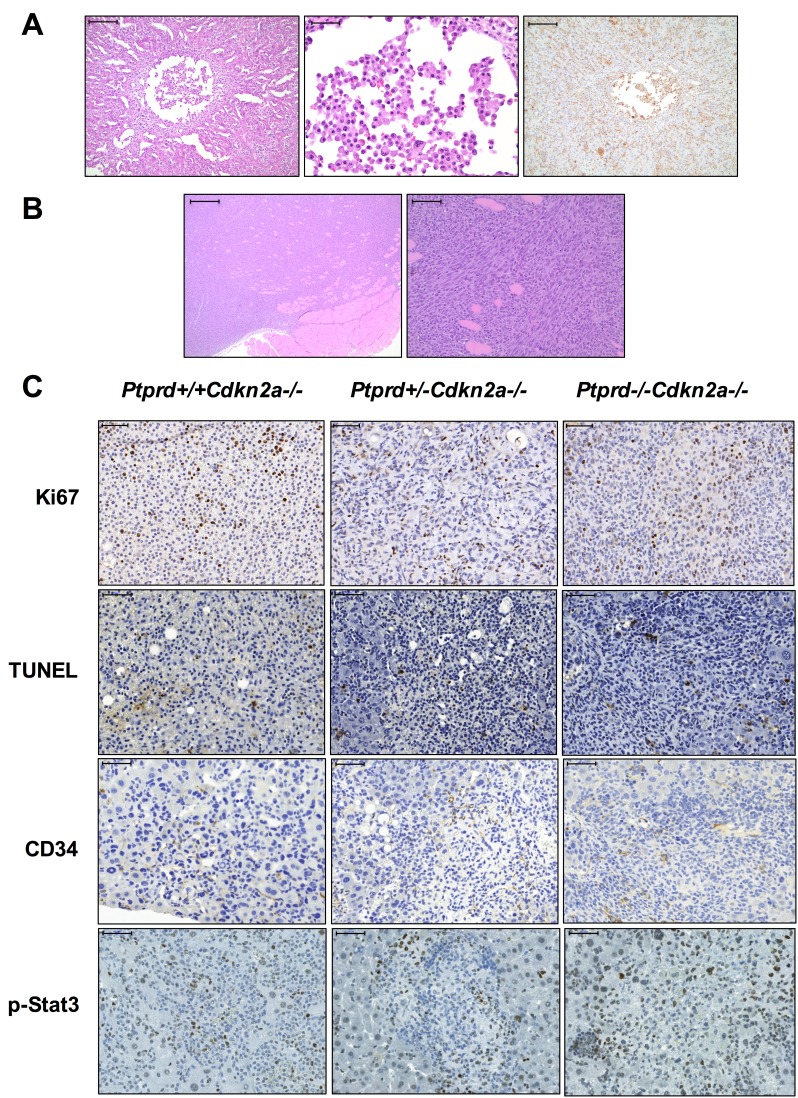
We observed that mice also developed either histiocytic sarcomas or soft tissue sarcomas (Table S2). Histiocytic sarcomas were composed of sheets of discrete round cells with moderate amounts of amphophilic cytoplasm and large round to polygonal nuclei. Within the liver, these cells frequently dissected between hepatic cords and regionally effaced normal tissue architecture (Figure 5A, left). Neoplastic cells were also frequently found within hepatic blood vessels (Figure 5A, middle). The cells stained positively with Mac2 consistent with histiocytic cell origin (Figure 5A, right). Soft tissue sarcomas (fibrosarcomas) were composed of streams, broad interlacing bundles, and frequent herringbone displays of spindle-shaped cells having moderate amounts of eosinophilic, fine fibrillar cytoplasm, poorly demarcated cell margins, and large oval to elongate nuclei. Within the skeletal muscle, these cells dissected between and frequently effaced myocytes (Figure 5B). While mice of all genotypes developed a similar frequency of sarcoma, it was interesting that Ptprd−/−Cdkn2a−/− mice developed significantly more histiocytic sarcomas than soft tissue sarcomas, suggesting that loss of both copies of Ptprd can preferentially promote the development of cancers with hematopoietic origin (Figure 3B, p<0.05).
Figure 5. Histiocytic sarcomas and soft tissue sarcomas from mice with Ptprd and Cdkn2a deletion.
(A) Representative images of histiocytic sarcoma. Left, H&E staining of Ptprd+/+Cdkn2a−/− liver histiocytic sarcoma. Left, scale bar = 200μm; Middle, higher magnification of left image with scale bar = 50μm; Right, Mac-2 staining of Ptprd+/+Cdkn2a−/− liver histiocytic sarcoma with scale bar = 200μm. (B) Representative images of soft tissue sarcoma. Left, H&E staining of Ptprd+/−Cdkn2a−/− fibrosarcoma with scale bar = 500μm; Right, higher magnification of left image with scale bar = 100μm. (C) Representative images of Ptprd+/+Cdkn2a−/−, Ptprd+/−Cdkn2a−/−, and Ptprd−/−Cdkn2a−/− histiocytic sarcomas stained with Ki67, TUNEL, CD34, and p-Stat3. Scale bars = 50μm.
We assessed levels of proliferation, apoptosis, and angiogenesis in the histiocytic and soft tissue sarcomas in Cdkn2a−/− mice with varying Ptprd genotype. All genotypes displayed positive staining for Ki67, TUNEL, and CD34, suggesting that loss of a single copy of Ptprd is sufficient to achieve tumor proliferation, apoptosis, and angiogenesis respectively (Figure 5C). However, no significant differences in the intensity or quantity of staining of Ki67, TUNEL, or CD34 were observed between the genotypes (Figure 5C, Table S3). Since it was previously shown that p-Stat3 is a substrate of PTPRD, we measured the levels of p-Stat3 by immunohistochemistry. No significant differences in the levels of p-Stat3 were observed, suggesting that Ptprd may have other substrates that mediate its tumor suppressive function in these tumor types (Figure 5C, Table S3).
DISCUSSION
Our results highlight several important observations. First, we show that Ptprd loss promotes tumorigenesis in the setting of Cdkn2a deletion. Second, we show that heterozygous loss of Ptprd is sufficient to promote tumorigenesis. This is consistent with the hypothesis that the frequently observed heterozygous loss of PTPRD in human cancers contributes to tumor development. Third, our data suggests that loss of Ptprd plays a role in determining which types of tumors form.
Somatic loss of PTPRD has been associated with tumor risk and aggressiveness [4,11]. In addition, germ-line mutations of PTPRD are hypothesized to be involved in Ewing Sarcoma and glioblastoma [5,10]. We generated a mouse model with Ptprd and Cdkn2a loss in order to study the role of Ptprd in tumorigenesis. While mice with Ptprd loss alone did not show increased tumorigenesis, mice with Ptprd and Cdkn2a deletion had significantly shorter survival times than mice with Cdkn2a deletion alone. These results support the notion that there may be selective pressure for co-deletion of these two chromosome 9p tumor suppressors in human malignancies, and support a rationale for the patterns of PTPRD loss observed in human cancers. Although loss of Ptprd and Cdkn2a may be targeted in cancer, our data does not rule out the potential role of other tumor suppressors on chromosome 9p, including Cdkn2b.
In humans, loss of chromosome 9p occurs in B-cell lymphomas [26]. Intriguingly, in our study, mice with Ptprd loss developed more lymphomas. It has been shown that PTPRD is expressed in the B-cell lineage [27]. We speculate that the loss of Ptprd in our mice may alter B-cell biology, leading to of the development of lymphoma. It was also interesting that we observed a shift in the spectrum of sarcomas to a greater number of histiocytic sarcomas in Ptprd−/−Cdkn2a−/− mice. Histiocytes, or macrophages, are derived from circulating monocytes of bone marrow origin. Again, here, it would appear that Ptprd and Cdkn2a deletion increases the propensity of mice to develop tumors of hematopoietic origin.
In summary, we show that Ptprd copy number loss and Cdkn2a deletion cooperate to promote tumorigenesis. These findings have substantial implications for our understanding of a commonly inactivated tumor suppressor. Future studies will be needed to determine why Ptprd loss promotes tumorigenesis in some cell types but not others.
METHODS
Genetic Analysis of Human Tumors
The frequency of PTPRD inactivation and the co-occurrence of PTPRD and CDKN2A deletion were identified using genomic data in the cBio Portal [28].
Generation of Mice
Ptprd heterozygous mice [15] were crossed to Cdkn2a knockout mice [16]. Mice were in a C57/Bl6 background. Mice were monitored twice a week and had complete necropsy performed if hunched, showing a swollen abdomen, or palpable lumps. Mice with Cdkn2a deletion were monitored until 52 weeks. Wild-type and mice with Ptprd loss alone were monitored for 104 weeks. Mice experiments were performed with MSKCC Institutional Animal Care and Use Committee approval.
Histology and Pathology
The following tissues were dissected, fixed in 10% formalin (Sigma), and embedded in paraffin: heart, thymus, lung, tracheal/mandibular/mesenteric lymph nodes, kidneys, liver, pancreas, spleen, gall bladder, intestines, stomach, skin, urinary bladder, uterus/cervix/vagina/ovaries or testes/epdididymis/prostate/seminal vesicles, bone marrow, vertebral column, femur/tibia/surrounding muscles, sternum, eyes, tongue, teeth, salivary glands, adrenals, thyroid, esophagus, trachea, oral-nasal cavity, olfactory bulbs, brain, ear, pituitary, and thalamus. 5μM sections were stained with hematoxylin and eosin (H&E) and reviewed by a board-certified veterinary pathologist.
Tumor Genotyping
Liver histiocytic sarcoma was macrodissected and DNA was extracted using the DNeasy Blood and Tissue kit (Qiagen). Tumors were confirmed by histological analysis. DNA from ear tissue was extracted as a normal tissue control. PCR was performed with the following Ptprd genotyping primers: 5′GGTGAAGTGTGACCAGTATTGGCC3′, 5′CTGGAATTGTCTCACTTTCCTC3′, and 5′GACTGCCTTGGGAAAAGCGCCTCC3′. Standard PCR procedures were performed with the following reaction buffer: 1M(NH4)2SO4, 2M Tris, pH 8.8, 1M MgCl2, and 14.4M B-mercaptoethanol.
Immunohistochemistry
Dissected tissues were fixed in 10% formalin and embedded in paraffin. 5μM sections were used for immunohistochemical analysis. The Leica Bond RX automated system (Leica Biosystems) was used with the Polymer Refine Detection System (Leica Biosystems) for the following antibodies: B220 (BD Biosciences cat. no. 550286, mouse monoclonal, 1:200), CD3 (Vector, cat. no. VP-RM01, rabbit monoclonal, 1:100), Ki67 (Abcam, cat. no. ab16667, rabbit monoclonal, 1:100), and CD34 (Abcam, cat. no. ab8158, rat monoclonal, 16μg/mL). The Mac-2 (Cedarlane, cat.no. CL8942B, mouse monoclonal biotinylated) staining was performed manually with 10mM citrate retrieval for 30 minutes and the standard avidin/biotin immunoperoxidase protocol. p-Stat3 immunohistochemistry was performed using the Discovery XT processor (Ventana Medical Systems). Tissue sections were blocked in 10% goat serum with 2% BSA in PBS. Primary p-Stat3 Tyr-705 (Cell Signaling, cat no. 9145, rabbit monoclonal, 0.5μg/mL) antibody was incubated for 5 hours, followed by a 60 minute incubation with biotinylated goat anti-rabbit IgG (Vector Labs, cat. no. PK6101, 1:200 dilution) according to the manufacturer's instructions. Detection was performed with Blocker D, Streptavidin-HRP and DAB kit (Ventana Medical Systems) according to the manufacturer's instructions. Slides were counterstained with hematoxylin and coverslipped with Permount (Fisher Scientific). TUNEL staining was performed manually with the following reaction mixture: 0.1M Sodium Cacodylate pH7, 0.1mM DTT, 0.05mg/mL bovine serum albumin, 2u/ul terminal transferase, 0.2nm Biotin-16-dUTP, and 2.5mM Cobalt Chloride for 1 hour at 37 degrees. The reaction was terminated with 300mM sodium chloride and 30mM sodium citrate at room temperature for 15 minutes, incubated in avidin-biotin for 30 minutes, and developed with 3,3′-Diaminobenzidine for 3 minutes.
Immunostaining Image Analysis
Whole slides were scanned with Pannoramic Flash Scanner (3DHistech, Hungary). Image analysis of tumor areas was performed with Metamorph software (Molecular Devices, PA). For analysis of immunohistochemistry images, color thresholds were set for brown positive staining and for total area (brown staining + blue nuclei).
Statistical Analysis
Unless noted, student's t-test was performed for all statistical analysis. Log-rank statistical analysis was performed for Kaplan-Meier curves. Fisher's exact test was performed for the tumor spectrum analysis.
SUPPLEMENTAL MATERIAL TABLES
Acknowledgments
We thank Armida Fabius and Sevin Turcan for helpful advice. We also thank Maria Jiao and Jacqueline Candelier of the MSKCC Comparative Pathology Core Facility, Dmitry Yarilin and Ke Xu of the MSKCC Molecular Cytology Core Facility, and the MSKCC Research Animal Resource Center for excellent technical assistance. This project was supported by grant numbers F31CA171566 (B.O.) and R01CA154767 (T.A.C.) from the National Institutes of Health. This work was also partially supported by grants from the Memorial Sloan Kettering Brain Tumor Center and the Molecular Cytology Core Facility grant P30CA008748. The content is solely the responsibility of the authors and does not necessarily represent the official views of the National Cancer Institute or the National Institutes of Health.
REFERENCES
- 1.Brim H, Abu-Asab MS, Nouraie M, Salazar J, Deleo J, Razjouyan H, Mokarram P, Schaffer AA, Naghibhossaini F, Ashktorab H. An Integrative CGH, MSI and Candidate Genes Methylation Analysis of Colorectal Tumors. PLoS One. 2014;9(1):e82185. doi: 10.1371/journal.pone.0082185. [DOI] [PMC free article] [PubMed] [Google Scholar]
- 2.Frankel A, Armour N, Nancarrow D, Krause L, Hayward N, Lampe G, Smithers BM, Barbour A. Genome-wide analysis of esophageal adenocarcinoma yields specific copy number aberrations that correlate with prognosis. Genes Chromosomes Cancer. 2014;53(4):324–338. doi: 10.1002/gcc.22143. [DOI] [PubMed] [Google Scholar]
- 3.Boeva V, Jouannet S, Daveau R, Combaret V, Pierre-Eugene C, Cazes A, Louis-Brennetot C, Schleiermacher G, Ferrand S, Pierron G, Lermine A, Rio Frio T, Raynal V, Vassal G, Barillot E, Delattre O, et al. Breakpoint features of genomic rearrangements in neuroblastoma with unbalanced translocations and chromothripsis. PLoS One. 2013;8(8):e72182. doi: 10.1371/journal.pone.0072182. [DOI] [PMC free article] [PubMed] [Google Scholar]
- 4.Du Y, Su T, Tan X, Li X, Xie J, Wang G, Shen J, Hou J, Cao G. Polymorphism in protein tyrosine phosphatase receptor delta is associated with the risk of clear cell renal cell carcinoma. Gene. 2013;512(1):64–69. doi: 10.1016/j.gene.2012.09.094. [DOI] [PubMed] [Google Scholar]
- 5.Jiang Y, Janku F, Subbiah V, Angelo LS, Naing A, Anderson PM, Herzog CE, Fu S, Benjamin RS, Kurzrock R. Germline PTPRD mutations in Ewing sarcoma: biologic and clinical implications. Oncotarget. 2013;4(6):884–889. doi: 10.18632/oncotarget.1021. [DOI] [PMC free article] [PubMed] [Google Scholar]
- 6.Gerber JM, Gucwa JL, Esopi D, Gurel M, Haffner MC, Vala M, Nelson WG, Jones RJ, Yegnasubramanian S. Genome-wide comparison of the transcriptomes of highly enriched normal and chronic myeloid leukemia stem and progenitor cell populations. Oncotarget. 2013;4(5):715–728. doi: 10.18632/oncotarget.990. [DOI] [PMC free article] [PubMed] [Google Scholar]
- 7.Micci F, Panagopoulos I, Haugom L, Dahlback HS, Pretorius ME, Davidson B, Abeler VM, Trope CG, Danielsen HE, Heim S. Genomic aberration patterns and expression profiles of squamous cell carcinomas of the vulva. Genes Chromosomes Cancer. 2013;52(6):551–563. doi: 10.1002/gcc.22053. [DOI] [PubMed] [Google Scholar]
- 8.TCGA. Comprehensive molecular portraits of human breast tumours. Nature. 2012;490(7418):61–70. doi: 10.1038/nature11412. [DOI] [PMC free article] [PubMed] [Google Scholar]
- 9.Kohno T, Otsuka A, Girard L, Sato M, Iwakawa R, Ogiwara H, Sanchez-Cespedes M, Minna JD, Yokota J. A catalog of genes homozygously deleted in human lung cancer and the candidacy of PTPRD as a tumor suppressor gene. Genes Chromosomes Cancer. 2010;49(4):342–352. doi: 10.1002/gcc.20746. [DOI] [PMC free article] [PubMed] [Google Scholar]
- 10.Solomon DA, Kim JS, Cronin JC, Sibenaller Z, Ryken T, Rosenberg SA, Ressom H, Jean W, Bigner D, Yan H, Samuels Y, Waldman T. Mutational inactivation of PTPRD in glioblastoma multiforme and malignant melanoma. Cancer Res. 2008;68(24):10300–10306. doi: 10.1158/0008-5472.CAN-08-3272. [DOI] [PMC free article] [PubMed] [Google Scholar]
- 11.Veeriah S, Brennan C, Meng S, Singh B, Fagin JA, Solit DB, Paty PB, Rohle D, Vivanco I, Chmielecki J, Pao W, Ladanyi M, Gerald WL, Liau L, Cloughesy TC, Mischel PS, et al. The tyrosine phosphatase PTPRD is a tumor suppressor that is frequently inactivated and mutated in glioblastoma and other human cancers. Proc Natl Acad Sci U S A. 2009;106(23):9435–9440. doi: 10.1073/pnas.0900571106. [DOI] [PMC free article] [PubMed] [Google Scholar]
- 12.Sherr CJ. The INK4a/ARF network in tumour suppression. Nat Rev Mol Cell Biol. 2001;2(10):731–737. doi: 10.1038/35096061. [DOI] [PubMed] [Google Scholar]
- 13.Solomon DA, Kim JS, Yang XR, Tucker MA, Goldstein AM, Samuels Y, Waldman T. Lack of inherited mutations of PTPRD in familial melanoma and melanoma-astrocytoma syndrome. Pigment Cell Melanoma Res. 2009;22(4):489–491. doi: 10.1111/j.1755-148X.2009.00587.x. [DOI] [PMC free article] [PubMed] [Google Scholar]
- 14.Beroukhim R, Mermel CH, Porter D, Wei G, Raychaudhuri S, Donovan J, Barretina J, Boehm JS, Dobson J, Urashima M, Mc Henry KT, Pinchback RM, Ligon AH, Cho YJ, Haery L, Greulich H, et al. The landscape of somatic copy-number alteration across human cancers. Nature. 2010;463(7283):899–905. doi: 10.1038/nature08822. [DOI] [PMC free article] [PubMed] [Google Scholar]
- 15.Uetani N, Kato K, Ogura H, Mizuno K, Kawano K, Mikoshiba K, Yakura H, Asano M, Iwakura Y. Impaired learning with enhanced hippocampal long-term potentiation in PTPdelta-deficient mice. Embo J. 2000;19(12):2775–2785. doi: 10.1093/emboj/19.12.2775. [DOI] [PMC free article] [PubMed] [Google Scholar]
- 16.Serrano M, Lee H, Chin L, Cordon-Cardo C, Beach D, DePinho RA. Role of the INK4a locus in tumor suppression and cell mortality. Cell. 1996;85(1):27–37. doi: 10.1016/s0092-8674(00)81079-x. [DOI] [PubMed] [Google Scholar]
- 17.TCGA. Comprehensive molecular characterization of clear cell renal cell carcinoma. Nature. 2013;499(7456):43–49. doi: 10.1038/nature12222. [DOI] [PMC free article] [PubMed] [Google Scholar]
- 18.TCGA. Integrated genomic analyses of ovarian carcinoma. Nature. 2011;474(7353):609–615. doi: 10.1038/nature10166. [DOI] [PMC free article] [PubMed] [Google Scholar]
- 19.Brennan CW, Verhaak RG, McKenna A, Campos B, Noushmehr H, Salama SR, Zheng S, Chakravarty D, Sanborn JZ, Berman SH, Beroukhim R, Bernard B, Wu CJ, Genovese G, Shmulevich I, Barnholtz-Sloan J, et al. The somatic genomic landscape of glioblastoma. Cell. 2013;155(2):462–477. doi: 10.1016/j.cell.2013.09.034. [DOI] [PMC free article] [PubMed] [Google Scholar]
- 20.Taylor BS, Schultz N, Hieronymus H, Gopalan A, Xiao Y, Carver BS, Arora VK, Kaushik P, Cerami E, Reva B, Antipin Y, Mitsiades N, Landers T, Dolgalev I, Major JE, Wilson M, et al. Integrative genomic profiling of human prostate cancer. Cancer Cell. 2010;18(1):11–22. doi: 10.1016/j.ccr.2010.05.026. [DOI] [PMC free article] [PubMed] [Google Scholar]
- 21.TCGA. Comprehensive molecular characterization of human colon and rectal cancer. Nature. 2012;487(7407):330–337. doi: 10.1038/nature11252. [DOI] [PMC free article] [PubMed] [Google Scholar]
- 22.Iyer G, Al-Ahmadie H, Schultz N, Hanrahan AJ, Ostrovnaya I, Balar AV, Kim PH, Lin O, Weinhold N, Sander C, Zabor EC, Janakiraman M, Garcia-Grossman IR, Heguy A, Viale A, Bochner BH, et al. Prevalence and co-occurrence of actionable genomic alterations in high-grade bladder cancer. J Clin Oncol. 2013;31(25):3133–3140. doi: 10.1200/JCO.2012.46.5740. [DOI] [PMC free article] [PubMed] [Google Scholar]
- 23.TCGA. Comprehensive genomic characterization of squamous cell lung cancers. Nature. 2012;489(7417):519–525. doi: 10.1038/nature11404. [DOI] [PMC free article] [PubMed] [Google Scholar]
- 24.Barretina J, Taylor BS, Banerji S, Ramos AH, Lagos-Quintana M, Decarolis PL, Shah K, Socci ND, Weir BA, Ho A, Chiang DY, Reva B, Mermel CH, Getz G, Antipin Y, Beroukhim R, et al. Subtype-specific genomic alterations define new targets for soft-tissue sarcoma therapy. Nat Genet. 2010;42(8):715–721. doi: 10.1038/ng.619. [DOI] [PMC free article] [PubMed] [Google Scholar]
- 25.Imielinski M, Berger AH, Hammerman PS, Hernandez B, Pugh TJ, Hodis E, Cho J, Suh J, Capelletti M, Sivachenko A, Sougnez C, Auclair D, Lawrence MS, Stojanov P, Cibulskis K, Choi K, et al. Mapping the hallmarks of lung adenocarcinoma with massively parallel sequencing. Cell. 2012;150(6):1107–1120. doi: 10.1016/j.cell.2012.08.029. [DOI] [PMC free article] [PubMed] [Google Scholar]
- 26.Berglund M, Enblad G, Flordal E, Lui WO, Backlin C, Thunberg U, Sundstrom C, Roos G, Allander SV, Erlanson M, Rosenquist R, Larsson C, Lagercrantz S. Chromosomal imbalances in diffuse large B-cell lymphoma detected by comparative genomic hybridization. Mod Pathol. 2002;15(8):807–816. doi: 10.1097/01.MP.0000024375.04135.2B. [DOI] [PubMed] [Google Scholar]
- 27.Mizuno K, Hasegawa K, Katagiri T, Ogimoto M, Ichikawa T, Yakura H. MPTP delta, a putative murine homolog of HPTP delta, is expressed in specialized regions of the brain and in the B-cell lineage. Mol Cell Biol. 1993;13(9):5513–5523. doi: 10.1128/mcb.13.9.5513. [DOI] [PMC free article] [PubMed] [Google Scholar]
- 28.Cerami E, Gao J, Dogrusoz U, Gross BE, Sumer SO, Aksoy BA, Jacobsen A, Byrne CJ, Heuer ML, Larsson E, Antipin Y, Reva B, Goldberg AP, Sander C, Schultz N. The cBio cancer genomics portal: an open platform for exploring multidimensional cancer genomics data. Cancer Discov. 2012;2(5):401–404. doi: 10.1158/2159-8290.CD-12-0095. [DOI] [PMC free article] [PubMed] [Google Scholar]
Associated Data
This section collects any data citations, data availability statements, or supplementary materials included in this article.


