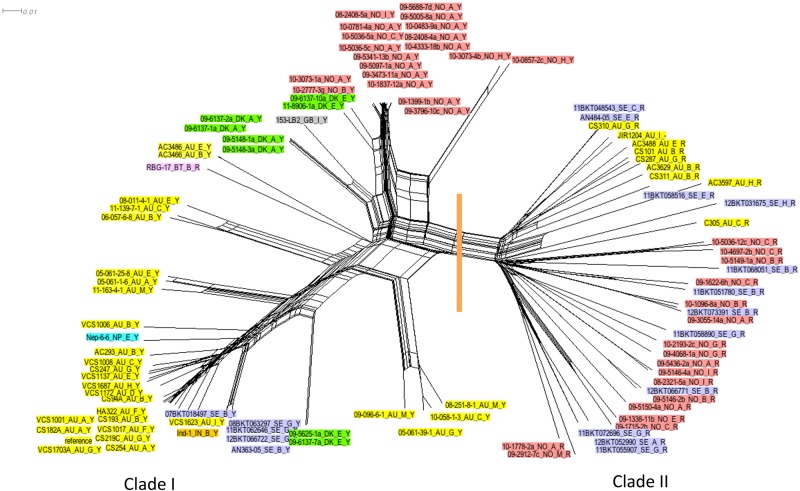
FIG 2 .
Network diagram showing the relationship between the genome sequences of 103 D. nodosus isolates. The data set used for the inference of the relationship comprised 31,627 bases from each isolate and represented conserved positions in the VCS1703A reference genome sequence; an orthologous sequence was present in each of the sequenced isolates, and the sequence in one or more of the isolates differed from that found in the reference genome sequence. The relationship shown was inferred using the parsimony-based method as implemented in SplitsTree (19). The tree is annotated with a vertical orange line, indicating a division of taxa into clade I and clade II. The taxon labels are further annotated by colors, with yellow indicating Australia, red indicating Norway, lilac indicating Sweden, and green indicating Denmark. Individual isolates from Bhutan (pink), Nepal (blue), India (orange), and the United Kingdom (gray) are also shown. The taxon labels have the following information: the name of the isolate, the serogroup, and the AprV2 type.

