


Abstract
The key step in bacterial translation is formation of the pre-initiation complex. This requires initial contacts between mRNA, fMet-tRNA and the 30S subunit of the ribosome, steps that limit the initiation of translation. Here we report a method for improving translational initiation, which allows expression of several previously non-expressible genes. This method has potential applications in heterologous protein synthesis and high-throughput expression systems. We introduced a synthetic RNA stem–loop (stem length, 7 bp; ΔG0 = –9.9 kcal/mol) in front of various gene sequences. In each case, the stem–loop was inserted 15 nt downstream from the start codon. Insertion of the stem–loop allowed in vitro expression of five previously non-expressible genes and enhanced the expression of all other genes investigated. Analysis of the RNA structure proved that the stem–loop was formed in vitro, and demonstrated that stabilization of the ribosome binding site is due to stem–loop introduction. By theoretical RNA structure analysis we showed that the inserted RNA stem–loop suppresses long-range interactions between the translation initiation domain and gene-specific mRNA sequences. Thus the inserted RNA stem–loop supports the formation of a separate translational initiation domain, which is more accessible to ribosome binding.
INTRODUCTION
In recent decades heterologous protein synthesis has become one of the most important tools in biotechnology. After the genome of an organism has been sequenced, expressing the genes is a key step in understanding their structure and function. Currently, efforts to improve protein synthesis are focused on high-throughput methods (1) and production of pharmaceuticals (2).
Efficient synthesis of recombinant proteins depends on, for example, transcription regulation, initiation of the messenger, codon bias, mRNA stability and toxicity of the gene product. Thus many experimental strategies seek to optimize these factors to achieve high expression rates (3–5).
Even today the detailed mechanism of translation is not completely understood. However, much progress has been made toward understanding the structure of the complex between the ribosome, bound mRNA and the tRNAs (6–8).
Initiation is the key step in bacterial translation (9–13). Initial contacts between mRNA, fMet-tRNA and the 30S ribosomal subunit play major roles in formation of the pre-initiation complex and the control of translation efficiency. Hence, accessibility of the Shine–Dalgarno (SD) sequence (ribosome binding site) and the start methionine have been shown to be important pre-requisites for successful initiation (9,10,12–16). The so-called SD interaction places the mRNA and the fMet-tRNA in the right position on the 30S ribosomal subunit. In this interaction the SD sequence hybridizes with the anti-SD sequence on the 16S rRNA in the 30S ribosomal subunit; the efficiency of this hybridization correlates with efficient translation (17,18).
The next step in initiation is association of the 50S ribosomal subunit with the pre-initiation complex. Finally, interaction of the second codon with its anticodon starts the elongation process (11,19).
More or less stable structures of the mRNA translation initiation region have been investigated (10,14,20). These studies, which focused on the ribosome binding site and its tendency to hybridize with nearby sequences, reported that such structures, if their free energy was weaker than –6 kcal/mol, did not affect the ribosome. However, structures that were 1.4 kcal/mol more stable reduced expression rates 10-fold (10,20).
Usually, highly expressed Escherichia coli genes have AU-rich codons immediately following the start methionine (21); GC-rich codons at these positions decrease expression rates (22). Pedersen-Lane and coworkers (22) reported that conversion of purine to thymidine bases at codon positions 3, 4 and 5 increased expression up to 25%. They concluded that expression increased because the structure of the RNA in the translation initiation region changed. Because AU-rich stretches are less likely to form secondary RNA structures, the initiation site of the mRNA was more accessible to the 30S subunit of the ribosome.
In addition, sequences that enhance expression by allowing additional base pairings between the messenger and the 16S rRNA have been described (23,24). These translational leader sequences improve the interaction of the messenger with the ribosome.
However, if the initiation of the messenger is blocked by secondary RNA structures, no common translational leader sequence to enhance expression has been described yet.
Experiments on the regulation of the A-protein gene in the RNA phage MS2 demonstrated that long-range interactions between the translation initiation region and downstream mRNA sequences prevented ribosomal initiation (16).
Similar initiation problems occurred in heterologous in vitro protein synthesis, demonstrating the need for a generally suitable translational leader sequence. Since the initiation region might be hidden by gene-specific mRNA structure (Fig. 1B), the leader sequence should alter the structure of wild-type mRNA to make the translation initiation region more accessible to ribosomes. In the present study, we inserted a stable local RNA hairpin loop downstream from the initiation region to inhibit long-range interactions between the initiation region and gene-specific mRNA sequences (Fig. 1C and D).
Figure 1.

Overview of RNA stem–loop introduction. (A) Initiation region with SD sequence, start codon and gene-specific mRNA. (B) Gene-specific mRNA sequences fold back and pair with regulatory elements of bacterial protein translation. Thus translation initiation is prevented. (C and D) Introduction of the AU-rich region and the RNA stem–loop prevents regulatory elements from pairing with downstream gene sequences. (E) Diagram of the initiation region of 1049 RNA stem–loop mutant with the RNA stem–loop formed. The diagram shows the oligonucleotides used to probe the formation of the RNA stem–loop and their hybridization targets.
We designed a translational leader sequence that contained five AU-rich codons, which show little tendency to form secondary RNA structures, and a GC-rich RNA stem–loop (7 bp; ΔG0 = –9.9 kcal/mol; positions +19 to +36). Once inserted, this leader sequence dramatically enhances the probability ofsuccessful gene expression, and prevents the bacterial initiation site from pairing with heterologous downstream mRNA sequences. This leader made the translation of a set of previously non-expressible genes possible and improved the expression of already expressible genes (e.g. GFP). In the in vitro system used, linear templates of GFP can achieve expression rates up to 230 µg/ml (25).
Based on these experiments, we conclude that inserting a 7 bp RNA stem–loop at the appropriate place in the mRNA allows formation of an isolated translation initiation domain.
MATERIALS AND METHODS
Generation of linear expression constructs
Linear expression constructs (containing the T7 promoter, the ribosome binding site (SD), the start methionine followed by the structural gene, the His6 tag, the stop codon and the T7 terminator sequences) were amplified in a two-step PCR as described (26). For wild-type constructs, the gene-specific sequence (Table 1A) was fused directly after the start codon. An insert containing an AT-rich amino acid combination (Table 1B) followed by the RNA stem–loop sequence (Table 1D) was introduced between the start AUG and the gene-specific sequence (Table 1A) to form the RNA stem–loop mutant.
Table 1. Generation of stem–loop mutants.
| (A) List of genes used to generate linear expression constructsa | |||||
|---|---|---|---|---|---|
| Gene | Source organism | DDBJ/EMBL/GenBank accession no. | Gene-specific forward primer | Gene-specific reverse primer | Molecular weight of protein (kDa) |
| 1049 | Human cytomegalovirus | M17209 | GCTAACACCGCG | GCGCCGGGTGCGCGA | 9.3 |
| Survivin | Human | NM001168 | GGTGCCCCGACG | ATCCATGGCAGCCAGC | 17.2 |
| CIITA | Human | U18259 | GAGTTGGGGCCC | AGAACCCCC | 44 |
| L30 r.p.b | Human | m94314 | AAGGTCGAGCTG | GCGTTTTCCACCAAC | 18 |
| S4X isoform r.p.b | Human | m58458 | GCTCGTGGTCCC | GCCCACTGCTCTGTTTGG | 30 |
| GFP | Aequorea victoria | U73901 | ACTAGCAAAGGA | AGAACCCCCCCC | 28 |
| Tubulin | Human | J00314 | AGGGAAATCGTG | ATGAGAACCCCC | 50 |
| (B) List of AT-rich combinations used to generate stem–loop mutants | |
| 1 Lys-Tyr-Thr-Tyr-Ser1 | 6 Lys-Thr-Tyr-Tyr-Ser2 |
| AAATATACATATTCT | AAAACATATTATTCA |
| 2 Lys-Thr-Tyr-Tyr-Ser1 | 7 Lys-Tyr-Ser2-Tyr-Thr |
| AAAACATATTATTCT | AAATATTCATATACA |
| 3 Lys-Tyr-Ser1-Tyr-Thr | 8 Lys-Tyr-Tyr-Ser2-Thr |
| AAATATTCTTATACA | AAATATTATTCAACA |
| 4 Lys-Tyr-Tyr-Ser1-Thr | 9 His-His-His-His-His |
| AAATATTATTCTACA | CATCATCATCATCAT |
| 5 Lys-Tyr-Thr-Tyr-Ser2 | |
| AAATATACATATTCA | |
| (C) General design used to construct primers for the first PCR that will lead to an RNA stem–loop-mutantc |
| Forward primer: AGGAGATATACCATG-(AT-rich combination)-(RNA stem–loop)-(gene-specific forward primer) |
| Reverse primer: ATTCGCCTTTTATTATTA-(His6 tag)-(gene-specific reverse primer) |
| (D) Various stem–loop sequences that were inserted to the 3′ side of the AT-rich combinationd | |
| RNA stem–loop |
Sequence |
| Stem length 9 bp | CAGACAAATAGATATTTGTCTGTA |
| Stem length 8 bp | CGTGCACGTGCATCGTGCACG |
| Stem length 7 bp | CTGCACGTGATCGTGCAG |
| Stem length 6 bp | CGCACGTGCATCGTGCGA |
| Stem length 5 bp | CGCCGTGCATCGGCG |
| Stem length 4 bp | GCCGTGATCGGC |
| Stem length 3 bp | GCGTGCATCGCA |
| Stem length 2 bp | CGTGCATCG |
aPrimer pairs listed in the table are the gene-specific sequences that hybridize to the template during the first PCR amplification.
br.p., ribosomal protein.
cThe overlap region for the second PCR is underlined in each primer. The AT-rich combination (chosen from Table 1B) was placed after the start methionine, followed by the RNA stem–loop and the gene-specific forward primer (chosen from Table 1A). The wild-type gene was amplified by forward primers (from Table 1A) that did not contain either the AT-rich combination or the RNA stem–loop sequence.
dHybridizing regions are shown in bold.
PCRs were performed in a volume of 50 µl in an Eppendorf thermocycler (master cycler gradient, Eppendorf, Germany) using standard protocols. A portion (2 µl) of the product from the first PCR was used as template for the second PCR. Primer C (GAAATTAATACGACTCACTATAGGGAGACCACA ACGGTTTCCCTCTAGAAATAATTTTGTTTAACTTTA AGAAGGAGATATACC) and primer D (CAAAAAACCCC TCAAGACCCGTTTAGAGGCCCCAAGGGGTTGGGAG TAGAATGTTAAGGATTAGTTTATTA) were used for the second PCR.
The DNA content of the second PCR product was estimated using the Lumi-Imager System (Roche, Basel, Switzerland) and 100 ng of the product was used for in vitro expression.
Cloned linear templates were amplified by one-step PCR, using the T7 promoter primer (GAAATTAATACGACTCA CTATAGGGAGACCACAACGGTTTC) and the T7 terminator primer (CAAAAAACCCCTCAAGACCCGTTTAGA GGCCCCAAGG) as PCR primers. The annealing temperature during the amplification was 60°C.
Cloning of linear templates
The linear expression constructs were cloned into pBAD Topo vectors (Invitrogen, Karlsruhe, Germany) according to the manufacturer’s protocol (pBAD TOPO TA, Expression Kit, Version L). Recombinant plasmids were amplified by one-step PCR to generate templates for ‘run-off’ transcription (27) and for in vivo protein synthesis.
In vitro protein synthesis
For bacterial protein synthesis, the Rapid Translation System RTS 100 E.coli HY Kit (Roche) was used according to the manufacturer’s protocol. Each reaction (50 µl final volume) contained 12 µl amino acids, 1.25 µl methionine, 10 µl reaction mix, 4.75 µl reconstitution buffer, 12 µl E.coli lysate, 100 ng linear template DNA and 2 µg purified mRNA template. The reaction was incubated for 2 h at 30°C without stirring. Afterwards samples (0.1–1 µl) of the reaction were analyzed by SDS–PAGE (28).
In vivo protein synthesis
The orientation of inserts in the pBAD plasmids was verified by PCR. Plasmids with the same orientation were transformed into BL21 pLysS (Stratagene, Amsterdam, The Netherlands). For in vivo protein synthesis, colonies were isolated and grown in 4 ml cultures at 37°C and 200 r.p.m. for 5 h. When cell densities reached ∼108 cells/ml, T7 transcription was induced with 1 mM ispropyl-β-d-thiogalactopyranoside (IPTG) and the cells were incubated for an additional 2 h. Samples (108 cells) were removed from the culture and centrifuged (3 min at 14000 r.p.m. on a table-top centrifuge). Pelleted cells were resuspended in 10 µl SDS sample buffer and analyzed by SDS–PAGE and western blot.
SDS–PAGE/western transfer
Electrophoresis and western transfer were performed in the Novex Pre cast gel system (Invitrogen) according to the manufacturer’s protocol. Samples from expression reactions were denatured for 10 min at 70°C and separated on 4–12% Tris–glycine polyacrylamide gels (Invitrogen). The Multi-Tag-Marker (Roche) was used as molecular weight marker. After electrophoresis the proteins were transferred to PVDF membrane (Roche) by electroblotting, according to the manufacturer’s protocol.
His-tagged proteins on the membrane were detected with a 1:4000 dilution of Anti-His6-POD-MAK (Roche). Antibody was incubated with the membrane in TBST buffer [TBS (50 mM Tris, 150 mM NaCl pH 7.5) containing 1 ml/l Tween 20 (Roche)].
Alternatively the His tag was detected with NiNTA-AP-Conjugate (1:1000 dilution in TBST) (Qiagen, Hilden, Germany) followed by visualization with CDP-star reagent (Roche). The chemiluminescent signals were monitored with the Lumi-Imager System (Roche).
TBE–PAGE
Ribonucleic acids were electrophoretically separated on denaturing polyacrylamide gels, which contained 6% or 15% polyacrylamide, TBE and urea (7 M) (Invitrogen). Before electrophoresis, samples were denatured in TBE–urea sample buffer (2×) (Invitrogen) at 70°C for 5 min.
After electrophoresis the fragment bands were stained with SYBR Green II (Sigma, Munich, Germany) (10 000× in DMSO). The mRNA bands were analyzed by densitometry using the Lumi-Imager system (Roche). The molecular weight marker contained a combination of RNA molecular weight marker III (Roche) (50 ng/lane) and a mixture of different oligonucleotides (75 ng/lane). (The sizes of the markers are given in the figures.)
Run-off transcription of mRNA
Linear templates were produced from isolated plasmids in a one-step PCR using the T7 promoter and T7 terminator primer. The SP6/T7 Transcription Kit (Roche) was used to make run-off transcripts of purified mRNA from these templates. Each transcription reaction contained 0.1–.5 µg PCR product, the T7 RNA Polymerase (20 U) and dNTP (1.5 mM each). The reaction was incubated for 1 h at 37°C. DNase I (20 U) was then added and the reaction was incubated for an additional 15 min at 37°C. The resulting mRNA was purified by phenol extraction and ethanol precipitation (29). The concentration and purity of the mRNA was measured by the optical density at 280 and 260 nm.
RNA structure analysis with RNase H
The structure of the mRNA was analyzed by oligonucleotide-mediated cleavage with RNase H (30–32). In the RNase cleavage reaction, each of four oligonucleotides [Fig. 1E, (a)–(d)] was used at three different concentrations (75, 7.5 and 0.75 µM). Oligonucleotides (e) and (f) (Fig. 1E) were each used at only one concentration (36 µM). For titration of the ribosome binding site, an oligonucleotide (TCTCCT) complementary to the site was used.
Reactions were performed in a reaction volume of 10 µl containing 50 ng/µl mRNA. First the mRNA samples were denatured at 70°C for 2 min in incubation buffer (25 mM Tris–HCl pH 7.5, 200 mM NaCl, 10 mM MgCl2 × 6H2O). Then the samples were cooled to 30°C and the mRNA was allowed to refold for 30 min (32). Next, oligonucleotides were added to each sample. To allow hybridization the samples were incubated for 10 min at 30°C. RNase H (1 U) was then added to each sample and digestion was performed for an additional 30 min at 30°C. To stop the reaction, one volume TBE–urea sample buffer (2×) (Invitrogen, Karlsruhe, Germany) was added. Portions of each digest (50–350 ng mRNA) were analyzed by denaturing TBE–PAGE.
RNA stability assay
The RTS 100 HY in vitro expression system was used for the stability assay. Samples containing 1 µg mRNA were mixed on ice with one of four dilutions of E.coli lysate (1×, 0.5×, 0.25×, 0.125×). After lysate was added, the samples were mixed carefully and incubated at 30°C for 20 min. After the incubation, two volumes of lysis/binding buffer from the High Pure RNA Isolation Kit (Roche) were added to each sample to inactivate RNases. The mRNA remaining in each sample was then isolated with the High Pure Kit.
After isolation the samples were analyzed on polyacrylamide (6%)–TBE–urea or agarose gels. The mRNA amounts were analyzed by densitometry.
Theoretical RNA structure analysis
For theoretical RNA structure analysis, mfold software (33) was used. The messengers were folded at 30°C, and dot plot analysis was used to identify all pairings (j) of regulatory sequences (SD; AUG) with downstream sequences. For analysis of long-range interactions, only pairings between regulatory sequences and downstream gene-specific mRNA sequences were considered.
According to the theory behind the software, if n is the number of structures examined, j is a downstream pairing between a regulatory element and a downstream gene-specific sequence, i is any structure in which pairing j occurs and ΔGi is the free energy of structure i, which determines the frequency of occurrence of structure i, the probability pGji that the regulatory mRNA will form secondary RNA structures with downstream gene-specific sequences can be calculated as
where the numerator of the equation represents the probability that all downstream pairings of type j will occur, and the denominator represents the probability that all hypothetically possible downstream pairings between the regulatory elements and any downstream sequence will occur.
The probability pGji for downstream pairing of the wild-type sequence was compared with that of the stem–loop mutant. The reduced downstream affinity (potential to release pr, i.e. potential to decrease pairing of a given RNA sequence with downstream gene-specific sequences) of the introduced stem–loop was then calculated and expressed as a percentage:
pr = 100% × [1 – pGji (mutant)/pGji (WT)] 2
The probability (pRST) that an RNA stem–loop will form was calculated from the theoretical data (equation 1) by considering only structures in which the RNA stem–loop actually occurred (index RST):
RESULTS
In vitro expression experiments to define the translational leader sequence
In the initial set of experiments we studied the influence of the stem length and the location of the RNA stem–loop on translation. We used different constructs of a gene (GFP) which is usually highly expressed. Various stem–loops were introduced by using different forward primers in the first PCR (Table 2). The stem–loops were placed directly after the 3′ end of the start AUG and some of them significantly influenced expression rates (Fig. 2A).
Table 2. List of forward primers for the first PCR used to generate linear expression constructs of GFPa.
| (A) Forward primers that generate RNA stem–loops of increasing stem length to the 3′ side of the start AUG | |
|---|---|
| Forward primer | Sequence |
| Without stem–loop (0 bp) | AGGAGATATACCATGACTAGCAAAGGAGAA |
| Stem length 4 bp | AGGAGATATACCATGACTAATTTTAGTACTAGCAAAGGAGAA |
| Stem length 5 bp | AGGAGATATACCATGACTGTTTATACAGTAACTAGCAAAGGAGAA |
| Stem length 6 bp | AGGAGATATACCATGACTGGTCAATTACCAGTAACTAGCAAAGGAGAA |
| Stem length 7 bp | AGGAGATATACCATGACTGCTTTACATCAAGCAGTAACTAGCAAAGGAGAA |
| Stem length 8 bp |
AGGAGATATACCATGACTGCACGTGATCGTGCAGTAACTAGCAAAGGAGAA |
| (B) Different locations chosen for insertion of the 8 bp stem–loop | |
| Forward primer |
Sequenceb |
| GFP +10 nt | AGGAGATATACCATGACTAGCACT…GTAAAAGGAGAAGAACTT |
| GFP +13 nt | AGGAGATATACCATGACTAGCAAAACT…GTAGGAGAAGAACTTTTC |
| GFP +16 nt | AGGAGATATACCATGACTAGCAAAGGAACT…GTAGAAGAACTTTTCACT |
| GFP +19 nt | AGGAGATATACCATGACTAGCAAAGGAGAAACT…GTAGAACTTTTCACTGGA |
| GFP +22 nt | AGGAGATATACCATGACTAGCAAAGGAGAAGAAACT…GTACTTTTCACTGGAGTT |
aThe start AUG is bold, stem–loop sequences are inverted and the overlap region for the second PCR is underlined. The reverse primer is the same as that listed for GFP in Table 1C.
bACT…GTA, 8 bp stem–loop (ACTGCACGTGATCGTGCAGTA).
Figure 2.

Expression results of various stem–loop mutants. (A) Expression results of constructs that contain different stem–loops inserted after the 3′ end of the start AUG. The position of the stem–loops and their free energies are shown. One microliter was taken from each of two independent expression reactions involving each construct. These samples were run on 10% acrylamide–Bis/Tris–SDS gels and then examined by western blot analysis. The His-tagged proteins on the blot were detected with NiNTA-AP conjugate and CDP-star; CDP-star luminescence was measured with the Lumi-Imager. The amounts of luminescence due to His-tagged GFP in each sample are shown in the graph. These amounts were verified by measurement of the GFP fluorescence in each sample. (B) Expression results from constructs containing the inhibitory 8 bp stem–loop inserted at different positions in the gene sequence. The diagram shows the various insertion positions of the inhibitory 8 bp stem–loop in the constructs. The graph shows luminescence data representing the relative expression of each construct.
Inserts with a stem length of 5 bp or less did not significantly affect the expression rates (∼100 µg/ml), but stem lengths from 6 to 8 bp (ΔG0 values of –7.8 to –11.8 kcal/mol) reduced expression significantly (Fig. 2A). Hence, a stem–loop structure with a stem length of at least 6 bp and a free energy of –7.8 kcal/mol reduces expression significantly by blocking ribosomal initiation.
In the subsequent expression experiments (Fig. 2B) we used GFP constructs with an inhibitory 8 bp stem–loop. The 8 bp element was inserted at different positions downstream from the start codon (Table 2B). This allowed us to investigate the optimal placement of an 8 bp stem–loop (Fig. 2B).
At insertion position +13 the inhibitory effect started to vanish (Fig. 2B); at position +16 expression was no longer affected. This observation is in good agreement with data on the structure of the ribosome, since the space required by the messenger in the downstream tunnel of the ribosome ranges from +11 to +15 nt (6–8).
Based on these initial experiments we designed a translational leader sequence to enhance expression (Fig. 1). This sequence contained 5 AU-rich codons (positions +4 to +18 nt) followed by a GC-rich sequence that coded for an RNA stem–loop (7 bp, ΔG0 = –9.9 kcal/mol, positions +19 to +36 nt) (Table 1).
In vitro transcription/translation of linear expression constructs
To investigate the influence of the artificial translational leader sequence on gene expression we compared its effect on the expression of seven different genes from different organisms (Table 1A). The coding sequences of these genes were between 246 and 1380 nt long. As described in Materials and Methods, the translational leader sequence was introduced by two-step PCR, using the 7 bp stem–loop (Table 1D) in the forward primer of the first PCR (Table 1C) to generate linear expression constructs.
Insertion of the RNA stem–loop significantly increased expression of wild-type genes that were initially not expressed or only slightly expressed (Fig. 3A, B, C, D and E). Additionally, the stem–loop insert significantly increased the expression of genes that already had good expression rates (Fig. 3F and G). When inserted along with the stem–loop, AT-rich combinations 1–8 (Fig. 3, lanes 1–8) produced high expression rates, but combination 9 (Fig. 3, lane 9) produced very little expression. The AT-rich region in this combination (Table 1B, sequence 9, and Fig. 3, lane 9) is the His5 tag sequence, which seems to be less suitable for expression initiation.
Figure 3.

In vitro expression results from linear constructs of wild-type and RNA stem–loop mutants. (A–E) Western blot analysis of in vitro expression of five different wild-type genes and their corresponding stem–loop mutants. In each blot, lane 10 shows that the wild-type genes were not expressed. Lanes 1–9 show the expression of constructs containing identical RNA stem–loop sequences and an AT-rich region. The amino acids of the AT-rich region were varied as described in Materials and Methods (Table 1B). Lanes 1–9 in the figure correspond to constructs 1–9 in Table 1B. (F and G) Western blot analysis of two expressible wild-type genes and their corresponding RNA stem–loop mutants. The samples on these gels were loaded in the same order as those on gels (A)–(E).
Because the amount of synthesized protein depends on the expression system and the type of template (linear DNA or plasmid), in an additional western blot (data not shown) we estimated their expression relative to the GFP wild-type construct (Table 3).
Table 3. Amounts of protein synthesized in vitro.
| Gene | Relative expression (n × GFP WT) |
|---|---|
| CIITA 1 | 1.4 |
| Survivin 1 | 2.3 |
| 1049 8 | 1.5 |
| GFP WT | 1.0 |
| GFP 6 | 3.7 |
For quantification of synthesis, the chemiluminescence signal was measured after immunochemical detection of His-tagged protein. Protein amounts were estimated relative to wild-type GFP. The mutant numbers indicate which AT-rich sequences (listed in Table 1B) were inserted to the 5′ side of the 7 bp stem–loop.
According to attenuation mechanisms (34–36), tRNA starvation could have caused the lower expression. Alternatively, the higher GC content, which increased the tendency to form secondary RNA structures, might lead to the decrease in expression efficiency (21,22).
However, codon bias could be excluded as the cause of the improved expression because supplementing the reaction with tRNAs that provide rare codons in E.coli did not lead to in vitro expression of the wild-type genes (data not shown).
In a subsequent set of experiments, an N-terminal HA tag was used as the AT-rich region. It was less suited for initiating expression, but it allowed detection of the N-terminus of the translation product. Thus potential fragmentation during the translation could be detected. HA-tagged constructs of the S4X ribosomal protein (also shown in Fig. 3D), which had coding sequences of increasing length, showed in vitro expression without fragmentation (data not shown).
In order to investigate whether the RNA stem–loop acts on translation, purified mRNA was used as a template for in vitro translation. The experimental conditions for the translation were comparable with the coupled transcription/translation reactions (described in Materials and Methods). Variants of CIITA, Survivin and 1049 mRNAs, along with the corresponding wild-type genes, were translated. Expression results were similar to those obtained in the coupled in vitro transcription/translation. The RNA stem–loop mutants showed significant expression, while the wild-type mRNAs of all three genes were not detectably translated (data not shown).
In vitro transcription/translation using different leader sequences
To investigate whether the stem–loop or the AT-rich sequence was responsible for improved expression, linear expression constructs containing only one element (AT-rich sequence) were generated (Table 1B, sequences 1 and 2). The results of the in vitro expression are shown in Figure 4A. While the wild-type genes of CIITA, Survivin and 1049 showed no expression (Fig. 4A, lanes 1, 6 and 11), the constructs containing the RNA stem–loop sequence (Fig. 4A, lanes 2, 3, 7, 8, 12 and 13) were expressed in high yields. The constructs containing the AT-rich region but no RNA stem–loop sequence (Fig. 4A, lanes 4, 5, 9, 10, 14 and 15) showed little or no expression. Thus the RNA stem–loop is absolutely necessary for successful expression of non-expressible wild-type genes.
Figure 4.

In vitro expression results using different leader sequences. (A) Expression results obtained from linear templates with and without an RNA stem–loop. Lanes 1–5 show expression results from different CIITA constructs. Lanes 6–10 show results from Survivin constructs. Lanes 11–15 show results from 1049 constructs. Lanes 1, 6 and 11 show wild-type expression. Lanes 2, 3, 7, 8, 12 and 13 show expression of constructs containing AT-rich combinations (Table 1B, sequences 1 and 2) and the introduced RNA stem–loop. Lanes 4, 5, 9, 10 14 and 15 show expression of constructs containing the same AT-rich combinations (Table 1B, sequences 1 and 2) but no RNA stem–loop sequence. (B–E) Expression results obtained from linear templates with different stem lengths inserted on the 3′ side of the AT-rich combination. The stem length and the wild-type constructs are indicated above the lanes. Similar amounts of (B) 1049 (C) CIITA and (D) Survivin were analyzed by western blot and quantified with the Lumi-Imager. Each expression result in (B) and (C) was expressed as a fraction of the result from the most active sample (the sample containing the 7 bp stem–loop) and plotted in (E).
To investigate how stem–loop characteristics affected improved translation we varied the length of the stem–loop inserted at position +19 (Table 1D). We tested different stem lengths between 2 and 8 bp (Fig. 4B, C, D and E). In the presence of the rather unstable 2 bp stem–loop, 1049 was highly expressed while CIITA was less effectively expressed. Stem lengths ≤5 bp decreased expression of all genes. Stem lengths >6 bp increased expression of all genes; maximum expression was obtained with a 7 bp stem. The results demonstrate that a 7 bp stem–loop improved expression in all cases, while the effects of shorter or longer stem lengths depended on the structural gene.
Formation of the introduced RNA stem–loop
Next we investigated formation of the RNA stem–loop structure in the mutated mRNA. We used complementary oligonucleotides (Fig. 1E) to target the stem sequence rather than sequences to either side of the stem–loop. Hybridization of these oligonucleotides was detected by RNase H cleavage. Single-stranded RNA is accessible to hybridization and allows cleavage, while double-stranded RNA stretches are not accessible and therefore remain uncleaved by RNase H (30–32). Additionally, hybridization of increasing amounts of oligonucleotides competes against native RNA structure at the targeted site and demonstrates the accessibility, and hence stability, of the secondary RNA structure (32,37).
As indicated in Figure 5A, three different oligonucleotide concentrations were used for cleavage reactions. Oligonucleotide (a) mediated cleavage (fragment size, 62 nt); oligonucleotide (b) also resulted in cleavage (fragment size, 98 nt). Different concentrations of oligonucleotides led to comparable amounts of fragments. This indicated that the sites before and after the stem–loop were easily accessible to oligonucleotide hybridization. In contrast, oligonucleotides (c) and (d) could not hybridize to mediate cleavage at any concentration investigated (Fig. 5A). Only secondary cleavage products in the lower part of the gel were detected.
Figure 5.

Experimental (RNase H) and theoretical (mfold) analysis of RNA stem–loop formation. (A) TBE–urea gel containing RNase H cleavage products generated in the presence of oligonucleotides that are complementary to parts of the RNA stem–loop. Each sample on the gel contains denatured products from a single cleavage reaction (10 µl volume, containing 250 ng mRNA). Each lane is labeled with the name and concentration of the oligonucleotides used to generate the cleavage pattern. Names of the oligonucleotides correspond to those described in Figure 1E. Oligonucleotide (a) mediated cleavage to the 5′ side of the RNA stem–loop, while oligonucleotide (b) mediated cleavage to the 3′ side of the RNA stem–loop. No cleavage of the targeted RNA stem–loop was observed in the presence of oligonucleotides (c), (d), (e) and (f). Lane 0, cleavage reaction produced in the absence of oligonucleotide. (B) Results of theoretical mfold analysis of stem–loop formation in different genes. pRST, probability of RNA stem–loop formation.
Because the length of oligonucleotides has previously been shown to influence hybridization (38), oligonucleotides (e) and (f), containing sequences complementary to both stem– and hairpin–loop [Fig. 1E, sequences (e) and (f)] were tested in the RNase H cleavage reaction. Performing this reaction in the presence of 36 µM oligonucleotide (e) or (f) generated no cleavage products. Thus the RNA stem–loop is formed.
In addition, theoretical structure analysis was performed to determine the probability of RNA stem–loop formation in different genes (Fig. 5B). This analysis showed significant formation of the 7 bp stem–loop. Only for Survivin mRNA did theoretical values indicate high affinity of the gene sequence for the GC-rich sequence of the stem–loop.
Structural changes of regulatory elements on the mRNA by introduction of the RNA stem–loop
To test secondary RNA structure formation in translational regulatory elements we analyzed the accessibility of the ribosome binding site by oligonucleotide titration and subsequent RNase H digestion (Fig. 6). The results obtained with mutant and wild-type mRNAs were compared (32).
Figure 6.

Determination of structural accessibility of the ribosome binding site. TBE–urea gels showing RNase H cleavage products obtained after the ribosome binding site was exposed to increasing concentrations of a complementary oligonucleotide. The same oligonucleotide was used in all mRNA titrations. Each lane was loaded with 5 µl from a single cleavage reaction (representing 125 ng mRNA). The bar graph above each gel shows the cleavage in each sample, expressed as a percentage of the maximum cleavage observed. (A) Titration of 1049 mRNA; lanes 1–5 contained the RNA stem–loop mutant, while lanes 6–10 contained the wild type. As indicated on the gel, both mRNAs were exposed to increasing amounts of oligonucleotide (0–1500 ng/reaction). (B) Titration of Survivin mRNA and (C) titration of CIITA mRNA; lanes 1–5 contained the RNA stem–loop mutant, while lanes 6–10 contained wild type. As indicated, mRNAs were exposed to increasing amounts of oligonucleotide (0–2500 ng/reaction).
For all genes investigated, comparable oligonucleotide concentrations produced more cleavage products with wild-type mRNAs than with RNA stem–loop mutants. According to principles of antisense technology the kinetics and thermodynamics of oligonucleotide hybridization are profoundly attenuated when hybridization has to overcome energy barriers caused by secondary RNA structure (37,39). Hence lower hybridization reflects more stable secondary RNA structures (32). Thus the ribosome binding sites of the wild-type mRNAs were stabilized by the introduction of the RNA stem–loop.
Theoretical RNA structure analysis
To predict pairings of the translation initiation site with downstream gene-specific mRNA sequences, we calculated theoretical RNA structures from the primary sequences. The probabilities of downstream pairings between the ribosome binding site and the start methionine were calculated (Fig. 7A). The reduction of downstream affinity after stem–loop insertion is also indicated (Fig. 7B).
Figure 7.

Downstream affinity of the translation initiation domain. (A) Probability pGji that the ribosome binding site (RBS) and the start AUG will pair with downstream sequences. Results are shown for wild-type mRNAs (WT) and stem–loop mutants (numbered) of the genes 1049, Survivin and CIITA. The numbers of the mutants correspond to the amino acid sequences shown in Table 1B. (B) Reduction in downstream affinity pr of the mutant regulatory sequences compared with the wild type. The higher the pr value, the less likely it is that the regulatory sequence will pair with downstream sequences.
In summary, the data predict that stem–loop introduction decreases downstream pairings of the two regulatory elements (SD, start methionine) in all mRNAs.
The ribosome binding site of the GFP RNA stem–loop mutants showed lower downstream affinity (49.8 to 52.8%), and pairings of the start methionine with sequences downstream were also decreased (73.0 to 77.7%). RNA stem–loop mutants of gene 1049 showed the most significant changes in downstream affinity for both the ribosome binding site (64.8 to 92.4%) and the start AUG (69.2 to 93.4%). For Survivin, introduction of the stem–loop led to less marked release from downstream pairings for both regulatory elements, 35.1% for the SD and 49.1% for the start AUG. Only CIITA showed more downstream pairings of the start methionine in the RNA stem–loop mutant than in the wild type. However, stem–loop introduction still released the ribosome binding site (52.1%) of CIITA from downstream secondary RNA structures.
The AUG of CIITA showed more affinity for downstream sequences (increased affinity, pr = –48.8%) because it was possible for nucleotides –2 to +3 to pair with nucleotides +213 to +217 in a 5 bp helix [(a) ΔG0 = –8.10 kcal/mol]; this could be followed by formation of an interior loop (ΔG0 = 2.20 kcal/mol) and a 5 bp helix involving nucleotides +7 to +11 and +207 to +211 [(b) ΔG0 = –5.20 kcal/mol]. Because this structure occurs with great frequency, the probability for downstream pairings of the AUG increased after stem–loop introduction. The free energy of helix (a) from the paired AUG was compensated by the free energy of the interior loop. Hence the AUG was not bound strongly enough to inhibit translation (20). In addition, downstream pairings of the interior loop and helix (b) are formed in the presence of the introduced AU-rich sequence; in agreement with data from the literature (21,22), the AU-rich sequence enhanced translation initiation.
mRNA stability
Because differences in mRNA stability could have led to improved translation results (40), we compared the stability of mRNA from the mutant version of gene 1049 with that of mRNAs from wild-type 1049 in an in vitro expression system. After the stability tests the amounts of mRNA remaining were determined by gel electrophoresis and densitometry.
For each variant, the stability of mutant and wild-type mRNAs was comparable at different lysate concentrations. At lower lysate concentrations (Fig. 8B, 0.125× and 0.25×) the mRNA of the stem–loop mutant might be slightly more stable. However, at lysate concentrations that mimicked expression conditions (Fig. 8B, 1×) wild-type mRNA was more stable than the stem–loop mutant.
Figure 8.

mRNA amounts remaining after 20 min incubation with different concentrations of E.coli lysate. (A) TBE–urea gels show the mRNA remaining in wild-type and RNA stem–loop mutants after 20 min digestion. (B) The amounts of mRNA detected after digestion for 20 min, as determined by densitometric analysis of the gel. The error bars show the standard deviations obtained for duplicate samples.
In vivo protein synthesis of the RNA stem–loop constructs
We also tested expression of RNA stem–loop constructs in whole cells. pBAD vectors containing linear templates in the same orientation were transformed into E.coli BL21 pLysS and expressed as described in Materials and Methods. Western analysis of the His-tagged proteins showed that three independent clones of 1049 containing the RNA stem–loop construct (Fig. 9, lanes 1–3) were highly expressed, while three independent clones containing the wild-type 1049 (Fig. 9, lanes 4–6) were poorly expressed. Three independent clones of Survivin containing the RNA stem–loop construct (Fig. 9, lanes 7–9) were highly expressed, while two wild-type clones (Fig. 9, lanes 10 and 11) were not expressed.
Figure 9.
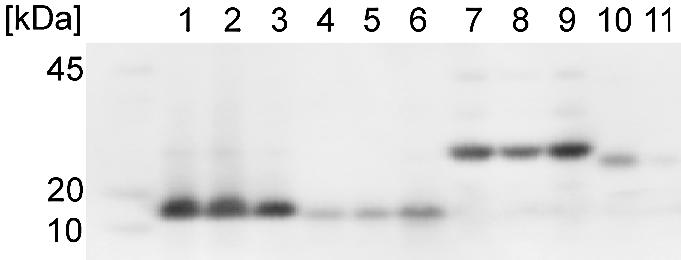
Comparison of in vivo expression of RNA stem–loop constructs and wild-type genes. Western blot analysis of protein synthesis from three independent clones of RNA stem–loop mutant 1049 1 (lanes 1–3); wild-type 1049 (lanes 4–6), three independent clones of a Survivin RNA stem–loop mutant (lanes 7–9) and two independent clones of wild-type Survivin (lanes 10 and 11). Similar amounts of protein were analyzed in each sample.
DISCUSSION
Introducing an engineered stem–loop sequence into the gene led to good in vitro expression of previously non-expressible genes. This strategy was effective for several genes, which were obtained from different organisms and varied in length from 246 to 1380 nt. The inserted stem–loops also enhanced expression of these genes in vivo. Thus insertion of stem–loop sequences appears to be a generally applicable strategy for enhancing heterologous gene expression.
Whether transcription and translation of mRNA were performed separately or in a coupled system, the results were similar: no expression of wild-type mRNAs and good expression of RNA stem–loop mutants. Hence the introduced sequence acts at the RNA level, and no other parts of the pathway from DNA to mRNA are affected. It is possible, however that RNA stem–loop introduction might affect steps after mRNA production, for example by influencing translation initiation or mRNA stability.
In addition, the translation results confirm that the in vitro expression experiments are a valuable method for investigating the effects of RNA structures on RNA–protein interactions (10,16,20,41).
Constructs that contain only the AT-rich combination have very low expression. This indicates that the RNA stem–loop is important for sufficient expression of non-expressible genes. Furthermore, expression experiments on constructs containing different stem–loop sequences showed that expression depends on mRNA structure.
Translational pausing is involved in the attenuation mechanism and is caused by stable RNA secondary structures. It affects transcription and translation efficiency (34–36). However, translational pausing and attenuation mechanisms can be excluded as causes of improved protein synthesis for two reasons.
First, the 7 bp stem–loop is positioned at +19 to +36, while the initiating ribosome spans positions –15 to +15 (6,8). During elongation the movement of the ribosome disrupts base pairings of nucleotides +19 to +25 in the RNA stem–loop. After it opens the stem, that ribosome can no longer be affected by the stem–loop. Also, while one ribosome holds the stem open, there is not enough space on the mRNA for initiation by another ribosome.
Second, T7 RNA polymerase is used in the coupled in vitro expression system. Because the T7 RNA polymerase elongates the RNA chain rapidly, transcription is independent of translation (42) and RNA structures are formed before ribosomal initiation.
Our experiments on the stability of the RNA structure of the ribosome binding site (RBS) indicated that it was stabilized after stem–loop introduction in all three genes investigated. RNA folding analysis with mfold software (33) concentrated on detecting downstream pairings of the RBS and/or the start methionine. Stem–loop introduction reduced the affinity of the regulatory elements for downstream gene-specific mRNA sequences. Compared with the wild-type genes, the RNA stem–loop mutants reduced downstream affinity of the ribosome binding site by 35.1 to 92.4% (49.1 to 93.4% for the start methionine). Hence, stem–loop insertion inhibited the formation of alternative structures between the RBS and downstream gene-specific mRNA sequences. Therefore changing the structure of the ribosome binding site resulted in more defined structures within the sequences of the 5′ UTR. This conclusion is consistent with the hierarchical pathway of RNA structure formation, in which short hairpin structures are more stable and are formed first, before structures involving long-range interactions (43–46). Hence the same oligonucleotide used for structural titration (targeted to the RBS) hybridizes more efficiently to its target if the target is involved in several alternative long-range interactions rather than ‘one’ hairpin structure. Together with the improved expression observed in the stem–loop mutants, these observations support the conclusion that stem–loop introduction led to formation of a structurally isolated initiation domain, consisting primarily of short local hairpins with ΔG0 < –6 kcal/mol (10,15,20). During translation initiation such structures can easily be opened by the ribosomes.
Stability of the mRNA plays a fundamental role in regulating protein amounts in the cells (47–49). The stability of the messenger controls the number of translation starts that occur during the lifetime of the mRNA. Degradation of mRNA is not a random process of endonucleolytic cleavage (50,51), but is mediated by a combination of RNA helicases and endo- and exoribonucleases (47), which are combined in the E.coli degradasome. The rate-limiting step of degradation is endonucleolytic cleavage at the 5′ end, followed by directional cleavage from the 3′ to the 5′ end (47,48). Thus 5′ and 3′ RNA secondary structures in the untranslated region act as stabilizers against degradation and extend the lifetime of a messenger (40,52,53).
We did not measure mRNA decay precisely, but experiments on the stability of the mRNA in the in vitro expression system demonstrate that introduction of the RNA stem–loop did not stabilize the wild-type messenger. These observations are in agreement with data indicating that occurrence of at least five unpaired nucleotides upstream from stable secondary RNA structures at the 5′ end of the messenger reverse the stabilizing effect of these secondary structures (52,54–56). Additionally, significant amounts (33%) of the wild-type mRNA remained in the undiluted lysate after 20 min. Other experiments showed that after 20 min most of the protein in the coupled in vitro system is already synthesized (data not shown). Thus, if ribosomes initiated synthesis from the wild-type messenger, protein would have been detected after 20 min.
Table 4 summarizes expression results obtained by insertion of various stem–loops and theoretical analysis of the RNA structure. In some genes a rather unstable 2 bp stem–loop was sufficient to initiate expression (Table 4, 2 bp element). Although the constructs containing the AU-rich combination without a stem–loop allowed low expression of 1049, this combination did not allow expression of the other genes investigated (Table 4, AT+/RST–). Theoretical analysis of the RNA structures explained these results. The decrease in the value of predicted RNA stem–loop formation (Table 4, pRST) correlates with the expression results. The Survivin mRNA shows high affinity for the GC-rich stem–loop sequence, indicating a general tendency to form secondary RNA structures. The relatively greater effect of the 2 bp element on CIITA expression agrees with the theoretical prediction that stem–loop insertion increases stem–loop formation in CIITA more than in Survivin, but decreases the downstream affinity of the regulatory elements by about the same amount in both genes. Finally, gene 1049 shows the most significant enhancement of expression by the 2 bp stem–loop, as well as producing the highest values in the theoretical analysis. Taken together, the results indicate that the degree to which the mRNA structure enables successful expression depends on the gene involved.
Table 4. Comparison of experimental results with theoretical RNA structure analysis.
| Gene | Expression (2 bp element) | Expression (AT+/RST–) | pRST | pr (RBS) (%) | pr (AUG) (%) |
|---|---|---|---|---|---|
| 1049 | 0.97 | Low | 1 | 64.8–92.4 | 69.2–93.4 |
| CIITA | 0.48 | No | 1 | 52.1 | –48.8 |
| Survivin | 0 | No | 0.62 | 35.1 | 49.1 |
Each value for the 2 bp stem–loop element is expressed as a fraction of the value obtained with the 7 bp element (as shown in Fig. 4B–E). AT+/RST– refers to expression of constructs containing the AT-rich codon combination but no RNA stem–loop.
In summary, the experiments demonstrate the importance of the RNA stem–loop for mediating translation initiation. Once introduced, the RNA stem–loop forms and stabilizes the ribosome binding site in a translatable RNA structure. Long-range interactions of the regulatory sequences are critically important, and the introduced RNA stem–loop acts as a barrier against hybridization of regulatory elements to downstream gene-specific mRNA sequences. Thus introduction of a stem–loop enhances formation of a distinct bacterial translation initiation domain.
Furthermore, the formation of a stable local hairpin structure of ∼7 bp (ΔG = –9.9 kcal/mol), 15 nt downstream from the start methionine, enhances heterologous gene expression. For maximum effect, these 15 intervening nucleotides should be AU rich.
Although the RNA stem–loop structure is a valuable tool for enhancing expression yield, the cost of that enhanced expression is additional sequences in the final gene product. In some cases this might impair the function of the protein. To overcome this problem, conservative codon replacement might be used to generate the stem–loop structure in the leader sequence. Alternatively, post-translational chemical or enzymatic processing might be used to remove the additional sequences.
Acknowledgments
ACKNOWLEDGEMENTS
We thank Marcus Schmidt, Anette Seidl, Claudia Kirr, Thomas Nikolaus and Björn Voss for experimental support. This work was supported by Roche Diagnostics Germany.
REFERENCES
- 1.Buchanan M.V., Larimer,F.W., Wiley,H.S., Kennel,S.J., Squier,T.J., Ramsey,J.M., Rodland,K.D., Hurst,G.B., Smith,R.D., Xu,Y. et al. (2002) Genomes to Life ‘Center for Molecular and Cellular Systems’: a research program for identification and characterization of protein complexes. Omics, 6, 287–303. [DOI] [PubMed] [Google Scholar]
- 2.Swartz J.R. (2001) Advances in Escherichia coli production of therapeutic proteins. Curr. Opin. Biotechnol., 12, 195–201. [DOI] [PubMed] [Google Scholar]
- 3.Jonasson P., Liljeqvist,S., Nygren,P.A. and Stahl,S. (2002) Genetic design for facilitated production and recovery of recombinant proteins in Escherichia coli. Biotechnol. Appl. Biochem., 35, 91–105. [DOI] [PubMed] [Google Scholar]
- 4.Balbas P. (2001) Understanding the art of producing protein and nonprotein molecules in Escherichia coli. Mol. Biotechnol., 19, 251–267. [DOI] [PubMed] [Google Scholar]
- 5.Makrides S.C. (1996) Strategies for achieving high-level expression of genes in Escherichia coli. Microbiol. Rev., 60, 512–538. [DOI] [PMC free article] [PubMed] [Google Scholar]
- 6.Yusupova G.Z., Yusupov,M.M., Cate,J.H. and Noller,H.F. (2001) The path of messenger RNA through the ribosome. Cell, 106, 233–241. [DOI] [PubMed] [Google Scholar]
- 7.Ramakrishnan V. (2002) Ribosome structure and the mechanism of translation. Cell, 108, 557–572. [DOI] [PubMed] [Google Scholar]
- 8.Culver G.M. (2001) Meanderings of the mRNA through the ribosome. Structure, 9, 751–758. [DOI] [PubMed] [Google Scholar]
- 9.Hartz D., McPheeters,D.S. and Gold,L. (1991) Influence of mRNA determinants on translation initiation in Escherichia coli. J. Mol. Biol., 218, 83–97. [DOI] [PubMed] [Google Scholar]
- 10.Gold L. (1988) Posttranscriptional regulatory mechanisms in Escherichia coli. Annu. Rev. Biochem., 57, 199–233. [DOI] [PubMed] [Google Scholar]
- 11.Gualerzi C., Risuleo,G. and Pon,C.L. (1977) Initial rate kinetic analysis of the mechanism of initiation complex formation and the role of initiation factor IF-3. Biochemistry, 16, 1684–1689. [DOI] [PubMed] [Google Scholar]
- 12.Jacques N. and Dreyfus,M. (1990) Translation initiation in Escherichia coli: old and new questions. Mol. Microbiol., 4, 1063–1067. [DOI] [PubMed] [Google Scholar]
- 13.McCarthy J.E. and Brimacombe,R. (1994) Prokaryotic translation: the interactive pathway leading to initiation. Trends Genet., 10, 402–407. [DOI] [PubMed] [Google Scholar]
- 14.Tessier L.H., Sondermeyer,P., Faure,T., Dreyer,D., Benavente,A., Villeval,D., Courtney,M. and Lecocq,J.P. (1984) The influence of mRNA primary and secondary structure on human IFN-gamma gene expression in E.coli. Nucleic Acids Res., 12, 7663–7675. [DOI] [PMC free article] [PubMed] [Google Scholar]
- 15.deSmit M.H. and van Duin,J. (1994) Translational initiation on structured messengers. Another role for the Shine–Dalgarno interaction. J. Mol. Biol., 235, 173–184. [DOI] [PubMed] [Google Scholar]
- 16.vanMeerten D., Girard,G. and van Duin,J. (2001) Translational control by delayed RNA folding: identification of the kinetic trap. RNA, 7, 483–494. [DOI] [PMC free article] [PubMed] [Google Scholar]
- 17.Hui A. and de Boer,H.A. (1987) Specialized ribosome system: preferential translation of a single mRNA species by a subpopulation of mutated ribosomes in Escherichia coli. Proc. Natl Acad. Sci. USA, 84, 4762–4766. [DOI] [PMC free article] [PubMed] [Google Scholar]
- 18.Jacob W.F., Santer,M. and Dahlberg,A.E. (1987) A single base change in the Shine–Dalgarno region of 16S rRNA of Escherichia coli affects translation of many proteins. Proc. Natl Acad. Sci. USA, 84, 4757–4761. [DOI] [PMC free article] [PubMed] [Google Scholar]
- 19.Ringquist S., Shinedling,S., Barrick,D., Green,L., Binkley,J., Stormo,G.D. and Gold,L. (1992) Translation initiation in Escherichia coli: sequences within the ribosome-binding site. Mol. Microbiol., 6, 1219–1229. [DOI] [PubMed] [Google Scholar]
- 20.deSmit M.H. and van Duin,J. (1994) Control of translation by mRNA secondary structure in Escherichia coli. A quantitative analysis of literature data. J. Mol. Biol., 244, 144–150. [DOI] [PubMed] [Google Scholar]
- 21.Stenstrom C.M., Jin,H., Major,L.L., Tate,W.P. and Isaksson,L.A. (2001) Codon bias at the 3′-side of the initiation codon is correlated with translation initiation efficiency in Escherichia coli. Gene, 263, 273–284. [DOI] [PubMed] [Google Scholar]
- 22.Pedersen-Lane J., Maley,G.F., Chu,E. and Maley,F. (1997) High-level expression of human thymidylate synthase. Protein Expr. Purif., 10, 256–262. [DOI] [PubMed] [Google Scholar]
- 23.Studier F.W., Rosenberg,A.H., Dunn,J.J. and Dubendorff,J.W. (1990) Use of T7 RNA polymerase to direct expression of cloned genes. Methods Enzymol., 185, 60–89. [DOI] [PubMed] [Google Scholar]
- 24.Sprengart M.L., Fuchs,E. and Porter,A.G. (1996) The downstream box: an efficient and independent translation initiation signal in Escherichia coli. EMBO J., 15, 665–674. [PMC free article] [PubMed] [Google Scholar]
- 25.Watzele M., Nemetz,C., Obermeier,W., Seidel,A. and Buchberger,B. (2003) High-throughput expression PCR used to systematically investigate regulation of translation initiation in an Escherichia coli cell-free expression system. In Swartz,J.R. (ed.), Cell-free Protein Expression. Springer, Berlin, pp. 25–30. [Google Scholar]
- 26.Watzele M., Nemetz,C., Metzler,T., Fernholz,E., Hoffmann,T. and Mutter,W. (2001) Rapid Translation System RTS 100—a high throughput cell-free protein expression. Biochemica, 3, 27–28. [Google Scholar]
- 27.Resto E., Iida,A., Van Cleve,M.D. and Hecht,S.M. (1992) Amplification of protein expression in a cell free system. Nucleic Acids Res., 20, 5979–5983. [DOI] [PMC free article] [PubMed] [Google Scholar]
- 28.Laemmli U.K. (1970) Cleavage of structural proteins during the assembly of the head of bacteriophage T4. Nature, 227, 680–685. [DOI] [PubMed] [Google Scholar]
- 29.Sambrook J., Russel,D.W. and Sambrook,J. (2001) Molecular Cloning: A Laboratory Manual (3rd edn). Cold Spring Harbor Laboratory, Cold Spring Harbor, NY. [Google Scholar]
- 30.Donis-Keller H. (1979) Site specific enzymatic cleavage of RNA. Nucleic Acids Res., 7, 179–192. [DOI] [PMC free article] [PubMed] [Google Scholar]
- 31.Gunzl A., Palfi,Z. and Bindereif,A. (2002) Analysis of RNA-protein complexes by oligonucleotide-targeted RNase H digestion. Methods, 26, 162–169. [DOI] [PubMed] [Google Scholar]
- 32.Phillips C., Kyriakopoulou,C.B. and Virtanen,A. (1999) Identification of a stem–loop structure important for polyadenylation at the murine IgM secretory poly(A) site. Nucleic Acids Res., 27, 429–438. [DOI] [PMC free article] [PubMed] [Google Scholar]
- 33.Zuker M. (2003) Mfold web server for nucleic acid folding and hybridization prediction. Nucleic Acids Res., 31, 3406–3415. [DOI] [PMC free article] [PubMed] [Google Scholar]
- 34.Landick R. and Yanofsky,C. (1987) Isolation and structural analysis of the Escherichia coli trp leader paused transcription complex. J. Mol. Biol., 196, 363–377. [DOI] [PubMed] [Google Scholar]
- 35.Landick R., Yanofsky,C., Choo,K. and Phung,L. (1990) Replacement of the Escherichia coli trp operon attenuation control codons alters operon expression. J. Mol. Biol., 216, 25–37. [DOI] [PubMed] [Google Scholar]
- 36.Gutman G.A. and Hatfield,G.W. (1989) Nonrandom utilization of codon pairs in Escherichia coli. Proc. Natl Acad. Sci. USA, 86, 3699–3703. [DOI] [PMC free article] [PubMed] [Google Scholar]
- 37.Lima W.F., Monia,B.P., Ecker,D.J. and Freier,S.M. (1992) Implication of RNA structure on antisense oligonucleotide hybridization kinetics. Biochemistry, 31, 12055–12061. [DOI] [PubMed] [Google Scholar]
- 38.Young S. and Wagner,R.W. (1991) Hybridization and dissociation rates of phosphodiester or modified oligodeoxynucleotides with RNA at near-physiological conditions. Nucleic Acids Res., 19, 2463–2470. [DOI] [PMC free article] [PubMed] [Google Scholar]
- 39.Nellen W. and Lichtenstein,C. (1993) What makes an mRNA anti-sense-itive? Trends Biochem. Sci., 18, 419–423. [DOI] [PubMed] [Google Scholar]
- 40.Carrier T.A. and Keasling,J.D. (1999) Library of synthetic 5′ secondary structures to manipulate mRNA stability in Escherichia coli. Biotechnol. Prog., 15, 58–64. [DOI] [PubMed] [Google Scholar]
- 41.Ivanovski G., Gubensek,F. and Pungercar,J. (2002) mRNA secondary structure can greatly affect production of recombinant phospholipase A(2) toxins in bacteria. Toxicon, 40, 543–549. [DOI] [PubMed] [Google Scholar]
- 42.Iost I., Guillerez,J. and Dreyfus,M. (1992) Bacteriophage T7 RNA polymerase travels far ahead of ribosomes in vivo. J. Bacteriol., 174, 619–622. [DOI] [PMC free article] [PubMed] [Google Scholar]
- 43.Draper D.E. (1996) Strategies for RNA folding. Trends Biochem. Sci., 21, 145–149. [PubMed] [Google Scholar]
- 44.Misra V.K. and Draper,D.E. (2002) The linkage between magnesium binding and RNA folding. J. Mol. Biol., 317, 507–521. [DOI] [PubMed] [Google Scholar]
- 45.Tinoco I. Jr and Bustamante,C. (1999) How RNA folds. J. Mol. Biol., 293, 271–281. [DOI] [PubMed] [Google Scholar]
- 46.Brion P. and Westhof,E. (1997) Hierarchy and dynamics of RNA folding. Annu. Rev. Biophys Biomol. Struct., 26, 113–137. [DOI] [PubMed] [Google Scholar]
- 47.Carpousis A.J. (2002) The Escherichia coli RNA degradosome: structure, function and relationship in other ribonucleolytic multienzyme complexes. Biochem. Soc. Trans., 30, 150–155. [PubMed] [Google Scholar]
- 48.Grunberg-Manago M. (1999) Messenger RNA stability and its role in control of gene expression in bacteria and phages. Annu. Rev. Genet., 33, 193–227. [DOI] [PubMed] [Google Scholar]
- 49.Ross J. (1995) mRNA stability in mammalian cells. Microbiol. Rev., 59, 423–450. [DOI] [PMC free article] [PubMed] [Google Scholar]
- 50.Chen C.Y. and Belasco,J.G. (1990) Degradation of pufLMX mRNA in Rhodobacter capsulatus is initiated by nonrandom endonucleolytic cleavage. J. Bacteriol., 172, 4578–4586. [DOI] [PMC free article] [PubMed] [Google Scholar]
- 51.McCormick J.R., Zengel,J.M. and Lindahl,L. (1994) Correlation of translation efficiency with the decay of lacZ mRNA in Escherichia coli. J. Mol. Biol., 239, 608–622. [DOI] [PubMed] [Google Scholar]
- 52.Emory S.A., Bouvet,P. and Belasco,J.G. (1992) A 5′-terminal stem–loop structure can stabilize mRNA in Escherichia coli. Genes Dev., 6, 135–148. [DOI] [PubMed] [Google Scholar]
- 53.Wong H.C. and Chang,S. (1986) Identification of a positive retroregulator that stabilizes mRNAs in bacteria. Proc. Natl Acad. Sci. USA, 83, 3233–3237. [DOI] [PMC free article] [PubMed] [Google Scholar]
- 54.Bouvet P. and Belasco,J.G. (1992) Control of RNase E-mediated RNA degradation by 5′-terminal base pairing in E. coli. Nature, 360, 488–491. [DOI] [PubMed] [Google Scholar]
- 55.Chen L.H., Emory,S.A., Bricker,A.L., Bouvet,P. and Belasco,J.G. (1991) Structure and function of a bacterial mRNA stabilizer: analysis of the 5′ untranslated region of ompA mRNA. J. Bacteriol., 173, 4578–4586. [DOI] [PMC free article] [PubMed] [Google Scholar]
- 56.Arnold T.E., Yu,J. and Belasco,J.G. (1998) mRNA stabilization by the ompA 5′ untranslated region: two protective elements hinder distinct pathways for mRNA degradation. RNA, 4, 319–330. [PMC free article] [PubMed] [Google Scholar]