

Abstract
The pharmacodynamic interactions between recombinant mouse interleukin-10 (IL-10) and prednisolone were examined in lipopolysaccharide (LPS)-induced experimental endotoxemia in Balb/c mice. Treatment phases consists of single doses of IL-10 (10 μg/kg i.p.), prednisolone (25 (mg/kg i.p.), IL-10 (2.5 μg/kg i.p.) with prednisolone (6.25 mg/kg i.p.), or placebo (saline). Measurements included plasma steroid kinetics and IL-10 concentrations and responses to LPS including proinflammatory cytokines (TNF-α, IFN-γ) and circulatory NO measured as plasma nitrate/nitrite concentrations. The intraperitoneal dosing of LPS produced large and transient elevations of plasma TNF-α, IFN-γ, and NO concentrations. Noncompartmental and model fitting using extended indirect response models based on drug inhibition of multiphase stimulation of biomarkers by LPS were used to describe the in vivo pharmacodynamics and drug interactions. Dosing with prednisolone, IL-10, or their combinations produced strong inhibition of cytokine and NO production. The IC50 values of prednisolone ranged from 54 to 171 ng/mL, and IC50 values for IL-10 ranged from 0.06 to 0.69 ng/mL. The production of NO was described as a cascading consequence of the TNF-α and IFN-γ plasma concentrations. The joint dosing of IL-10 with prednisolone produces moderately synergistic immunosuppressive effects in this system. Both drugs were sufficiently protective in suppressing the inflammatory mediators when administered prior to the LPS trigger, while such effects were modest when administered after the inflammatory stimulus was provoked. The integrated and complex pharmacokinetic/pharmacodynamic models well capture the in vivo processes, drug potencies, and interactions of IL-10 and prednisolone.
Keywords: pharmacodynamic interaction, mouse interleukin, prednisolone, mouse model
INTRODUCTION
Sepsis, septic shock, and acute respiratory distress syndrome (ARDS) are clinical conditions reflecting uncontrolled systemic immunological responses resulting from excess production of proinflammatory cytokines (such as TNF-α, IL-1β, IFN-γ), which in turn, induce the expression of type II inducible nitric oxide synthase (NOS) isoform causing generation of nitric oxide (NO). Large quantities of NO, in turn, contribute to the pathophysiology of sepsis that includes conditions such as hypotension, multiple organ failures, cardiovascular dysfunction, and vascular leakage.1 The LPS-induced endotoxemia in animals model such conditions. This study uses the lipopolysaccharide (LPS)-induced endotoxemia model in Balb/c mice to examine the single and joint effects of prednisolone and a cytokine, interleukin-10 (IL-10), in controlling excessive production of TNF-α, IFN-γ, and NO.
Corticosteroids have been the mainstay for treatment of many immune-related disorders. However, these drugs pose problems such as the nonspecificity of responses, serious side effects, and steroid-resistant disorders. The pleiotropic cytokine, IL-10 has promising immunosuppressive properties.2-4 This agent offers protection in in vivo models of endotoxemia in humans5 and animals6,7 by inhibiting proinflammatory cytokine production and has a protective role in inflammatory bowel disorders.8 Thus, a combination regimen with corticosteroids may enable significant mutual dose reduction and improve efficacy. Our laboratory has conducted clinical interaction studies between prednisolone and IL-109,10 and an ex vivo lymphocyte interaction study between IL-10 and prednisolone11 to explore their joint use. The current study further explores the immunomodulatory properties of these agents in a disease model.
The present study utilizes both immediate inflammatory biomarkers such as TNF-α and IFN-γ as well as delayed NO production in determining in vivo inhibitory effects of prednisolone and IL-10. Extended indirect response models were used for describing cytokine induction and their suppression by the drugs incorporating concepts of pharmacological drug–drug interactions.
MATERIALS AND METHODS
Animals
Male Balb/c (8 to 10 weeks old) mice weighing 18–25 g were purchased from Harlan (Indianapolis, IN). Animals were housed in 12-h light/12-h dark, constant temperature (22°C) environment. Animals were acclimatized for at least 1 week prior to experiments.
Compounds
Prednisolone hemisuccinate and lipopolysaccharide (LPS) from Escherichia coli serotype 0127:B8 were purchased from Sigma (St. Louis, MO), recombinant mouse IL-10 from Endogen (Woburn, MA). These compounds were dissolved in saline before dosing and the placebo solution used was saline.
Experimental Design
The project adhered to the principles of Laboratory Animal Care (NIH publication no. 85-23, revised 1985). Four treatment phases include intraperitoneal (i.p.) administration of placebo (saline), prednisolone (25 mg/kg), IL-10 (10 μg/kg) and prednisolone (6.25 mg/kg) with IL-10 (2.5 μg/kg). All treatments were followed by a 15-min interval, and then a 15 mg/kg i.p. injection of LPS was given. Animals were sacrificed at various time points over 48 h; blood was collected, centrifuged for plasma, and stored at −80°C for pharmacokinetic (prednisolone, prednisone, and IL-10) and pharmacodynamic (TNF-α, IFN-γ, and NO2/NO3) measurements. Drugs were also administered 30 min following LPS dosing and animals were sacrificed at 1.5 and 24 h post-LPS dosing to determine post-LPS drug treatment effects. Prednisolone (6.25 mg/kg, i.p.), IL-10 (2.5 μg/kg, i.p.) were injected separately and animals sacrificed at 1.5 and 24 h post-LPS treatment to assess responses at lower dose. Control pharmacokinetic studies were performed with IL-10 and prednisolone without LPS treatment. At least three animals were used at each time point for all treatments.
Pharmacokinetic Measurements
Prednisolone and prednisone in plasma were measured by a validated high-performance liquid chromatographic assay.12 The assay was linear from 5 to 1000 ng/mL with inter- and intraday coefficients of variation below 10%. Plasma IL-10 was measured using an Opteia ELISA assay kit (Pharmingen, San Diego, CA) with a limit of quantitation (LOQ) of 30 pg/mL.
Pharmacodynamic Measurements
Plasma TNF-α and IFN-γ were analyzed using an Opteia ELISA assay kit (Pharmingen) with limits of quantitation of 15 and 30 pg/mL. Plasma (NOx) measurement was carried out using a combination of nitrate reductase and Griess assay in microtiter plates as described previously.13 The limit of quantitation for the NOX measurement was 100 μM.
Pharmacokinetics
Plasma prednisolone concentrations (Cpred) versus time (t) were described by:
where CL is systemic clearance and V is volume of distribution. The pharmacokinetics of IL-10 could not be determined because there was substantial production of endogenous IL-10 following LPS administration.
Pharmacodynamics
The pharmacoimmunodynamic model describing the effects of IL-10 and/or prednisolone is based on the premise that the production of the inflammatory cytokines caused by endotoxin (LPS) is inhibited by the immunosuppressants thus fitting into the criteria of Model I of indirect response models.14 The overproduction of NO is accounted for by IFN-γ or TNF-α stimulation, as both cytokines were shown to have overlapping roles in producing NO.15 The joint effects of IL-10 and prednisolone was modeled based on both competitive and noncompetitive interactions.16,17
TNF-α and IFN-γ Dynamics
Plasma TNF-α or IFN-γ concentrations (R) versus time following LPS challenge were described as:
| (1) |
where the production rate,
| (2) |
is described by n = 2 or 3 zero-order inputs (kzi), describing cytokine production due to LPS stimulation, and kel is the first-order elimination rate constant of the proinflammatory cytokines.
For TNF-α, Rin (Rin,TNF) is described by two zero-order inputs (kz1 and kz2), describing the production of TNF-α due to LPS stimulation, and kel,TNF is the first-order elimination rate constant of TNF-α. For IFN-γ, Rin (Rin,IFN) is described by three zero-order inputs (kz1 , kz2, kz3) describing the production of IFN-γ due to LPS stimulation, and kel,IFN is the first-order elimination rate constant of IFN-γ. The parameter Rin in eq. 2 is inhibited by endogenous IL-10 during the LPS only treatment phase:
| (3) |
for time t1 to t2 acting on kz1, t3 to t4 acting on kz2 for TNF-α and IFN-γ, and for time interval t5 to t6 acting on kz3 for IFN-γ only. The IC50,endo IL-10 is the endogenous IL-10 concentration producing 50% inhibition of Rin,TNF or Rin,IFN, Imax- is the maximum possible inhibitory factor achieved by the immuno-suppressant, and γ is the Hill Coefficient.
During the prednisolone alone treatment phase, Rin is inhibited by the joint effects of endogenous IL-10 and prednisolone acting competitively:
| (4a) |
For the same (prednisolone alone) treatment phase, the inhibition of Rin was modeled by the noncompetitive interaction equation describing the joint effects of endogenous IL-10 and prednisolone:
| (4b) |
where IC50,pred is the total prednisolone concentration causing 50% inhibition of the TNF-α or IFN-γ secretory rate.
The combined action of IL-10 and prednisolone using the competitive interaction model16 is based on the premise that there is a common pathway in their immunosuppressive action including blocking of NF-κB activity by stabilization18 or upregulation of IκBα.19 Alternatively use of the noncompetitive interaction model17 is justified by the fact that IL-10 and prednisolone are different classes of drugs, having mutually exclusive mechanisms of action that enable each agent to act independently of the other.
Exogenous IL-10 only treatment causes similar inhibition of Rin during the IL-10 treatment phase:
| (5) |
where IC50,IL-10 is the total IL-10 concentration producing 50% suppression of cytokine production rate during the intervals t1 to t2 and t3 to t4 for TNF-α or t1 to t2, t3 to t4, and t5 to t6 for IFN-γ.
Plasma TNF-α or IFN-γ concentrations following joint dosing of IL-10 and prednisolone can be described using eq. 6a acting competitively is described as follows:
| (6a) |
where ξ = IC50,IL-10/IC50,PRED.
The equivalent pharmacodynamic interaction model based on extension of the noncompetitive interaction model as proposed by Ariens and Simons17 is:
| (6b) |
Note that in eqs. 6a and 6b there is one single potency term (IC50,IL-10), while the IC50,PRED is expressed as a factor of ξ. The individual dynamic parameters of the two drugs are obtained from eqs. 3, 4a, 4b, and 5 using the inhibition data from individual agents, and then fixed in eqs. 6a and 6b. Equations 6a and 6b are applied to the interaction data to estimate the potency term Ψ.11 If Ψ equals 1, there is no interaction, that is, there is a simple additive effect, while Ψ less than 1 signifies synergism, and Ψ greater than 1 indicates antagonism. For IFN-γ, a different IC50 was allowed for the kz3 phase (pf · IC50) to accommodate for the delayed immunosuppressive effect.
NO Dynamics
Increased production of NO in the inflammatory cascade starts around 6 h in response to LPS stimulation. Both TNF-α and IFN-γ are mediators in a complimentary way15 causing overexpression of the inducible form of nitric oxide synthase enzyme (iNOS), which in turn, causes NO production. Both TNF-α and IFN-γ were used as mediators in NO generation in two separate models:
NO Generation through TNF-α
| (7) |
| (8) |
| (9) |
where PreiNOS represents the precursor to inducible nitric oxide (iNOS) enzyme, kNO,# are intercompartmental rate constants describing the production of NO from TNF-α following LPS induction, the power coefficient (δ) adjusts for transduction, and kel,NO is the first-order elimination rate constant of NOx.
NO Generation through IFN-γ
| (10) |
| (11) |
Based on the terminology for indirect response models, the R in eqs. 1 to 11 reflects the measured response variable. Maximal inhibition for both drugs was assumed (i.e., Imax = 1.0).
Modeling was carried out using the ADAPT II program.20 The goodness-of-fit criteria for each model included visual examination of the predicted versus observed data, absence of systematic deviations, and the Akaike Information Criterion (AIC) value. Observed IL-10 concentrations were used as PK input for the PD function. For the delays in the PD response, PK functions were shifted by the same lag time.
Statistical Analysis
Area under the effect curve (AUEC) for the various PD end points were used to assess the net effect of drug treatment. The pharmacodynamic differences observed between treatments were assessed by variance analysis (SAS Institute, Cary, NC) in relation to the placebo response. p -Values are reported for all statistical comparison tests. Unpaired t-tests were used for pair-wise comparison of pharmacodynamic parameters. Bailer’s method was used to compare the trapezoidal AUC of prednisolone between control and LPS treatment phases.21
RESULTS
Pharmacokinetics
Plasma concentration–time profiles of prednisolone and its metabolite prednisone for the two treatment phases and the control phase are shown in Figure 1. The hemisuccinate form of prednisolone was converted rapidly (conversion phase not seen) to prednisolone, which in turn, was quickly metabolized to prednisone. Prednisolone concentrations followed monoexponential decline with a t1/2 (half-life) of 0.46 h and distributes into the extravascular space with a V (volume of distribution) of 1.64 L/kg (Table 1). Prednisolone, a low extraction drug, is eliminated mostly by hepatic metabolism with clearance of 2.5 L/(kg · h). The dose normalized AUC comparison of prednisolone using Bailer’s method21 reveal no significant differences in the AUC between the prednisolone control phase and prednisolone + LPS treatment phases (in the presence and absence of IL-10), while the AUC of prednisone increased significantly (p < 0.05) for the prednisolone (+LPS) treatment phase in comparison to the control phase. The increase in metabolic conversion of prednisolone to prednisone due to systemic inflammation by LPS was further revealed by the AUCprednisolone/AUCprednisone ratio, which changed from 29.64 in the prednisolone control phase to 22.09 in the prednisolone + LPS phase.
Figure 1.
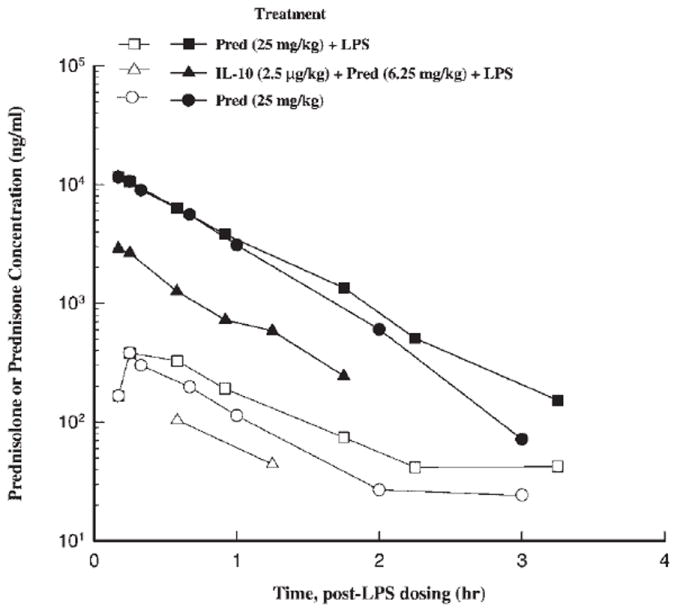
Time course of mean ± SD plasma prednisolone and prednisone concentrations for different treatment phases (closed symbols = prednisolone, open symbols = prednisone, squares = prednisolone + LPS, triangle IL-10 + prednisolone, circle = prednisolone only treatment).
Table 1.
Pharmacokinetic Parameters of Prednisolne for Control and LPS Treatment Phases
| Control | Prednisolone | Prednisolone + IL-10 | |
|---|---|---|---|
| CL (L/(kg · h) | 2.60 | 2.46 | 3.52 |
| V (L/kg) | 1.64 | 1.64 | 3.2 |
| t1/2 (h) | 0.44 | 0.46 | 0.63 |
| AUCprednisolone/AUCprednisone | 29.64 | 22.09 | XXa |
Unble to estimate AUC due to too few data points for prednisone.
The pharmacokinetics of IL-10 (Fig. 2) could not be determined in this study because LPS administration causes considerable endogenous IL-10 production that affected the concentration–time profiles at the four treatment phases. A two-way ANOVA revealed significant contribution of the four treatments (p < 0.0001) and the time of measurements (p < 0.0001) to the difference in the plasma concentrations of IL-10. The IL-10 concentrations for the IL-10 treatment phase were highest as reflected by the AUC0–6 value (6443) in comparison to the three other phases. The AUC0–6 for the placebo (LPS only treatment phase), prednisolone, and joint treatment phases were almost identical with values of 1127, 1128, and 1197 pg · h/mL. The kinetics during the control IL-10 treatment phase could not be characterized because the disposition phase was lacking.
Figure 2.
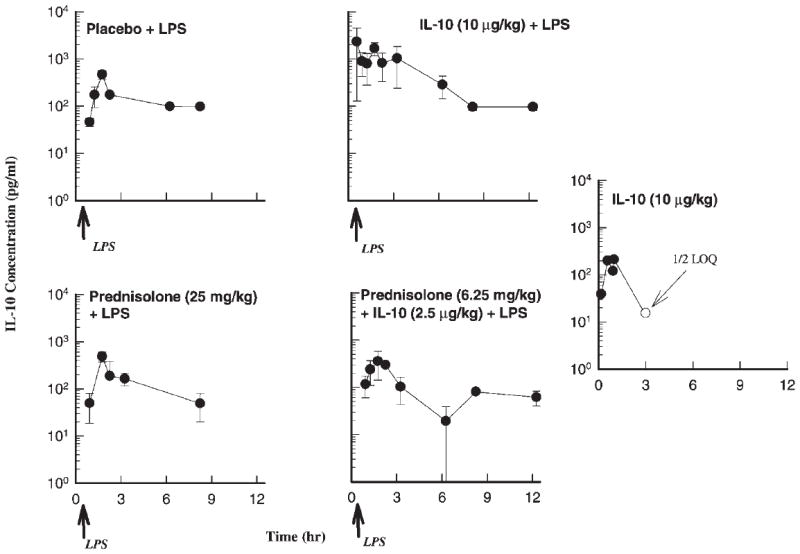
Time course of mean ± SD plasma IL-10 concentrations for the indicated treatments.
Pharmacodynamics
The administration of LPS caused immediate release of TNF-α, which peaks at 1.5 h post LPS-dosing and returns quickly to basal levels (Fig. 3). The PD model describing endogenous TNF-α levels consisted of two zero-order inputs, one from 0.3 to 1 h, and the other from 1 to 1.5 h, with the latter accounting for circa 90% of total TNF-α input following LPS administration. All three drug treatment phases cause pronounced inhibition (p < 0.0001) of plasma TNF-α concentrations reflected by the AUEC values (Table 2) in comparison to the placebo (LPS only) treatment phase. The TNF-α AUEC values were 2305, 410, 152, and 471 pg · h/mL for the placebo, IL-10, prednisolone, and IL-10 + prednisolone treatment phases. The jointly fitted values of kz1 and kz2 were 1417 and 15,990 ng/(mL · h). For the placebo and prednisolone phases, the IC50,endoIL-10 was very high, 28,860 and 41,550 ng/mL, as determined by the competitive and non-competitive interaction models. The IC50,IL-10 determined from the IL-10 treatment phase was 0.06 ng/mL, much lower than the IC50 of endogenous IL-10. The IC50,pred for the prednisolone alone treatment was 171 ng/mL, as determined by both interaction models. The elimination rate constant of TNF-α was 4.51 h−1. Values of Ψ were 0.51 and 0.77 for competitive and noncompetitive interaction models, signifying a modest degree of synergistic interaction.
Figure 3.
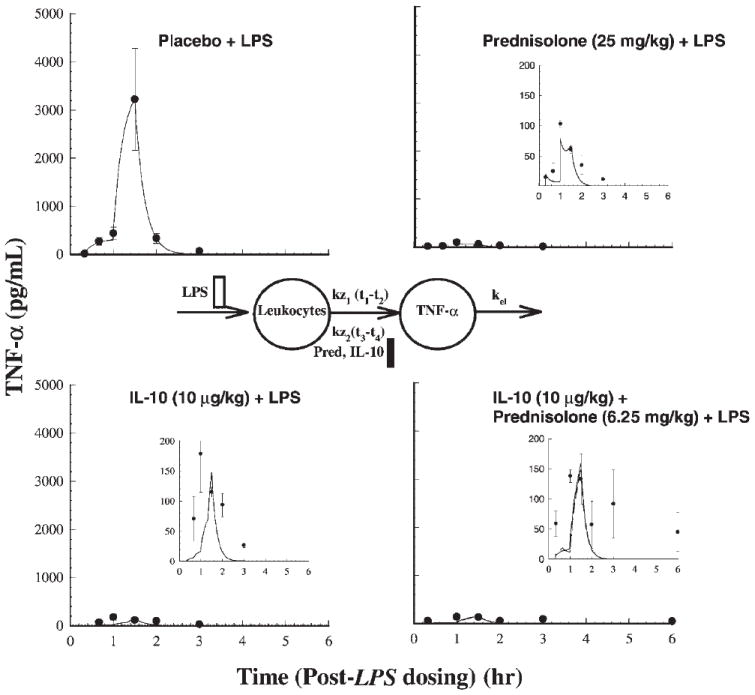
Time course of mean ± SD plasma TNF-α concentrations (with fitted solid lines for the competitive interaction model) for the indicated treatments. Also shown is the pharmacodynamic model used in describing TNF-α responses.
Table 2.
Pharmacoimmunodynamic Parameters for TNF-α and IFN-γ and NO Production in the Mouse Endotoxemia Model following Four Treatment Phases
| Placebo | IL-10 | Prednisolone | IL-10 + Prednisolone | |
|---|---|---|---|---|
| TNF-α | ||||
| AUEC (pg · h/mL) | 2305 | 410 | 152 | 471 |
| IC50, IL-10 (ng/mL) | — | 0.057 | — | 0.029a, 0.044b |
| IC50, PRED (ng/mL) | — | — | 171a, 171b | 86.3a, 131b |
| AUECTreat/AUCPlacebo | — | 0.18 | 0.07 | 0.2 |
| IFN-γ | ||||
| AUEC (pg · h/mL) | 318775 | 160287 | 33355 | 60051 |
| IC50, IL-10 (ng/mL) | — | 0.694 | — | 0.371 |
| IC50 PRED (ng/mL) | — | — | 54.0a, 66.9b | 28.6a, 40.1b |
| AUECTreat/AUCPlacebo | — | 0.50 | 0.10 | 0.20 |
| NO | ||||
| AUEC (μmol · h) | 24752 | 10934 | 7807 | 13590 |
| AUECTreat/AUCPlacebo | — | 0.44 | 0.32 | 0.55 |
Competitive interaction model.
Noncompetitive interaction model.
Plasma IFN-γ (Fig. 4) peaks at 8.0 h, then drops rapidly, followed by a more gradual release between 12 to 30 h. The PD model describing LPS-stimulated plasma IFN-γ concentrations has three zero-order inputs, one from 0 to 2 h (kz1), next from 4.3 to 8 h (kz2) and the last spurt from 19.3 to 30 h (kz3). The relative contributions of kz1, kz2, and kz3 as determined by the PD model to the total IFN-γ input were 1, 73, and 26%. The jointly fitted values of kz1, kz2, and kz3 were 453, 18,670, and 2085 pg/(mL · h). All three drug treatment phases cause pronounced inhibition (p < 0.0001) of plasma IFN-γ secretion in comparison to the placebo (LPS only) treatment phase. Inhibition for the IL-10 phase was significantly weaker (p < 0.05) than the other two active treatment phases. The AUEC of IFN-γ was highest for the placebo (318,775 pg · h/mL), followed by the IL-10 treatment phase (160,287 pg · h/mL), joint treatment phase (60,051 pg · h/mL), and the prednisolone alone treatment phase (33,355 pg · h/mL). For the placebo and prednisolone phases, the IC50,endo IL-10 was 395 for competitive and 406 ng/mL for noncompetitive interaction models during the kz1 and kz2 phases. The IC50,IL-10 for the kz1 and kz2 phases determined from the IL-10 treatment phase was 694 ng/mL, which is higher than the endogenous IC50 of IL-10 signifying less potency of exogenous IL-10 treatment. The IC50,PRED following prednisolone alone treatment during the kz1 and kz2 phases was 54.0 and 66.9 ng/mL based on competitive and noncompetitive modeling. The value of ψ was estimated to be 0.53 by competitive and 0.60 by noncompetitive interaction models signifying a moderate degree of synergistic response upon joint dosing. The potency factor (pf) for prednisolone or IL-10, signifying a different sensitivity for the kz3 phase was found to be 0.0002. The low value is a result of the prolonged inhibition during the last burst in IFN-γ release. Hill coefficients (γ) could not be estimated (high standard errors or unreasonable values) for any of the PD models for TNF-α and IFN-γ responses and were thus fixed at 1. This is not at variance from our previous ex vivo work,11 as the γ estimate was close to 1.
Figure 4.
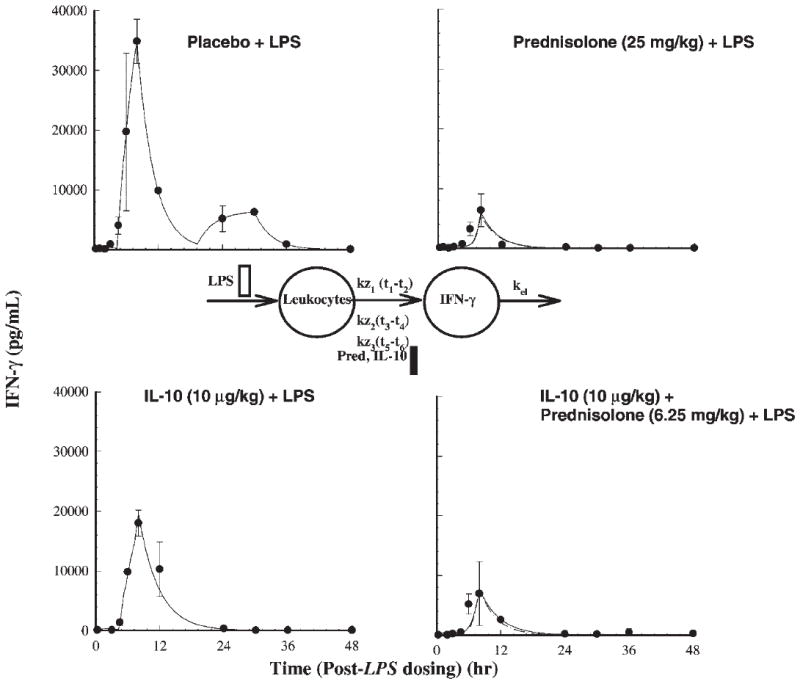
Time course of mean ± SD plasma IFN-γ concentrations (with fitted solid lines for the competitive interaction model) for the indicated treatments. Also shown is the pharmacodynamic model used in describing IFN-γ responses.
Figures 5A and B describe the dynamics of NO. The production of NO starts around 6 h following LPS stimulation and peaks around 12 h. All three treatments cause significant suppression of NO production (p < 0.0001) compared to the placebo phase. The PD model for the plasma NOX concentrations as a function of TNF-α and IFN-γ concentrations described by the noncompetitive interaction models are shown in Figures 5A and B. An intermediary compartment was included in the TNF-α–mediated iNOS induction to account for the large time lag for NO production and TNF-α induction. The power function (δ) used to account for transduction dampening for the cascade was 0.4 for TNF-α induction and 0.6 for IFN-γ induction models (Table 3). The IFN-γ induction model described better the NO dynamics in comparison to the TNF-α induction model as seen from the AIC values, which was 382 for the former and 388 for the latter. The AUEC0–48 values for the four treatment phases were 24,752, 7807, 10,934, and 13,590 μM · h (placebo, prednisolone, IL-10, and IL-10 + prednisolone phases), signifying substantial inhibition during the three active treatment phases.
Figure 5.
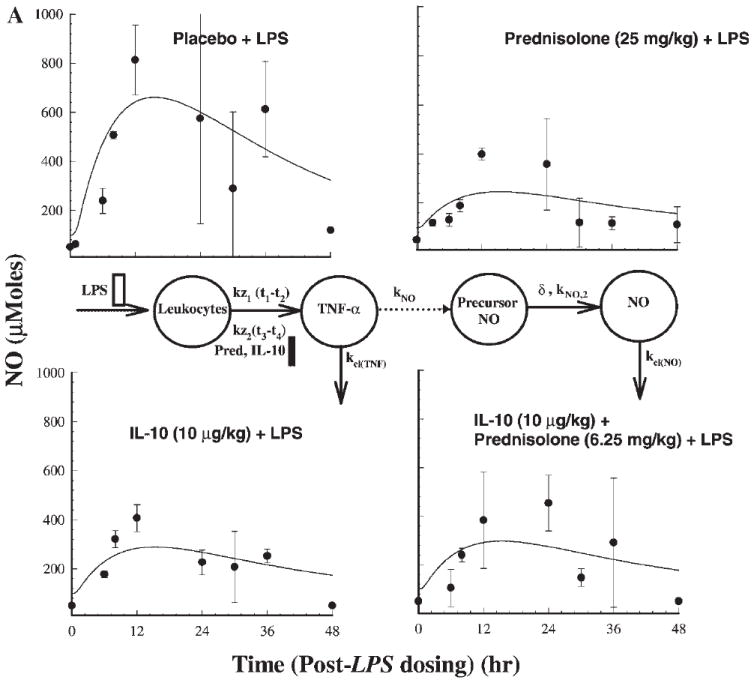
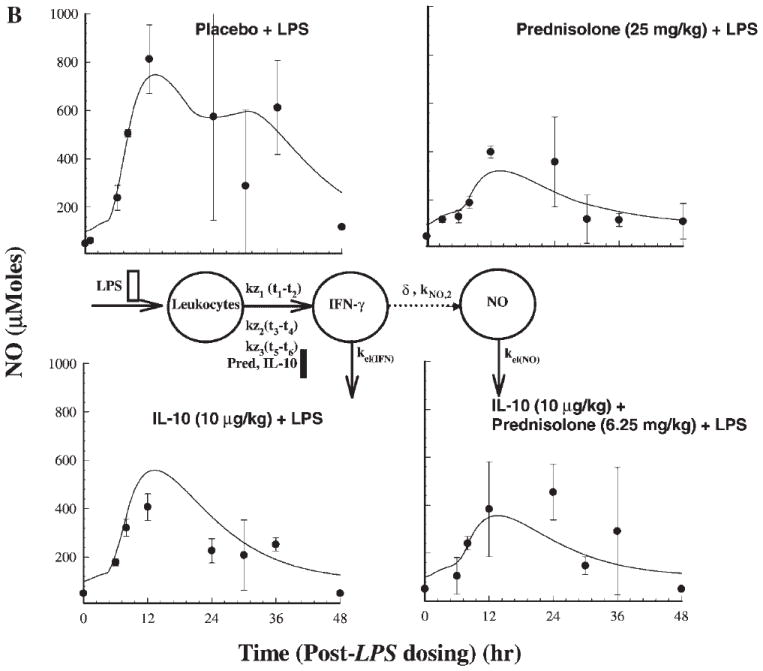
Time course of mean ± SD plasma NO concentrations (with fitted solid lines) for indicated treatments (a). Also shown is the pharmacodynamic model used in describing NO response mediated by stimulation by TFN-α. (b) Similar profiles based on stimulation by IFN-γ.
Table 3.
Pharmacoimmunodynamic Parameters for NO Production
| TNF-α as Mediator | IFN-γ as Mediator | |
|---|---|---|
| kNO,1 (h−1) | 2155 | 0.13 |
| kNO,2 (h−1) | 0.21 | 2.16 |
| kNO,3 (h−1) | 0.21 | — |
| kel,NO (h−1) | 0.09 | 0.12 |
| Power function (δ) | 0.43 | 0.58 |
Figure 6 illustrates the protective effects of prednisolone and IL-10 when administered 30 min following LPS dosing in controlling TNF-α release measured at 1.5 h post-LPS dosing, and NO release measured at 24 h post-LPS dosing, in comparison to the placebo and individual drug (administered 15 min prior to LPS dosing) treatment phases. The post-LPS treatment of prednisolone caused significant suppression of TNF-α concentrations (Fig. 6A) while post-LPS IL-10 treatment failed to produce significant suppression (Fig. 6B). The delay in IL-10 absorption from the peritoneal cavity may partly explain its failure to suppress TNF-α elevation. Student t-tests were performed to assess the differences among each pair of treatment phases. Based on Figures 6C and D, post-LPS treatment of prednisolone or IL-10 failed to suppress NO concentrations.
Figure 6.
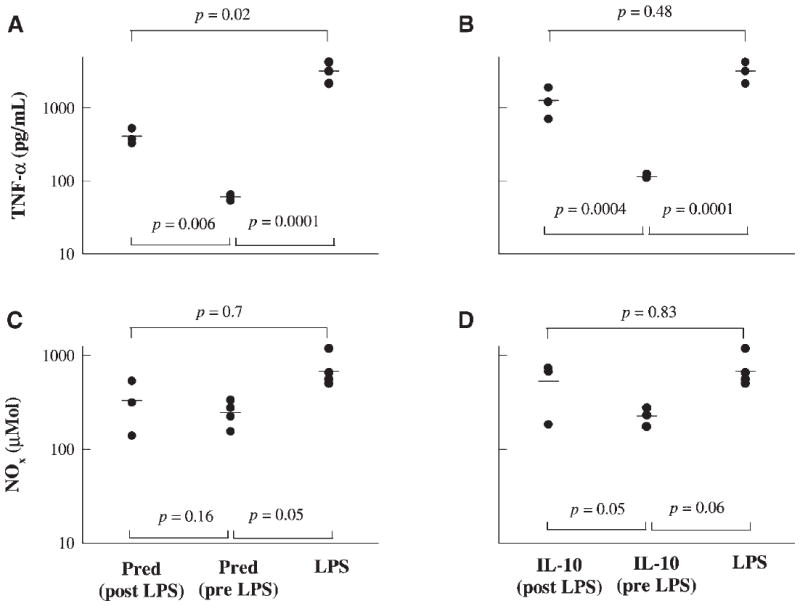
Comparative effects of post- versus predrug treatments with respect to LPS stimulation. Drug treatment 30 min following (post-LPS) and 15 min preceding (pre-LPS) LPS challenge are compared to LPS only treatment phases; samples were collected at 1.5 h following LPS dosing.
Figure 7 illustrates the dose/effect relationship of prednisolone and IL-10 in controlling TNF-α release measured at 1.5 h post-LPS dosing and NO release measured at 24 h post-LPS dosing. Drug treatments were carried at 15 min prior to LPS challenge. Based on Figures 7A and B, 6.25 mg/kg of prednisolone and 2.5 μg/kg of IL-10 cause significant suppression of TNF-α in comparison to the placebo phase. Figures 7C and D illustrate that the lower doses of IL-10 and prednisolone failed to significantly suppress NO release.
Figure 7.
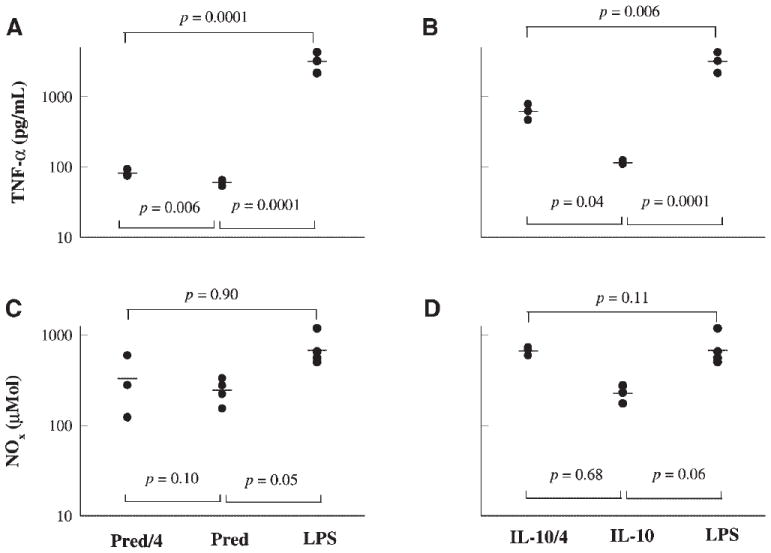
Comparative dose effects of 25 mg/kg (Pred) versus 6.25 mg/kg (Pred/4) dose of prednisolone, and 10 μg/kg (IL-10) versus 2.5 μg/kg (IL-10/4) of IL-10 against LPS only treatment phase; samples were collected at 1.5 h following LPS dosing.
DISCUSSION
Our earlier study indicated that there are no pharmacokinetic interactions between IL-10 and prednisolone in healthy volunteers.9 In this study, we observed a significant increase in metabolism of prednisolone to prednisone due to LPS stimulation. An earlier study indicated the role of cytokines in suppressing the induction of cytochrome P-450 isoenymes, including CYP3A4,22 which is partly responsible for the metabolism of prednisolone. Inhibiting this pathway may divert drug to the other metabolic pathway involving prednisolone-prednisone conversion. The kinetics of IL-10 in this sepsis model could only be reflected by exposure indices due to the influence of endogenous production of IL-10.
Administration of LPS causes immediate release of cytokines, which was prolonged for IFN-γ. The production of NO was observable after 6 h post-LPS treatment. In the present study, both IL-10 and prednisolone were shown to simultaneously inhibit multiple pathways of inflammation, cytokines, as well as excessive NO production. Induction and stabilization of IκBα by prednisolone and IL-10 probably contribute to the blocking of the NF-κB activity for cytokine and iNOS expression.
Pharmacodynamic models were used to describe the cascade of events related to LPS-induced systemic inflammation and their suppression by the IL-10 and/or prednisolone. Features of delayed production of TNF-α and its effects on turnover of NO following stimulation by flavone-8-acetic acid in mice were modeled by Veszelovsky et al.23 Our group also modeled delayed inhibition of antibody production.24 A similar modeling approach for an immunomodulating agent was used by Gozzi et al.,25 where the suppressant drug acts on a stimulated function. Prednisolone suppressed LPS-induced TNF-α and IFN-γ production almost completely, while IL-10 was effective at the dose level used in controlling the TNF-α release, but not completely the IFN-γ release. This explains the discrepancy in the IC50 values for IL-10, which were very high for IFN-γ (0.69 ng/mL) suppression in comparison to TNF-α (0.06 ng/mL) suppression. Note that Imax was fixed at 1 for both end points, owing to limitations in parameter estimability. Another caveat in the PD model was the use of different values for endogenous and exogenous IC50 for IL-10. This was necessary to get a satisfactory fitting of the data by the proposed model for all treatment phases. This is supported by the fact that substantial production of endogenous IL-10 during the LPS only (i.e., placebo) phase did not deter cytokine production during these phases. The true potency of endogenous IL-10 for inhibiting pro-inflammatory cytokine production cannot be estimated becuse the production of pro-inflammatory cytokines like TNF-α or IFN-γ, and anti-inflammatory cytokines like IL-10 following LPS challenge occurs simultaneously.
The synthesis of TNF-α is mediated mostly by monocytes and macrophages, while natural killer cells and lymphocytes are responsible for IFN-γ synthesis. IL-10 may be less effective in its inhibitory role on natural killer cells or lymphocytes. In our earlier clinical study,10 although prednisolone did not appear very effective in controlling cytokine production following ex vivo stimulation, the high drug concentrations demonstrated the efficacy of prednisolone in suppressing proinflammatory cytokine production conforming to earlier observations.26 The estimate of IC50 for the maximum secretory phase should be more relevant in assessing the immunosuppressive potency of the drugs. For prednisolone the estimates of IC50 were based on total prednisolone concentrations. Because the steroid concentrations were very high, correcting for linear protein binding by albumin (60%), the free IC50 values in relation to TNF-α and IFN-γ response were around 70 and 25 ng/mL. These estimates were slightly higher than the IC50 or SC50 values of 10 to 20 ng/mL obtained in our earlier work based on the effect of prednisolone on cell trafficking in humans. The IC50 values obtained for IL-10 were 0.06 and 0.70 ng/mL, while the IC50 or SC50 values in relation to its effects on cell trafficking in humans were in the range of 0.7 to 1.3 ng/mL.10 The NO concentrations were better described by the IFN-γ induction model, although it was found earlier that both IFN-γ and TNF-α have overlapping roles in NO production.15 The importance of NO as an inflammatory marker is well known.27 Both drugs were efficient enough to inhibit NO overproduction. Due to the complex nature of the inflammatory cascade following LPS stimulation, factors in addition to IFN-γ or TNF-α level may influence NO induction, which then cannot be fully explained by the current model. The model, however, still demonstrates a strong correlation between the dynamics of these proinflammatory cytokine inductions and increased NO production.
The joint effects of using 25% of the single agent doses were almost equally efficient as l00% of the single drugs in suppressing cytokine levels. Lower individual doses were selected in the joint regimen to ensure that the joint effects do not reach the maximum (i.e., Imax) level, which would render assessing the type of pharmacodynamic interaction impossible. Based on the interaction analysis, their joint action may be moderately synergistic (Ψ < 1). However, if drug exposure exceeded concentrations producing maximal inhibition, the interpretation of the intensity as well as the nature of interaction may be different. Figure 7 indicates that the dose needed to reach maximal inhibition may be greater than 6.25 mg/kg for prednisolone and definitely greater than 2.5 μg/kg for IL-10. The TNF-α concentration following the lower dose is slightly but significantly higher than the larger dose. The present data clearly shows that their interaction is not antagonistic. Their joint dosing was effective in controlling NO production. Because the exact mechanism of pharmacodynamic interaction between IL-10 and prednisolone is unknown, both competitive as well as noncompetitive interaction models were applied to the data. Models based on the principle of competitive interaction are inherently more antagonistic in comparison to noncompetitive interaction models.28 Hence, the values for interaction term, ψ is always lower for competitive interaction.
The results obtained clearly indicate that both prednisolone and IL-10 are very effective in controlling systemic immune reaction when administered before the inflammation was triggered. Our findings also suggest that prednisolone, but not IL-10, is effective (Fig. 6) in controlling inflammation when administered after the inflammatory cascade has been induced.
Pharmacodynamic end points such as cytokine production are considered to be an index of unwanted stimulation of the immune system leading to diseases such as arthritis,29 inflammatory bowel disorders,30 the overproduction of NO is the cause of severe hypotension, and organ failure in patients suffering from sepsis;31 thus inhibiting these mediators is considered desirable. Results from this study can help in understanding possible therapeutic interventions using prednisolone and/or IL-10 in immunological disorders.
Acknowledgments
This study was supported by grant GM24211 from the National Institute of General Medical Sciences, NIH. We thank Ms. Suzette Mis for providing valuable support in this study.
References
- 1.Thiemermann C. Nitric oxide and septic shock. Gen Pharmacol. 1997;29:159–166. doi: 10.1016/s0306-3623(96)00410-7. [DOI] [PubMed] [Google Scholar]
- 2.de Vries JE. Immunosuppressive and anti-inflammatory properties of interleukin 10. AnnMed. 1995;27:537–541. doi: 10.3109/07853899509002465. [DOI] [PubMed] [Google Scholar]
- 3.Lalani I, Bhol K, Ahmed AR. Interleukin-10:Biology, role in inflammation and autoimmunity[published erratum appears in Ann Allergy Asthma Immunol 1998 Mar,803:A-6] Ann Allergy Asthma Immunol. 1997;79:469–483. doi: 10.1016/S1081-1206(10)63052-9. [DOI] [PubMed] [Google Scholar]
- 4.Moore KW, O’Garra A, de Waal Malefyt R, Vieira P, Mosmann TR. Interleukin-10. Annu Rev Immunol. 1993;11:165–190. doi: 10.1146/annurev.iy.11.040193.001121. [DOI] [PubMed] [Google Scholar]
- 5.Pajkrt D, Camoglio L, Tiel-van Buul MC, de Bruin K, Cutler DL, Affrime MB, Rikken G, van der Poll T, ten Cate JW, van Deventer SJ. Attenuation of proinflammatory response by recombinant human IL-10 in human endotoxemia: Effect oftiming of recombinant human IL-10 administration. J Immunol. 1997;158:3971–3977. [PubMed] [Google Scholar]
- 6.Bean AG, Freiberg RA, Andrade S, Menon S, Zlotnik A. Interleukin 10 protects mice against staphylococcal enterotoxin B-induced lethal shock. Infect Immun. 1993;61:4937–4939. doi: 10.1128/iai.61.11.4937-4939.1993. [DOI] [PMC free article] [PubMed] [Google Scholar]
- 7.Howard M, Muchamuel T, Andrade S, Menon S. Interleukin 10 protects mice from lethal endotoxemia. J Exp Med. 1993;177:1205–1208. doi: 10.1084/jem.177.4.1205. [DOI] [PMC free article] [PubMed] [Google Scholar]
- 8.Schreiber S, Heinig T, Thiele HG, Raedler A. Immunoregulatory role of interleukin 10 in patients with inflammatory bowel disease. Gastroenterology. 1995;108:1434–1444. doi: 10.1016/0016-5085(95)90692-4. [DOI] [PubMed] [Google Scholar]
- 9.Chakraborty A, Blum RA, Cutler DL, Jusko WJ. Pharmacokinetic and adrenal interactions of interleukin-10 and prednisone in healthy volunteers. J Clin Pharmacol. 1999;39:624–635. doi: 10.1177/00912709922008137. [DOI] [PubMed] [Google Scholar]
- 10.Chakraborty A, Blum RA, Mis S, Cutler DL, Jusko WJ. Pharmacoimmunodynamic interactions of interleukin-10 and prednisone in healthy volunteers. Clin Pharmacol Ther. 1999;65:304–318. doi: 10.1016/S0009-9236(99)70110-4. [DOI] [PubMed] [Google Scholar]
- 11.Chakraborty A, Jusko WJ. Pharmacodynamic interaction of recombinant human interleukin-10 and prednisolone using in vitro whole blood lymphocyte proliferation. J Pharm Sci. 2001;91:1334–1342. doi: 10.1002/jps.3000. [DOI] [PubMed] [Google Scholar]
- 12.Jusko WJ, Pyszczynski NA, Bushway MS, D’Ambrosio R, Mis SM. Fifteen years of operation of a high-performance liquid chromatographic assay for prednisolone, cortisol and prednisone in plasma. J Chromatogr B. 1994;658:47–54. doi: 10.1016/0378-4347(94)00218-5. [DOI] [PubMed] [Google Scholar]
- 13.Tracey WR, Tse J, Carter G. Lipopolysaccharide-induced changes in plasma nitrite and nitrate concentrations in rats and mice: Pharmacological evaluation of nitric oxide synthase inhibitors. J Pharmacol Exp Ther. 1995;272:1011–1015. [PubMed] [Google Scholar]
- 14.Dayneka NL, Garg V, Jusko WJ. Comparison of four basic models of indirect pharmacodynamic responses. J Pharmacokinet Biopharmaceut. 1993;21:457–478. doi: 10.1007/BF01061691. [DOI] [PMC free article] [PubMed] [Google Scholar]
- 15.ter Steege JC, van de Ven MW, Forget PP, Brouckaert P, Buurman WA. The role of endogenous IFN-gamma, TNF-alpha and IL-10 in LPS-induced nitric oxide release in a mouse model. Cytokines. 1998;10:115–123. doi: 10.1006/cyto.1997.0263. [DOI] [PubMed] [Google Scholar]
- 16.Ariens EJ, Simonis AM. A molecular basis for drug action. J Pharm Pharmacol. 1964;16:137–157. doi: 10.1111/j.2042-7158.1964.tb07437.x. [DOI] [PubMed] [Google Scholar]
- 17.Ariens EJ, Simonis AM. A molecular basis for drug action. J Pharm Pharmacol. 1964b;16:289–312. doi: 10.1111/j.2042-7158.1964.tb07461.x. [DOI] [PubMed] [Google Scholar]
- 18.Lentsch AB, Shanley TP, Sarma V, Ward PA. In vivo suppression of NF-kappa B and preservation of I kappa B alpha by interleukin-10 and interleukin-13. J Clin Invest. 1997;100:2443–2448. doi: 10.1172/JCI119786. [DOI] [PMC free article] [PubMed] [Google Scholar]
- 19.Auphan N, DiDonato JA, Rosette C, Helmberg A, Karin M. Immunosuppression by glucocorticoids: Inhibition of NF-kappa B activity through induction of I kappa B synthesis. Science. 1995;270:286–290. doi: 10.1126/science.270.5234.286. [DOI] [PubMed] [Google Scholar]
- 20.D’Argenio DZ, Schumitzky A. ADAPT II users guide: Pharmacokinetic/pharmacodynamic systems analysis software. Los Angeles: Biomedical Simulations Resource; 1997. [Google Scholar]
- 21.Bailer AJ. Testing for the equality of area under the curves when using destructive measurement techniques. J Pharmacokinet Biopharmaceut. 1988;16:303–309. doi: 10.1007/BF01062139. [DOI] [PubMed] [Google Scholar]
- 22.Muntane-Relat J, Ourlin JC, Domergue J, Maurel P. Differential effects of cytokines on the inducible expression of CYP1A1, CYP1A2, and CYP3A4 in human hepatocytes in primary culture. Hepatology. 1995;22:1143–1153. [PubMed] [Google Scholar]
- 23.Veszelovsky E, Holford N, Thomson LL, Knowles RG, Baguley BC. Plasma nitrate clearance in mice: Modeling of the systemic production of nitrate following the induction of nitric oxide synthesis. Cancer Chemother Pharmacol. 1995;36:155–159. doi: 10.1007/BF00689201. [DOI] [PubMed] [Google Scholar]
- 24.Gobburu JV, Tenhoor C, Rogge MC, Frazier DE, Jr, Thomas D, Benjamin C, Hess DM, Jusko WJ. Pharmacokinetics/dynamics of 5c8, a monoclonal antibody to CD154 CD40 ligand suppression of an immune response in monkeys. J Pharmacol Exp Ther. 1998;286:925–930. [PubMed] [Google Scholar]
- 25.Gozzi P, Pahlman I, Palmer L, Gronberg A, Persson S. Pharmacokinetic-pharmacodynamic modeling of the immunomodulating agent susalimod and experimentally induced tumor necrosis factor alpha levels in the mouse. J Pharmacol Exp Ther. 1999;291:199–203. [PubMed] [Google Scholar]
- 26.Beutler B, Krochin N, Milsark IW, Luedke C, Cerami A. Control of cachectin tumor necrosis factor synthesis: Mechanisms of endotoxin resistance. Science. 1986;232:977–980. doi: 10.1126/science.3754653. [DOI] [PubMed] [Google Scholar]
- 27.Miller MJS, Grisham MB. Nitric oxide as a mediator of inflammation?—You had better believe it. Mediat Inflamm. 1995;4:387–396. doi: 10.1155/S0962935195000639. [DOI] [PMC free article] [PubMed] [Google Scholar]
- 28.Earp J, Krzyzanski W, Chakraborty A, Zamacona MK, Jusko WJ. Assessment of drug interactions relevant to pharmacodynamic indirect response models. J Pharmacokinet Pharmacodyn. 2004;31:345–380. doi: 10.1007/s10928-004-8319-4. [DOI] [PubMed] [Google Scholar]
- 29.Feldmann M, Brennan FM, Maini RN. Rheumatoid arthritis. Cell. 1996;85:307–310. doi: 10.1016/s0092-8674(00)81109-5. [DOI] [PubMed] [Google Scholar]
- 30.Kuhn R, Lohler J, Rennick D, Rajewsky K, Muller W. Interleukin-10-deficient mice develop chronic enterocolitis. Cell. 1993;75:263–274. doi: 10.1016/0092-8674(93)80068-p. [DOI] [PubMed] [Google Scholar]
- 31.Ochoa JB, Curti B, Peitzman AB, Simmons RL, Billiar TR, Hoffman R, Rault R, Longo DL, Urba WJ, Ochoa AC. Increased circulating nitrogen oxides after human tumor immunotherapy:Correlation with toxic hemodynamic changes. J Natl Cancer Inst. 1992;84:864–867. doi: 10.1093/jnci/84.11.864. [DOI] [PubMed] [Google Scholar]